PipsFactoryInd
- 指标
- Alfred Kamal
- 版本: 2.0
- 更新: 2 十二月 2021
- 激活: 5
Description:
This indicator is a collection of three indicators , it is 3 in 1:
If you are interesting in all of them, you can save money - this collection indicator is cheaper.
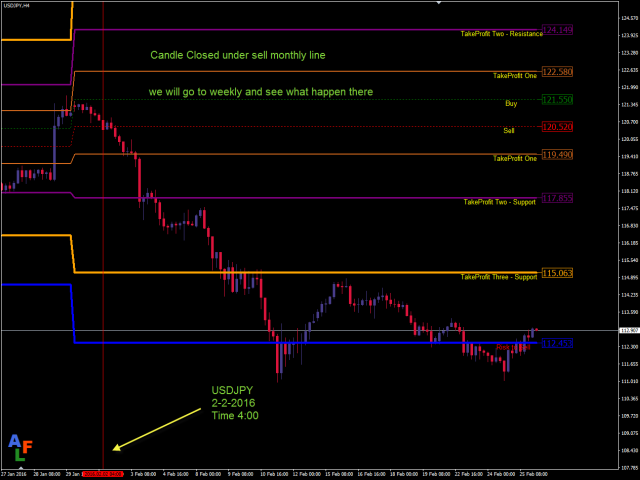
This indicator depends on High and Low price of currency in the (Last day / Last week / Last Month) depends on user input, and then I made some secret equations to draw 10 lines.
Features:
- You will know what exactly price you should enter the market.
- You will know when to be out of market.
- You will know what you should do in market:
- Buy
- Sell
- Take profit, and there are three levels to take your profit
- Support
- Resistance
- Risk to buy
- Risk to sell
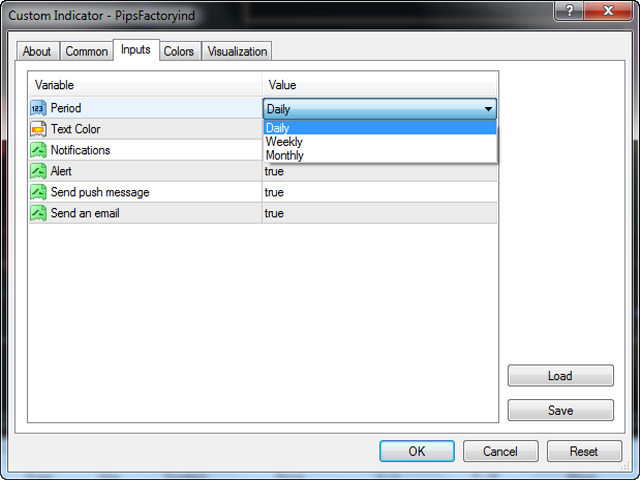
Indicator parameters:
- Period - you can choose the period you want (Daily / weekly / Monthly).
- Text Color - you can change the description lines colors.
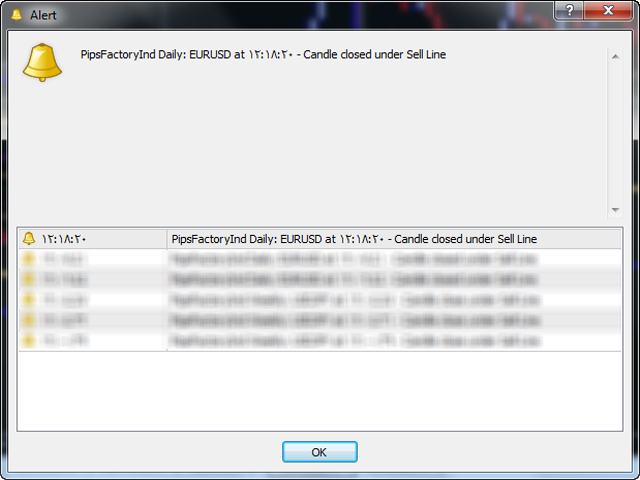
- Notifications - if it false there are no notifications at all, if it true you have to choose how indicator will send notifications to you.
- Alert - Displays a message in a separate window.
- Send push message - Sends push notifications to the mobile terminals, whose MetaQuotes IDs are specified in the "Notifications" tab.
- Send an email - Sends an email at the address specified in the settings window of the "Email" tab.
Signal Types and Time frames Used:
- You can use this indicator on any frame time frames and you have to download the historical data of D1,W1,MN1 timeframes.
- For Period Daily the best time frame is H1
- For Period Weekly the best time frame is H4
- For Period Monthly the best time frame is H4
- Enter buy order in case the price is at buy line and there are three levels to take your profit:
- First level is take profit.
- Second level is take profit too but it is also Resistance.
- Third level is take profit too but it is also Resistance.
- The fourth line is Risk to enter market with buy order.
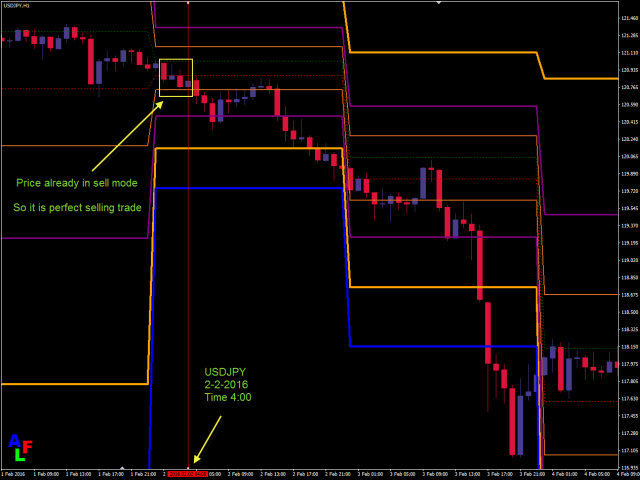
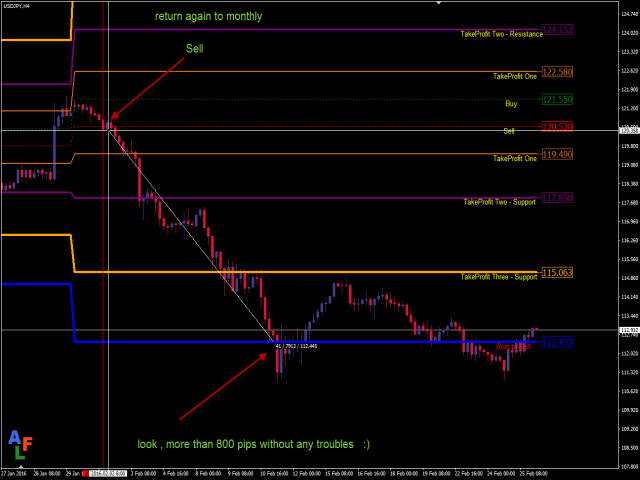
- Enter sell order in case price at sell line and there are three levels to take your profit:
- First level is take profit.
- Second level is take profit too but it is also Support
- Third level is take profit too but it is also Support.
- The fourth line is Risk to enter market with sell order.
- Currency: It works on any currency pair.
- It is very easy to use.