PZ Wolfe Waves MT5
- 指标
- PZ TRADING SLU
- 版本: 7.0
- 更新: 19 七月 2024
- 激活: 20
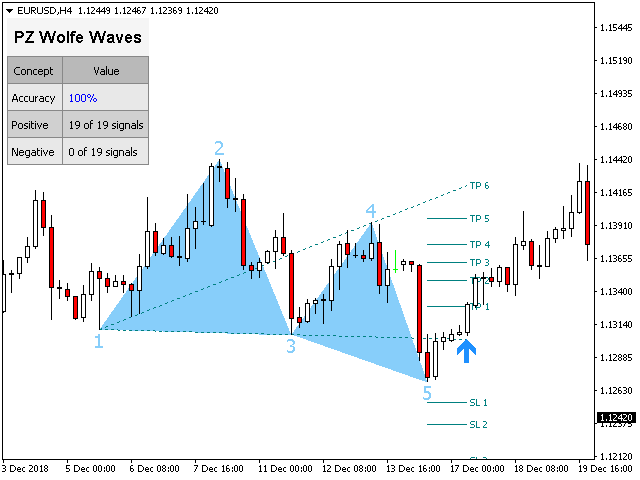
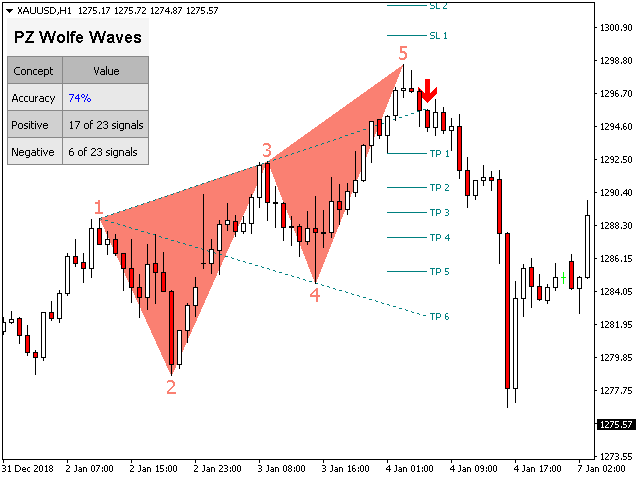
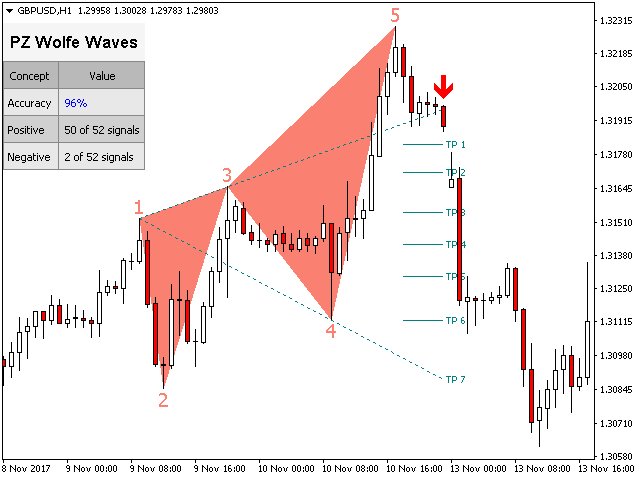
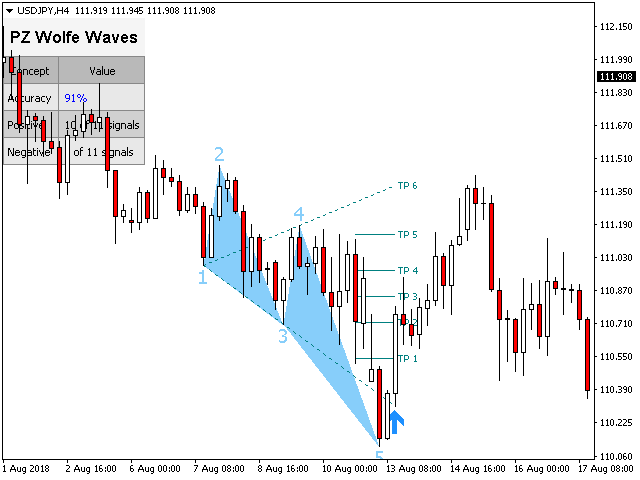
Wolfe Waves是所有金融市场中自然发生的交易模式,代表着争取均衡价格的斗争。这些模式可以在短期和长期时间内发展,并且是存在的最可靠的预测反转模式之一,通常早于强劲和长期的价格波动。
[ 安装指南 | 更新指南 | 故障排除 | 常见问题 | 所有产品 ]
- 清除交易信号
- 极易交易
- 可自定义的颜色和尺寸
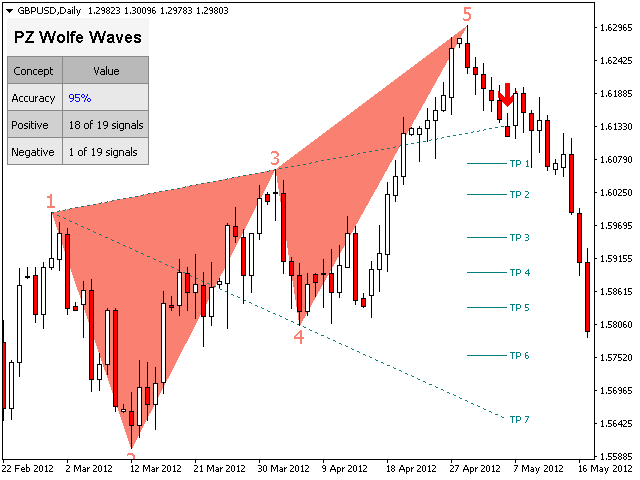
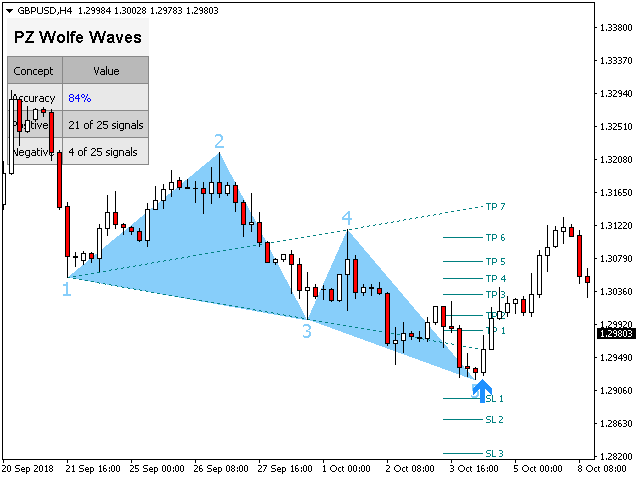
- 实施绩效统计
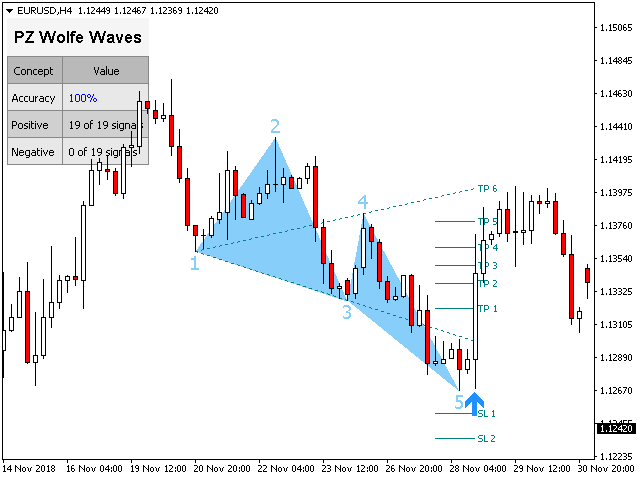
- 显示适当的止损和获利水平
- 它实现了电子邮件/声音/视觉警报
指示器同时绘制图案和突破箭头,以防止指示器在展开时重新绘制图案。但是,如果输入突破发生多次,则可能会少量重绘(不是很频繁),从而导致指示器重新绘制。该指示器为非底漆。
狼波的定义
沃尔夫波必须具有以下特征。- 波浪3-4必须停留在1-2创建的通道内
- 波浪4在波浪1-2产生的通道内
- 波动5超出了波动1和3所创建的趋势线
输入参数
- 幅度-幅度表示替代价格点之间的最小柱线量。要找到大图案,请增加幅度参数。要查找较小的模式,请减小幅度参数。您可以在图表中多次加载指标,以查找不同大小的重叠图案。
- 突破期-可选的Donchian突破期,用于确认Wolfe Wave。零表示未使用。
- 最大历史柱线-指标在图表中加载时要评估的过去柱线的数量。
- 显示统计信息-显示或隐藏统计信息显示板和效果数据。
- 显示SL / TP电平-显示或隐藏每个信号的合适SL和TP电平。
- 显示价格标签-显示或隐藏图案价格标签。
- 绘图选项-看涨或看跌的线条和标签的颜色和大小以及字体大小。
- 突破-突破箭头的颜色和大小。
- 警报-随意启用或禁用警报。
作者
ArturoLópezPérez,私人投资者和投机者,软件工程师,零零点交易解决方案的创始人。


I bought the software Wolfe Waves installed into MT5 and everything but the software will not work on MT5 did the trouble shooting and contracted customer support and no help to fix the software i have purchased a software for 149.00 that dose not work that is not right to charge someone money for software and not even help them with it. The on the video nothing comes up like it shows on the video. This product sucks and i would say stay way it not worth it. The Company should be ashamed to take someone money and not help them or anything 149.00 may not seem like a lot but to get nothing for something that you paid for is not right