Nasdaq Pro

The subscription provides an integrated access to two key data elements of Nasdaq: Nasdaq Basic and NLS Plus. Using this combination, you can perform a deep and thorough analysis of the market activity on the main US exchanges.

Nasdaq Basic provides the following key data elements for all U.S. exchange-listed equities:

  • Nasdaq Last Sale (NLS) – Real-time tick-by-tick price and size information for orders executed within the Nasdaq execution system as well as trades reported to the FINRA/Nasdaq TRF.
  • Nasdaq BBO (QBBO) – Real-time best bid and offer available within the Nasdaq market center.

Nasdaq Last Sale (NLS) Plus provides access to all Nasdaq U.S. markets' last sale data. It includes:

  • All transactions from the Nasdaq U.S. equity market systems: Nasdaq, FINRA/Nasdaq TRF, BX and PSX.
  • Market data for all U.S. equity securities listed on NYSE, NYSE American, NYSE Arca, BATS and Nasdaq.

Our solution combines the price flows from Nasdaq exchanges for each symbol, providing you with aggregated data.

Technical Details:
  • Level 1 real time, tick-by-tick
  • Transmitted directly from Nasdaq data channels
Application:
  • Get deep insights into current market state for traders and data analysts
  • Develop and test your strategies using real market data
  • Evaluate risks and make trade decisions based on actual market data
  • Suitable for individual investors and financial professionals


MARKET DATA TERMS OF USE

Terms and Definitions

- Professional Trader: means a natural person or an organization that:

  • Uses Market Data for commercial or professional purposes, such as for trading, general business activities, making investment decisions on behalf of an employing company, or adding value to the activities of enterprises, organizations or third parties.
  • Engages in trading or market analysis on behalf of the employer, engages in the purchase or sale of securities or commodities on behalf of the employer, analyzes market data to make investment or trading decisions on behalf of the employer.
  • Works in the brokerage, banking, investment or financial services industry and/or acts on behalf of an organization engaged in brokerage, banking, investment or financial services.
  • Is registered or qualified with any state, federal or international financial regulatory authority such as FINRA, NFA, CSA, etc.

- Non-Professional: Trader means a natural person who:

  • Uses Market Data solely for managing their personal assets and does not use it for commercial purposes, managing corporate funds, or trading with the public.
  • Is not registered or qualified with any state, federal or international financial regulatory authority, professional association or recognized professional organization such as FINRA, NFA, CSA, IAPD, and others.
  • Does not engage in the purchase or sale of securities or commodities on behalf of an employer; does not analyze market data to make investment or trading decisions on behalf of an employer.
  • Is not employed as a broker, dealer, financial advisor, asset manager or similar role.
  • Uses their own own capital for trading and does not trade on behalf of a corporation, partnership, organization or other entity or third-party person; does not enter into agreements on sharing profits from trading activities or receiving payment or other fees for trading activities.
  • Does not receive office premises, hardware, equipment or other benefits in exchange for trading or working as a financial consultant from any person, firm, or legal entity.
  • Does not use the data to manage funds and/or assets of third parties, with or without payment, and does not participate in the activities of any investment clubs.

- Market Data: means data provided by a Market Data Provider and containing information related to financial markets and financial instruments, including, but not limited to, price quotes, trading volumes, historical data, transaction data, indices, and other information that can be utilized for analysis and decision-making in financial markets.

- Market Data Provider: means an organization or institution that generates and/or collects and disseminates Market Data and makes it available for use by third parties.

- Market Data Distributor: means the MetaQuotes company that receives Market Data from the Market Data Provider subject to the relevant agreements with the Market Data provider and that provides it to end-users through the MetaTrader 5 platform.

- Realtime Market Data: means Market Data that is delivered by the Market Data Distributor from the Market Data Provider to end-users "immediately" after collection and processing. "Realtime" implies that less than 15 (fifteen) minutes have passed since the first dissemination of Market Data from the Market Data Provider, as defined by the timestamp/date reference of the applicable system/platform of the Market Data Provider.

- Delayed Market Data: means Market Data that is delivered by the Market Data Distributor from the Market Data Provider to end-users with a delay relative to actual market events and that is provided to the end-users through the MetaTrader 5 terminal for free. The "Delay" implies that 15 (fifteen) minutes or more have passed since the first dissemination of Market Data from the Market Data Provider, as defined by the timestamp/date reference of the applicable system/platform of the Market Data Provider.

- Realtime Market Data Subscription: means a paid service that provides registered users with access to Realtime Market Data through the MetaTrader 5 trading platform.

- MetaQuotes' Website: means any and all elements, Contents and the ‘look and feel’ of the website available under the URL, www.mql5.com, www.metaquotes.net, www.metatrader4.com, www.metatrader5.com – among other URL’s, from which website the MetaQuotes' Software can be downloaded.

1. All rights, title and interest in relation to any data and/or other information provided by the Market Data Provider, as well as all such data/information made available by the Market Data Distributor through the MetaTrader 5 trading platform, in all languages, formats, and media worldwide, including all copyrights and trademarks, are the property of the Market Data Provider.

2. Market Data is provided under a non-exclusive, non-transferable, limited-duration license. Any copying, distribution, sublicensing, assignment, transmission, sale, leasing, dissemination, or other use of Market Data without the written permission of the relevant Market Data Provider is prohibited. The Market Data user shall not engage in the operation of any illegal business use or permit anyone else to use the Market Data or any part thereof, for any illegal purpose or violate any terms and conditions of the Market Data Provider, Market Data Distributor or any financial regulatory authority or other applicable law, rule or regulation. For Non-Professional Trader, the Market Data is licensed only for personal use. For Professional Trader the Market Data is licensed for the internal business use and/or personal use of the Professional Trader. The shall utilize Market Data exclusively within the scope of the provided license and may not utilize the data for other purposes without the appropriate consent of the Market Data Provider.

3. Market Data is provided to users and is available for display only in the user interface of the MetaQuotes website or in the MetaTrader 5 client trading terminal, including but not limited to, MetaTrader 5 Desktop terminal, MetaTrader 5 Mobile terminal for iOS, MetaTrader 5 Mobile terminal for Android and MetaTrader 5 Web terminal.

4. Users bear full responsibility for compliance with these Market Data Terms of Use. Violation of these terms may result in the restriction or complete termination of access to Market Data. MetaQuotes reserves the right, at its sole and absolute discretion, to take appropriate legal action against users found to be in violation of these terms and conditions.

5. Realtime Market Data is provided only to registered users with an active account on the MetaQuotes Website and/or on MetaQuotes' demo trading server. Upon registering on the MetaQuotes Website, the user shall read and agree to all relevant Terms of Use of the MetaQuotes Website.

6. Before using Realtime Market Data, the user must confirm their trader status either as a Non-professional Trader or as a Professional Trader in accordance with the criteria described in Section "Terms and Definitions" of this Agreement and select the appropriate subscription. The cost of a RealTime Market Data Subscription for Non-Professional Traders and Professional Traders may differ significantly. Users bear the full responsibility for providing truthful information about their trader status.

7. By using Market Data in the MetaTrader 5 trading platform (including Delayed and Realtime Market Data), you acknowledge that you have read and accepted the relevant Market Data Terms of Use. Upon subscribing to Realtime Market Data, you agree to the subscription payment terms, cancellation policies, and refund conditions published on the MetaQuotes Website.

8. You assume responsibility for the confidentiality and use of any username and email address used to register your access and use of Market Data. You are responsible for maintaining the confidentiality of your password and account and are fully responsible for all activities that occur under your password or account. You agree to (a) immediately notify MetaQuotes of any unauthorized use of your password or account or any other breach of security, and (b) ensure that you exit from your account at the end of each session. MetaQuotes shall not be liable for any loss or damage arising from your failure to comply with these requirements.

9. Market Data provided by MetaQuotes on the MetaQuotes Website or in the MetaTrader 5 trading platform may differ from the original data stream provided by the Market Data Provider due to internal source data preparation mechanisms and algorithms.

10. Content Disclaimer. MetaQuotes does not represent or warrant that any information available through MetaQuotes' services or on the MetaQuotes Website or in the MetaTrader 5 trading platform is accurate, reliable, up-to-date, complete, or suitable for your needs. Various information available through MetaQuotes' services or on the MetaQuotes Website or in the MetaTrader 5 trading platform may be specially obtained by MetaQuotes from professional enterprises or organizations, such as exchanges, news providers, market data providers, and other content providers, which are considered as reliable information sources (collectively referred to as "Market Data Providers"). However, due to various factors, including the possibility of human, software, and mechanical errors, the accuracy, completeness, timeliness, results obtained from use, and proper sequence of information available through MetaQuotes' services and on the MetaQuotes Website cannot be guaranteed by MetaQuotes. MetaQuotes makes no warranties and bears no liability for third-party content. You use any third-party content at your own risk.

11. Disclaimer regarding investment decisions and trading. Decisions regarding the purchase, sale, holding, or trading of securities, commodities, and other investment instruments bear inherent risks. You should seek the advice of qualified financial professionals before making such decisions. Any currency trading, security trading or other investments involve the risk of substantial loss. The practice of "day trading" involves high risk of losing significant amounts of money rapidly. Before undertaking any trading program, you should consult with a qualified financial professional. Carefully consider whether such trading is suitable for you based on your financial condition and ability to bear financial risks. Under no circumstances shall MetaQuotes be liable for any losses or damage incurred by you or any third party as a result of any trading or investment activity conducted based on any information or materials obtained through MetaQuotes's services, on the MetaQuotes Websites, MetaQuotes programs, or other services.


推荐产品
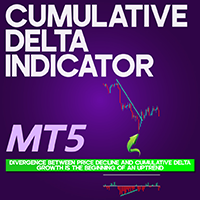
Cumulative Delta Indicator for MetaTrader 5 The Cumulative Delta Indicator is a dedicated volume analysis tool on MetaTrader 5 that monitors market buying and selling pressure. By comparing order flow data, it displays cumulative volume changes to help traders identify divergence signals. This MT5 indicator supports the detection of strong market trends, enhances liquidity analysis, and confirms price action behavior. «Indicator Installation & User Guide» MT5 Indicator Installation  |  Cumulativ
FREE
Value Chart Candlesticks
Flavio Javier Jarabeck
4.69 (13)
The idea of a Value Chart indicator was presented in the very good book I read back in 2020 , " Dynamic Trading Indicators: Winning with Value Charts and Price Action Profile ", from the authors Mark Helweg and David Stendahl. The idea is simple and the result is pure genius: Present candlestick Price analysis in a detrended way! HOW TO READ THIS INDICATOR Look for Overbought and Oversold levels. Of course, you will need to test the settings a lot to find the "correct" one for your approach. It
FREE
概述 本指标是经典 Donchian 通道 的增强版,增加了多种实用的交易功能。 除了标准的三条线(最高、最低和中线),系统能够检测 突破 ,并在图表上用箭头进行可视化标记,同时只显示 与当前趋势方向相反的那条线 ,让图表更加简洁。 功能包括: 可视化信号 :突破时在图表上绘制彩色箭头 自动通知 :弹窗、Push 推送和 Email 邮件 RSI 过滤 :根据市场相对强弱验证信号 个性化设置 :颜色、线条粗细、箭头符号、RSI 阈值等 工作原理 Donchian 通道计算: 上轨线 :最近 N 根已收盘 K 线的最高价 下轨线 :最近 N 根已收盘 K 线的最低价 中线 :最高价和最低价的平均值 看涨突破 :收盘价高于上轨线 看跌突破 :收盘价低于下轨线 指标会: 绘制三条 Donchian 通道线 仅在 方向变化后的首次突破 绘制箭头 隐藏顺应趋势方向的那条线(上涨趋势: 只显示红色下轨线;下跌趋势: 只显示绿色上轨线) 可选用 RSI 过滤突破信号,减少虚假突破 支持实时发送通知 参数说明 Donchian 通道设置 indPeriod :计算通道高低点的已收盘 K 线数量 Lin
FREE
Market Profile 3 ForexArby com
Hussien Abdeltwab Hussien Ryad
4 (15)
Market Profile 3 MetaTrader 5 indicator  version 4.70— is a classic Market Profile implementation that can show the price density over time, outlining the most important price levels, value area, and control value of a given trading session. This indicator can be attached to timeframes between M1 and D1 and will show the Market Profile for daily, weekly, monthly, or even intraday sessions. Lower timeframes offer higher precision. Higher timeframes are recommended for better visibility. It is als
FREE
Key level wedge MT5
Presley Annais Tatenda Meck
The   Key level wedge MT5   indicator automatically draws rising wedge pattern and falling wedge pattern for you on the chart. This pattern is really good when used as a confirmation entry at key support & resistance, supply & demand and reversal zones. Advantages  The   Key level wedge MT5   block DOES NOT RE-PAINT, giving you confidence when a signal appears and also helps when looking back.  The   Key level wedge MT5   includes an on/off button on the chart to easily keep the charts clean
Double TMA with Reversal Zones
Clayton Prickett
4.5 (10)
Note from Developer: This is the lite version of the Double TMA with Bands Indicator. You can find the paid version that comes with alerts and on screen signal arrows built in here . I will also be selling an EA based on this trading system soon once all backtesting and optimization have been completed. Unlock your trading potential with the Double TMA Indicator with Reversal Detection! Designed for swing and reversal trading, this versatile tool integrates two Triangular Moving Averages (
FREE
Gap Detector Pro
Andres Felipe Carvajal Rodriguez
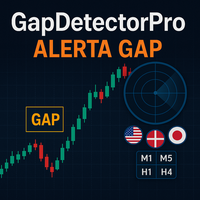
GapDetector Pro 实时识别三种级别的 价格跳空(缺口) : 蓝点 (Punto azul): 早期警报,预测可能形成跳空。 黄点 (Punto amarillo): 低交易量和宽点差条件,表明跳空概率高。 白点 (Punto blanco): 确认蜡烛图之间已形成的实际跳空。 参数调整 (参数调整) 用户可以根据自己的需求调整参数: VolumeDropRatio (成交量下降比率): 低值 会产生更高的 灵敏度 和更多信号; 高值 要求更强烈的成交量下降,并产生更少的信号。 MaxSpread (最大点差): 低值 更 严格 ,只接受点差较小的跳空; 高值 允许识别点差较大的跳空。 GapThresholdPips (跳空点数阈值): 低值 检测微小跳空; 高值 只确认大的缺口。 EarlyWarningThreshold (早期警报阈值): 低值 更频繁地预警; 高值 要求更清晰的信号才会标记警报。 ATR / VolatilityDropRatio (平均真实波幅 / 波动性下降比率): 控制可接受的最小 波动性 。 高值 会过滤掉更多信号,更 严格 ; 低值 允许
FREE
Follow The Line MT5
Oliver Gideon Amofa Appiah
4.52 (29)
This indicator obeys the popular maxim that: "THE TREND IS YOUR FRIEND" It paints a GREEN line for BUY and also paints a RED line for SELL. (you can change the colors). It gives alarms and alerts of all kinds. IT DOES NOT REPAINT and can be used for all currency pairs and timeframes. Yes, as easy and simple as that. Even a newbie can use it to make great and reliable trades. NB: For best results, get my other premium indicators for more powerful and reliable signals. Get them here: https://www.m
FREE
LT Donchian Channel
Thiago Duarte
4.83 (6)
Donchian Channel is an indicator created by Richard Donchian. It is formed by taking the highest high and the lowest low of the last specified period in candles. The area between high and low is the channel for the chosen period. Its configuration is simple. It is possible to have the average between the upper and lower lines, plus you have alerts when price hits one side. If you have any questions or find any bugs, please contact me. Enjoy!
FREE
VisualVol EURUSD
Maxim Kuznetsov
The indicator highlights the points that a professional trader sees in ordinary indicators. VisualVol visually displays different volatility indicators on a single scale and a common align. Highlights the excess of volume indicators in color. At the same time, Tick and Real Volume, Actual range, ATR, candle size and return (open-close difference) can be displayed. Thanks to VisualVol, you will see the market periods and the right time for different trading operations. This version is intended f
FREE
Friend of the trend
Anderson De Assis
Friend of the Trend: Your Trend Tracker Master the market with Friend of the Trend , the indicator that simplifies trend analysis and helps you identify the best moments to buy, sell, or wait. With an intuitive and visually striking design, Friend of the Trend analyzes price movements and delivers signals through a colorful histogram: Green Bars : Signal an uptrend, indicating buying opportunities. Red Bars : Alert to a downtrend, suggesting potential selling points. Orange Bars : Represent cons
FREE
The   Time_Price_SQ9_Degree   indicator is based on the 9 Gann square. Using this indicator, you can identify strong time and price zones. The indicator displays the levels as a degree value. The degrees can be set in the settings. After launching, the MENU button appears. If it is highlighted, it can be moved to any point on the graph, and after double-clicking on it, it stops being highlighted and menu buttons appear. To hide the menu, just double-click on the button, it will become highlight
Trend Catcher with Alert MT5
Issam Kassas
4.6 (129)
趋势捕捉器: 具有警示指标的趋势捕捉器策略是一种多功能的技术分析工具,可帮助交易员识别市场趋势和潜在的进出点。它采用动态趋势捕捉器策略,根据市场条件进行调整,清晰地呈现趋势方向。交易员可以自定义参数,以符合其偏好和风险容忍度。该指标有助于识别趋势,发出潜在的反转信号,充当跟踪止损机制,并提供实时警报,以便及时应对市场。 具有警示指标的趋势捕捉器策略是一种多功能的技术分析工具,可帮助交易员识别市场趋势和潜在的进出点。它采用动态趋势捕捉器策略,根据市场条件进行调整,清晰地呈现趋势方向。交易员可以自定义参数,以符合其偏好和风险容忍度。该指标有助于识别趋势,发出潜在的反转信号,充当跟踪止损机制,并提供实时警报,以便及时应对市场。 特点: 趋势识别:信号牛市趋势和熊市趋势。 趋势反转:当蜡烛颜色从牛市变为熊市,反之亦然时,提醒可能的反转。 实时警报:为新趋势识别生成警报。 建议: 货币和货币对:EURUSD,AUDUSD,XAUUSD... 时间框架:H1。 账户类型:任何ECN,低点差账户。
FREE
GorMaster Pro
Manuel Damian Ortiz Fernandez
GorMaster_Pro — Sesgo confiable, noticias y técnica en una sola pantalla Visión GorMaster_Pro es una herramienta indispensable para cualquier tipo de trader (scalper, intradía o swing) porque combina información fundamental y técnica para darte una lectura fiel y accionable del mercado. En una sola vista verás: sesgo direccional BUY/SELL/RANGO , ventanas de noticias en tiempo real que congelan la operativa, métricas técnicas clave (ATR_Z, RangeRatio, ADX, SpreadZ), sesiones y alertas . Todo org
Delta Profile Volume
Teresinha Moraes Correia
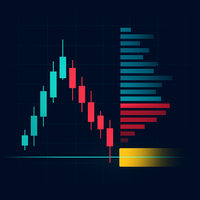
指标技术说明 – Delta Profile for MetaTrader 5 Delta Profile 是为 MetaTrader 5 开发的一款指标,用于在指定的 K 线区间内对成交量流进行详细分析。它能够在不同的价格水平上对正向成交量(与上涨相关)和负向成交量(与下跌相关)的不平衡进行结构化和可视化展示。最终,用户可以清晰地识别图表中成交最为集中的区域,以及真实的市场不平衡形成的位置。 以下是该指标的主要技术特征与参数说明。 核心概念 指标会识别 价格水平 ,并将其分类为正向成交量、负向成交量,以及净 Delta(正负成交量的差值)。 每个价格水平会在图表中以 水平条形 显示,帮助用户直观观察市场活跃区和不平衡区域。 用户可自由控制 分析的 K 线数量 、 价格精度(小数位数) 、 显示的最大水平数量 以及 可视化样式 。 主要功能 价格水平映射 :根据设定的精度对价格进行四舍五入,并累计对应 K 线的成交量。 净 Delta 计算 :显示正负成交量的差值,提供每个价格区间的客观数值。 最强 Delta 水平突出显示 :自动识别 Delta 绝对值最大的价格水平,并用特殊颜色标
Easy Correlations Indicator The Easy Correlations Indicator is designed to help traders analyze the relationship between two correlated instruments. By monitoring the distance between their Relative Strength Index (RSI) values, the indicator highlights situations where one instrument has moved significantly further than the other. This creates potential trading opportunities: Sell the stronger instrument (overstretched RSI) Buy the weaker instrument (lagging RSI) Because the positions are opened
FREE
Ratio Indicator
Rafael Gazzinelli
5 (2)
Ratio Indicator - User Guide Special Deal! Leave a review and get the indicator  Long & Short Cointegration Analyzer for free — just send me a message! This Ratio indicator between assets allows you to monitor and trade the price relationship between two assets selected by the user. It calculates the ratio between the prices of two assets, referred to as Asset1 and Asset2 (e.g., "GBPUSD" and "EURUSD"), and plots a moving average of the ratio along with Bollinger Bands . These bands are used to
FREE
ZP Day Trading Indicator in MT5 The ZP Day Trading Indicator is one of the tools developed based on Price Action trading style concepts in MetaTrader 5. This indicator uses color-coded boxes to identify Trading Ranges on the chart. A trading range forms when the price moves within a specific range between a resistance level (ceiling) and a support level (floor) over a period of time. In such scenarios, buyers and sellers reach equilibrium within the defined range. «Indicator Installation & User
FREE
Weis Waves
Flavio Javier Jarabeck
2.83 (18)
The original author is David Weis, an expert in the Wyckoff Method. The Weis Wave is a modern adaptation of the 1930's Wyckoff Method, another expert in Tape Reading techniques and Chart Analysis. Weis Waves takes market volume and stacks it into waves according to price conditions giving the trader valuable insights about the market conditions. If you want to learn more about this subject you can find tons of videos in YouTube. Just look for "The Wickoff Method", "Weis Wave" and "Volume Spread
FREE
Trendline mt5 indicator
David Muriithi
3 (1)
Are you tired of drawing trendlines every time you're analyzing charts? Or perhaps you would like more consistency in your technical analysis. Then this is for you. This indicator will draw trend lines automatically when dropped on a chart. How it works Works similar to standard deviation channel found on mt4 and mt5. It has 2 parameters: 1. Starting Bar 2. Number of bars for calculation The   starting bar   is the bar which drawing of the trend lines will begin, while the   number of bars for c
FREE
Basic Vwap
james mugendi
4 (1)
Simple Vwap with the daily, weekly and monthly VWAP is the abbreviation for   volume-weighted average price , which is a technical analysis tool that shows the ratio of an asset's price to its total trade volume. It provides traders and investors with a measure of the average price at which a stock is traded over a given period of time. How it's used Identify entry and exit points:   Traders can use VWAP to determine when to buy or sell an asset.   Understand price trends :  Traders can use V
FREE
Spike Catch Pro
Amani Fungo
4.14 (7)
Spike Catch Pro 22:03 release updates Advanced engine for searching trade entries in all Boom and Crash pairs (300,500 and 1000) Programmed strategies improvements Mx_Spikes (to combine Mxd,Mxc and Mxe), Tx_Spikes,   RegularSpikes,   Litho_System,   Dx_System,   Md_System,   MaCross,   Omx_Entry(OP),  Atx1_Spikes(OP),   Oxc_Retracement (AT),M_PullBack(AT) we have added an arrow on strategy identification, this will help also in the visual manual backtesting of the included strategies and see ho
FREE
Trade Performance Information
Andres Mauricio Serrano Quintero
This indicator will help you track performance of your trades, even scalping trades.  You can use it with the Arab, and many other traders.  This indicator displays essential trading account information directly on your chart. It positions itself in one of the four corners of the screen and showcases details such as: Symbol: The symbol of the asset currently displayed on the chart. Profit/Loss: The total profit or loss in dollars for the current symbol. Pips: The total number of pips gained or
FREE
WAPV Box Effort x Result
Eduardo Da Costa Custodio Santos
WA_PV_BOX_EFFORT X MT5 的结果 WAPV Box Effort x Result Indicator 是 Package Indicators 组(Wyckoff Academy Wave Market)的一部分。 MT5 的 WAPV Box Effort x Result Indicator 可帮助您阅读价格和交易量。它的阅读包括协助识别努力x结果 在图表创建的波浪中。 当方框为绿色时,MT5 的 WAPV Box Effort x Result Indicator 表示交易量有利于需求,而当方框为红色时 量有利于供应。 方框越大,成交量相对于价格的位移越大。如果价格的上升波与 Box 的大小不成比例,则 努力x结果。 以一种非常直观的方式,我们可以识别出数量和价格之间的这种差异。 MT5 的 WAPV Box Effort x Result Indicator 还允许您通过将指标置于零轴下方来改善可视化。 以即时交易量和实际交易量在市场上运作 看图片:
AP VWAP Bands Pro (MT5) Volume-weighted average price with ±σ bands for clear intraday bias, mean-reversion zones, and dynamic support/resistance. Works on crypto (incl. BTC) , FX , indices , and metals . Uses tick-volume when real volume isn’t available. What it shows VWAP line (volume-weighted mean price). Two envelopes around VWAP (default ±1σ and ±2σ) to highlight balance vs. extension. Reset modes : Day , Week , or Anchor Time (HH:MM) to start VWAP where you need it (e.g., exchange open). W
FREE
Simple QM Pattern MT5
Suvashish Halder
5 (1)
Simple QM Pattern   is a powerful and intuitive trading indicator designed to simplify the identification of the Quasimodo (QM) trading pattern. The QM pattern is widely recognized among traders for effectively signaling potential   reversals   by highlighting key market structures and price action formations. This indicator helps traders easily visualize the QM pattern directly on their charts, making it straightforward even for those who are new to pattern trading. Simple QM Pattern includes d
FREE
Cumulative Delta MT5
Evgeny Shevtsov
4.54 (59)
The indicator analyzes the volume scale and splits it into two components - seller volumes and buyer volumes, and also calculates the delta and cumulative delta. The indicator does not flicker or redraw, its calculation and plotting are performed fairly quickly, while using the data from the smaller (relative to the current) periods. The indicator operation modes can be switched using the Mode input variable: Buy - display only the buyer volumes. Sell - display only the seller volumes. BuySell -
FREE
Nem Nem
Taha Saber Ashour Kamel
Nem Nem is super accurate mt5 indicator it is working with any pair any time frame it will show and provide you with high Winrate signal you can use for forex pairs , gold and any other pairs it is easy to use also you can see the white lines for starting and end of signals it will help you to read the chart and enter and make correct decisions in trades. also it  will be clear for you when to enter and exit from any trades
FREE
Free automatic Fibonacci is an indicator that automatically plots a Fibonacci retracement based on the number of bars you select on the BarsToScan setting in the indicator. The Fibonacci is automatically updated in real time as new highest and lowest values appears amongst the selected bars. You can select which level values to be displayed in the indicator settings. You can also select the color of the levels thus enabling the trader to be able to attach the indicator several times with differe
FREE
Best SAR MT5
Ashkan Hazegh Nikrou
4.33 (3)
描述 :  我们很高兴推出基于外汇市场 (PSAR) 中专业和流行指标之一的新免费指标 该指标是对原始抛物线 SAR 指标的新修改,在专业 SAR 指标中,您可以看到点和价格图表之间的交叉,这交叉不是信号,而是谈论运动结束的可能性,您可以从新的蓝点开始买入,并在第一个蓝点之前设置止损,最后您可以在点交叉价格图表时退出。 如何打开买入或卖出信号? 通过第一个蓝点打开买入交易并通过第一个红点打开卖出交易 正确的止损在哪里? 安全止损可以在第一个点上,(在第一个蓝点的买入情况下和在第一个红点的卖出情况下) 正确的止盈在哪里? 止盈可以根据止损距离和RR进行调整,所以我的建议是2 RR,是止损的2倍 如果我们盈利但仍未达到 tp,那么退出点在哪里? 第一个退出警报可以在点和价格图表之间交叉。 该指标何时释放警报? 一旦新的点出现在新的方向,指标就会释放警报 我们如何根据这个指标构建 EA 以及它的成本是多少? 我们已准备好通过一些强大的完整功能基于此免费指标构建指标,例如基于点的追踪止损和基于权益百分比的资金管理,您可以通过填写下表来订购 https://www.mql
FREE
筛选:
无评论
回复评论