ADX Color Indicator
- 指标
- Adrian Hernandez Castellanos
- 版本: 2.1
- 更新: 29 二月 2024
- 激活: 20
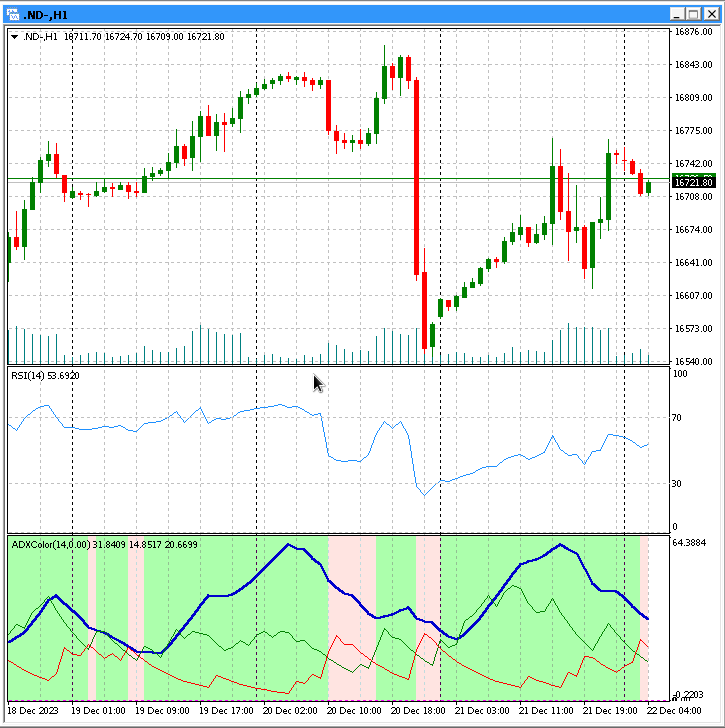
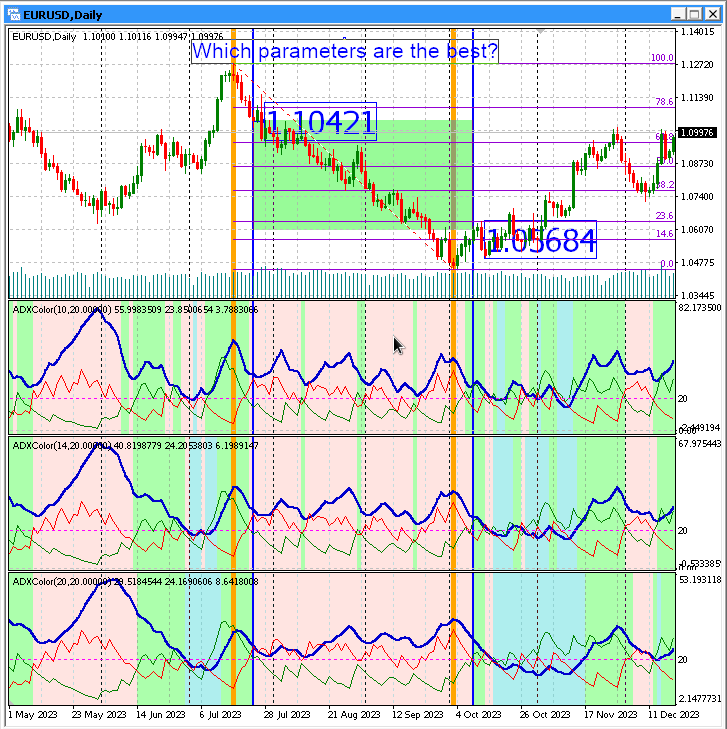
平均方向运动指数 ( Average Directional Movement Index - ADX) 指标,根据买卖趋势将背景着色。
ADXColor 指标是用于测量趋势强度的技术指标。指标的背景颜色由其参数确定,仅绘制最后 400 个条形图。
您可以修改的参数:
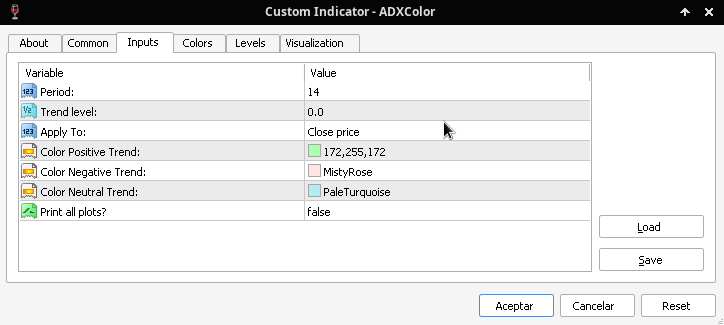
- Period:ADX 指标的时间周期。
- Trend Level:ADX 指标必须达到的最低水平,才能被视为看涨或看跌趋势(默认为 0.0)。
- Apply To:指标将应用到的价格(Close price, Open price, High price, Low price, Median price, Typical price, Weighted price)。
- Color Positive Trend:看涨趋势的背景颜色。
- Color Negative Trend:看跌趋势的背景颜色。
- Color Neutral Trend:中性趋势的背景颜色。
- Print all plots?:默认情况下,指标仅绘制最近两周的值。要绘制从图表开头的值,请将此参数设置为“true”。
如何使用指标:
要使用指标,只需将其拖放到图表上即可。它就像您在 Metatrader 中使用过的任何其他指标一样工作。
结论:
此指标是使用 ADX 指标的市场交易员的便捷工具。它有助于实时识别看涨、看跌和中性趋势。
注意事项:
- 如果您是市场分析师或交易不同时间框架,建议使用免费工具:https://www.mql5.com/zh/market/product/109888
- 由于资源消耗高和执行速度快,建议将“Print all plots?”参数设置为“false”。这将将指标获得的值限制为最多两周。
- 仅使用 400 个条形图的原因是市场交易员通常需要快速的视觉数据。有关此事的任何意见,请发送至相应部门。但是,如果您需要暂时超过此限制,也可以使用第一条注释中提到的免费工具。两种工具兼容。