适用于MetaTrader 4的技术指标 - 5
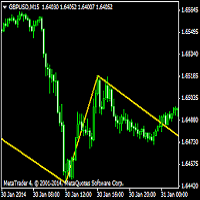
The Zig Zag indicator plots points on the chart whenever prices reverse by a percentage greater than a pre-chosen variable. Straight lines are then drawn, connecting these points. The indicator is used to help identify price trends. It eliminates random price fluctuations and attempts to show trend changes. L'indicateur Zig Zag peut être utilisé pour filtrer les mouvements de prix ... 1 Minute Indicators Used: RSI (30 / 70) Fibonacci (1 - 0.784)

Fibonacci fast drawing tool with 4 outstanding features 1. Quick action by clicking on the candle 2. Draw the bottom of the selection exactly 3. Include Standard Fibo levels and display prices at levels 4. Draw extended fibo to identify the price zone after break out
Please see video clip below for more details. Free download link of FiboCandleClick indicator inside youtube.

Pivots MT4 - Простой и удобный индикатор уровней pivot , рассчитывает уровни по методам Classic , Fibonacci , DeMark , Camarilla , WooDie , Central Pivot Range . Индикатор выгодно отличается следующим
Рассчитывает уровни pivot по методам Classic , Fibonacci , DeMark , Camarilla , WooDie , Central Pivot Range ; Выводит на графике текущие уровни и уровни на предыдущих периодах; Выводит на графике выбранные метод и период, названия уровней и их ценовые значения. Параметры Pivot Method - Вып

El Fibonacci automatico de Grupo Bazan Inversores, permite al usuario que lo utiliza, ver desplegado de manera automatica los niveles Fibonacci de los periodos que el mismo usuario haya seleccionado.
Esto permimte que el usuario no tenga que seleccionar el Fibonacci de la plataforma de metatrader 4 para colocar manualmente la figura, pudiendose concentrar exclusivamente en su analisis u operativa.
TrendRange Indicator works on M1, M5, M15, M30, H1 and H4 timeframes. It indicates real market trend, support and resistance levels. In other words, it confirms trade directions. Scalpers especially, Intraday, swing, intermediate and long term traders will especially find this indicator useful. It uses customized show/hide buttons namely: "DRAW", "HILO", and "LEVEL" lines crossings and histograms ("AWOS" for Awesome Oscillator, "BUBE" for Bull Power and Bear Power & "GATO" for Gator Oscilla

All in One package includes the Oscillator Predictor , MACD Predictor , Thrust Scanner and Advanced Fibonacci indicators which are mandatory for applying Dinapoli trade plans.
Please visit below links for detailed explanations of indicators. Advanced Fibonacci Indicator => https://www.mql5.com/en/market/product/52834 Thrust Scanner Indicator => https://www.mql5.com/en/market/product/52830 Overbought /Oversold Predictor indicator => https://www.mql5.com/en/market/product/52621
Macd

Introduction to Fibonacci Volatility Indicator Volatility indicator can help you to detect any statistical advantage for your trading. Especially, if you are trading with Price Action and Price Patterns, then we recommend to use the Volatility indicator together with your strategy. Especically, Fibonacci Volatility indicator combines the market volatiltiy with Fibonacci Analysis to provide you more advanced volatiltiy indicator. Main Features Fibonacci Volatility in Z score Configuration Mode Fi

The Squat is a function of the range of a given price bar and the volume, or TIC volume, that occurs while that range is being created. The basic idea is that high volume and little price movement indicate substantial support or resistance. The idea behind the approach to this indicator is to first look for likely Fibonacci support and resistance and then see if Squat manifests when that point is reached. The indicator determines one of the high probability patterns of DiNapoli. It does not re

The indicator is the advanced form of the MetaTrader 4 standard Fibonacci tool. It is unique and very reasonable for serious Fibonacci traders. Key Features Drawing of Fibonacci retracement and expansion levels in a few seconds by using hotkeys. Auto adjusting of retracement levels once the market makes new highs/lows. Ability to edit/remove any retracement & expansion levels on chart. Auto snap to exact high and low of bars while plotting on chart. Getting very clear charts even though many ret

FTU 斐波那契数列 该指标从价格行为中绘制回撤水平的斐波那契水平 特征: 多个斐波那契水平可调 从范围更改颜色和条形数量 2 条线表示 50 条柱历史,2 条线表示 20 条柱历史,均显示 38 和 61 斐波那契水平 用法: 目的是研究或衡量价格回撤 从范围内更改颜色和条数 在任何时间范围内使用,产品/对,非重绘,快速加载 未来的更新即将推出.. 看看我的其他产品和视频,结合我的指标并在您加入时收到每日偏差和高低预测。 FTU fěi bō nà qì shùliè gāi zhǐbiāo cóng jiàgé xíngwéi zhōng huìzhì huí chè shuǐpíng de fěi bō nà qì shuǐpíng tèzhēng: Duō gè fěi bō nà qì shuǐpíng kě tiáo cóng fànwéi gēnggǎi yánsè hé tiáo xíng shùliàng 2 tiáo xiàn biǎoshì 50 tiáo zhù lìshǐ,2 tiáo xiàn biǎoshì 20 tiáo zhù lìshǐ, jūn
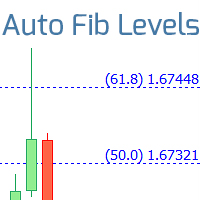
Automatically draws Fibonacci levels, basen on the last closed bar of the specified time frame. My #1 Utility : includes 65+ functions | Contact me if you have any questions helps to see potential reversal levels; patterns formed near the levels have more potential; significantly saves time spent on manual level plotting; Adjustable parameters:
The time frame used to plot the levels; Personalization of Fibonacci levels: main correction levels + extension levels; Line color, line width an

The falcon indicator works based on the innovative falcon strategy before me, as I used special numbers for the Moving Release indicator and the Bollinger Band, in addition to many indicators for filtering the signal, some numbers from the Nine Square and the Fibonacci numbers, where the results were impressive. We also have a free version for a month in the video description on Youtube download link Thanks

We know for sure that The Fibonacci sequence is a science used to calculate or estimate target distances.
How does this indicator work? 1. Tell the spread status 2. Tell me the current price 3. Indicate whether the candlestick status is bullish or bearish on each time frame. 4. Indicates the status of the past 2 candles 5. Tell Pivot Point 6. Tell the Fibonacci sequence. 7.The Fibonacci measurement can be set. 8. Pivot can be set backward. 9. Look at support and resistance.
Suitable for 1.

Chỉ báo tự động rút ra mức thoái lui fibonacci của tháng và năm. Draw from the same or under the same same or on the same of the tree before that. https://www.mql5.com/en/charts/12730171/audusd-pro-d1-axicorp-financial-services Màu đỏ là tháng fibonacci Màu vàng là tuần fibonacci White color is fibonacci date Red color is fibonacci month Yellow color is fibonacci tuần White color is fibonacci date Red color is fibonacci month Yellow color is fibonacci tuần White color is fibonacci date

Breakout Sniper draw trendlines by using improved fractals and plots the breakout and reversal points.
NO REPAINT AUTOMATED TRENDLINES MULTI TIMEFRAME
*** SINCE THE STRATEGY TESTER OF MT4 PALTFORM DOES NOR SUPPORT, YOU NEED TO TEST "CURRENT TIMEFRAME" INPUTS ONLY.*** A trendline is a line drawn over pivot highs or under pivot lows to show the prevailing direction of price . Trend lines are a visual representation of support and resistance in any time frame. They show direction and sp

Fibonacci Channel
What is a Fibonacci Channel? The Fibonacci channel is a technical analysis tool that is used to estimate support and resistance levels based on the Fibonacci numbers. It is a variation of the Fibonacci retracement tool, except with the channel the lines run diagonally rather than horizontally. It can be applied to both short-term and long-term trends, as well as to uptrend and downtrends. Lines are drawn at 23.6, 38.2, 50, 61.8, 78.6, 100, 161.8, 200, 261.8, 361.8 and 423.6

The IndicatorPivot indicator is suitable for using forex trading strategies designed for intraday trading. "IndicatorPivot" displays on the price chart of a currency pair the Pivot level (average price for the current day) and the three closest support and resistance levels, calculated based on Fibonacci levels. The "Indicator Pivot" indicator uses Fibonacci levels to solve the problem of building support and resistance levels in Forex trading. This indicator is very easy to understand and to ap

The reason why many traders new to using the Fibonacci retracement tool find it hard to effectively use it is because they are having trouble identifying swing points that are significant enough to be considered.
Main Features Show Fibonacci number with LL to HH in multitimeframe
Show 23.6,38.2,50,61.8,78.6,88.6,100,112.8,127.2,141.4,161.8,200,224,261.8,314,361.8 and 423 of Fibonacci number
Easy to use with simple interface. Real time information for the Fibonacci number .
Settings Global

This indicator watch the Fibonacci retracement for levels and timeframes selected by the trader. In the workload of day trading, having your eyes on all the timeframes to validate some information, for Fibonacci traders, is really time consuming and requires constant focus. With this in mind, this tool allows you to have your attention on other trading details while this one monitors the retracements of each timeframe in real time. In the charts, this indicator data (retracement %, age of the r
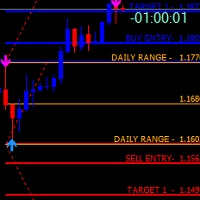
FiboZZ Trade Panel is trade assistants designed for manual trading and include account information panel with automatic drawing of ZigZag Extreme Arrows , Daily Fibonacci Extension with 3 levels for targets. You can use it with the following tow strategies or to use the indicators to create your own strategies. The information panel shows you: -Today and Yesterday Profits, -Balance, -Last Profit, -Last Open Lot Size, -All Open Buy/Sell Position and total lots , -Free Margin Level, -Equity, -24 h
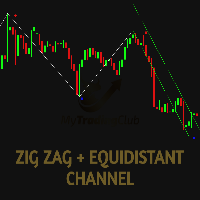
The MTC Equidistant Channel indicator is a helping tool for the traders who use: The supports and resistances lines; The trends; Fibonacci levels; It's a combination between the ZigZag indicator and the Equidistant chanel, It helps to detect the break-outs in many strategies and shows the possible entry points. The indicator capabilities : Drawing the Equidistant chanel automatically on the ZigZag indicator. The possibility of changing the ZigZag indicator settings. The indicator works on all ti
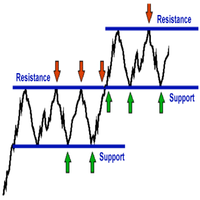
Are you tired of drawing Support & Resistance levels for all charts of the same Symbol while doing Multi-Timeframe analysis? Well, if you are a Price Action trader then this indicator will solve your problem. Draw on 1 Timeframe and it will auto-sync with other charts of the same Symbol. You can draw rectangles, lines, and eclipse. It will give an alert when touched/break on line. It work's on all Timeframes.
Major Update Added:: 1}triangle 2}Fibonacci Retracement 3}Text Lable 4}Up/Down Arrow

The indicator builds a graphical analysis based on the Fibonacci theory.
Fibo Fan is used for the analysis of the impulses and corrections of the movement.
Reversal lines (2 lines at the base of the Fibonacci fan) are used to analyze the direction of movements.
The indicator displays the of 4 the target line in each direction.
The indicator takes into account market volatility.
If the price is above the reversal lines, it makes sense to consider buying, if lower, then selling.
You can op

Fibonacci calculator is used with Elliot Waves, it can generate remarkable results. A trader could use these levels or ratios to find high probability trades with very small stop loss. You may also use these ratios to find Elliott Waves extensions and to book profit near those levels. For Elliot Wave experts, Fibonacci calculator is a highly useful tool that can assist them in calculating Fibonacci extension and retracement levels for the market price. The indicator proves itself as a useful one
This indicator automatically plots Yearly High , Yearly Low and Yearly Average price levels from the previous year. It also builds two additional equidistant parallel levels ( Extended Highs R2 , R3 / Extended Lows S2 , R3 ) extended from previous Year High / Low. Extended High R3 / Low S3 is 100 percent Low-to-High extension ( as in Fibonacci 100 % extensions ) above / below the previous Year H/L and is the final reversal level with a sure reaction. Extended High/Low R3/S3 represent the ulti
Fibonacci Level start form price Open as zero number. then do Fibonacci line offset on above and to below, base last Day High Low Fibonacci Percentage.
With ADR Label for measure maximum and minimum pips running limit. Using ADR 5 days, ADR 10 Days, ADR 20 Days and ADR 50 Days.
On current running price, there plot two line boundaries, are current High line and current Low line, with percentage running pips.
Please see attachment pictures for more information.
Regards
Leave a review for this product, and receive another "Free" product that you choose. You can see my other products here: https://www.mql5.com/en/users/zakri/seller
Harmonic Patterns Detector indicator draws harmonic patterns on chart. Harmonic patterns have a high hit-rate of around 80% and are excellent for trade entries. They are used as price reversal points. Some of them have a long history of usage and were created by famous traders like H. M. Gartley. Many harmonic patterns are included

Fibonacci retracements can be used to draw support lines, identify resistance levels, place stop-loss orders and set target prices. The Advanced Automatic Fibonacci retracements draws automatically all the levels. You have a lot of options to choose. For exemple you can use the tracements of another time frame (MTF) in the current chart, you can also choose between the closest level or less close to draw the retracements. You can also add 2 levels of your choice. You can add levels extensions o
The LordAdvancedPivot Indicator is an indicator for META TRADER 4, with the function of analyzing the main daily channels of the currency pair, known as RESISTANCE, SUPPORT and PIVOT (center), to determine the levels at which market sentiment can change from "bullish" "to" low ".
Pivot points can be points that correspond to trend lines, Fibonacci levels, moving averages, previous highs / lows or closings and many more indicators, depending on the trader's philosophy.
LordAdvancedPivot has

We Trade Live Trend Max Our team of engineers have programmed a great tool which we have used to success and will aid you in making better decisions when placing a trade, we believe it is better than anything available on the market at the moment! try & Test Against other products and see for yourself how amazing this is. Our Main Objective is to help you as traders discover how you can take a simple trading setup and make consistent profits. We provide the fundamentals needed to trade the marke

This indicator identifies the major and minor swing high and low points on a chart. It then takes the most recent swing and draws a fibonacci pattern of retracement and extension levels to give you an idea of where price may move next. It allow allows you to set a pair of moving averages to help identify the direction of the overall trend. There are configuration parameters for the major and minor swing and the moving averages.
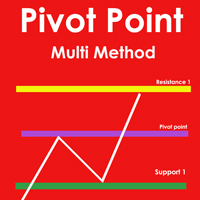
Pivot Point Multi Method is a fully automatic pivot point indicator and indicate support and resistances (S1,S2,S3,S4,R1,R2,R3,R4) based on four Methods that you can select on of them Pivot point detection and drawing support resistances Methods( Classic ,Camarilla ,Woodie ,Fibonacci)
Pivot Point Multi Method is working on all time frames and all currency pairs and gold silver and crypto currencies .
Recommended Setting : Pivot_Method select one of the methods ( Classic ,Camarilla ,Woodi

Fibonacci Magic Pivot Levels The Fibonacci Magic Pivot Levels is a powerful yet easy to use indicator . It continuously monitor s intra-day price action and uses complex algorithms to calculate and detect key support, resistance and pivot levels, using the D1 timeframe as a filter. The Fibonacci Magic Pivot Levels is optimized for H4, H1, M30, M15, M5 & M1 timeframes and can be used on ALL Currencies, Indices, Commodities, and Cryptocurrency pairs . Trade with improved confidence an
This indicator calculates support and resistance prices in multi-timeframe with different formulation and draw them on the chart that style do you choose. And If you want, Indicator can alert you when the current price arrive these pivot levels. Formulations: Classic, Camarilla, Woodie, Demark, Floor, Fibonacci
Alert Options: Send Mobil Message, Send E-mail, Show Message, Sound Alert
Levels: PP, S1, S2, S3, S4, S5, R1, R2, R3, R4, R5, TC, BC and Middle Points Why do you need this indicator:
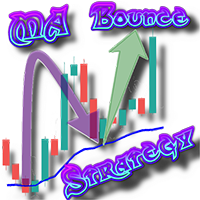
The MA Bounce Strategy is a strategy that seeks to long FX pairs on a strong uptrend as they bounce off their MA support and shorting FX pairs on a strong downtrend as they bounce off MA resistance. The best suitable periods of moving averages for that strategy are 18, 30, 50. This indicator helps to identify and find place for potential market entry by MA bounce strategy. Read More information about MA Bounce Strategy . By default MA Bounce Strategy indicator is configured for trading of M1

DESCRIPTION: The theory of the indicator is that currencies that are traded in the European session sleep at night. And when they wake up, they go to the golden mean of Fibonacci, their own way. At night, a channel is formed from which they want to get out, in the morning with renewed vigor on the road. The upper level of the channel is the buy zone.
The lower level of the channel is the sell zone. The objectives of the hike are marked with colors at the top and bottom.
The indicator output

Many forex traders spend their time looking for that perfect moment to enter the markets or a telltale sign that screams "buy" or "sell". And while the search can be fascinating, the result is always the same. The truth is… there is no guaranteed way to trade the forex markets. As a result, traders must learn that there are a variety of indicators that can help to determine the best time to buy or sell a forex cross rate. Our indicator definitely does this! This strategy is created by traders fo

Fibonacci Retracements Pro The Fibonacci Retracements Pro is a powerful yet easy to use indicator. It automatically plots all the important Fibonacci retracement and extension levels for you. FRP is dynamic powerful and seamlessly adjusts to whatever timeframe you are analyzing. Fibonacci Retracement Pro is optimized for ALL timeframes and ALL Currency pairs, Indices, Commodities, and Cryptocurrency pairs. Trade with improved confidence and maximize your success rate. Benefits Dynamic and Power

VR Pivot 这是顶点(pivot)的关键反转点指示器。 Pivot 点一这是一种特殊类型的支撑 (support) 和阻力 (resistance) 水平,用于确定最强的价格区域。专业交易者使用级别 pivot 来确定价格有较大概率反转的价格。水平是根据特殊的数学公式计算的,计算是前一个时间段的收盘价、开盘价、最高价和最低价。最有效的是白天。重要的是要注意,乍一看,这些水平似乎没有什么特别之处,但如果你用水平 pivot 分析价格走势,你可以清楚地看到,在大多数情况下,这些水平显示良好,准确的结果。 技术支持,设置,演示版本的程序可以要求在作者的配置 文件。. 级别 pivot 不仅可以用作反转点,还可以用作可以充分利用止盈以最大化利润的水平,止损以最大限度地减少损失,将仓位转移到无损区域以降低风险。 指标优势 VR Pivot: 该指标支持计算多个公式: Classic Pivot - 经典枢轴公式 DeMark Pivot - 德马克公式 Woodie Pivot - 伍迪公式 Camarilla Pivot - 卡马里利亚公式 Fibonacci Pivot - 斐波那契公

This FiboMagic Pro indicator determines the direction of the trend and shows potential entry points at the end of the correction.
The main essence of the indicator is that it takes the entire history of a trading instrument and draws trend lines based on it, determines the direction of the trend, and draws Fibonacci levels in its direction.
FiboMagic Pro shows you:
1) Which way to trade 2) Clear criteria for the entry point for breaking the countertrend line in the Fibonacci structure 3

The Alligator indicator uses three smoothed moving averages, set at five, eight, and 13 periods, which are all Fibonacci numbers. The initial smoothed average is calculated with a simple moving average (SMA), adding additional smoothed averages that slow down indicator turns. Scan all your favorite pairs with Alligator, and get notified on your preferred time frames.
Setting is Customizable
Click to change time frame or open new pairs
Notification: Phone/Popup/Email

Binary & Forex (+ 90% Ratio-Win Next Candle)
Wait for the price to reach a good (strong) zone be it support, resistance, supply or demand zone, fibonacci level key, round figure. By doing the above there will definitely be a reversal in price and you will get your ITM on the first candle giving 100% effectiveness following the trend. It is very important to be attentive to the fundamental news in the market and these do not affect your trading. Commercial sessions: any (24 hours). Currency

Flag Pattern pro is a Price Action (PA) analytical tool that scans the continuation patterns known as "Flag and Pennant Patterns" .
Flag and Pennant patterns are continuation patterns characterized by a move in a previous trend direction after a shallow retracement usually below 50% of the original move . Deep retracements can however be sometimes found at the 61.8 % levels. The original move is know as the flag pole and the retracement is called the flag.
Indicator Fun

ToolBox 360 is the swiss knife of all indicators. It is full packed with useful tools to help you with your trading. It can be used to find best entry and exit points and help you to decide if you should open a trade or not. It shows market trends, candlestick formations outside / inside bars and you can sett time based allerts.
Main features:
Time based Fibonacci lines Choose a start and end time and the indicator shows you Fibonacci lines within the selected time range including range high

Fully featured Pivots and Levels indicator Pivots: Floor (normal), Woody, Camarilla, Fibonacci Levels: ATR, Historical Volatility with standard deviations, Close Price Volatility with standard deviations
Features: 4 +/- levels MTF, pivots/levels based on Daily, Weekly, 4hr or even 15min Hour and minute time offset
Texts with prices and pip distances to central pivot/level Inputs for Camarilla/Fibonacci/ATR/Volatility levels
Alerts, popup, push, email, sound, live or completed candles on leve
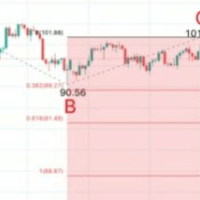
A Chart Analytics Program and helps in asset analysis using the Fibonacci Complex.
The primary Fibonacci numbers used in trading are 61.8% and 38.2%. 8% is derived from dividing any number in the Fibonacci sequence by its previous one. F n / F n-1 2% is derived by squaring 61.8 and alternatively by dividing any number in the sequence by the number two places to its right. F n /F n+2 The second tier of Fibonacci numbers used in trading is 23.6%, 76.4%, and 78.6%. 6% is derived from dividing a

斐波那契回撤是交易者可以用來繪製支撐線、確定阻力位、下止損單和設定目標價格的流行工具。 斐波納契回撤是通過在股票圖表上取兩個極值點並將垂直距離除以關鍵斐波納契比率 23.6%、38.2%、50%、61.8% 和 100% 來創建的。 斐波那契工具指標將繪製斐波納契工具,例如 回撤、弧線、扇形、擴張、時區。 基於鋸齒形指標"
斐波那契回撤是交易者可以用來繪製支撐線、確定阻力位、下止損單和設定目標價格的流行工具。 斐波納契回撤是通過在股票圖表上取兩個極值點並將垂直距離除以關鍵斐波納契比率 23.6%、38.2%、50%、61.8% 和 100% 來創建的。 斐波那契工具指標將繪製斐波納契工具,例如 回撤、弧線、扇形、擴張、時區。 基於鋸齒形指標"

BEHOLD!!!
One of the best Breakout Indicator of all time is here. Multi Breakout Pattern looks at the preceding candles and timeframes to help you recognize the breakouts in real time.
The In-built function of supply and demand can help you evaluate your take profits and Stop losses
SEE THE SCREENSHOTS TO WITNESS SOME OF THE BEST BREAKOUTS
INPUTS
MaxBarsback: The max bars to look back
Slow length 1: Period lookback
Slow length 2: Period lookback
Slow length 3: Period lo

This is a multi-timeframe multi-currency Fibo (Fibonacci levels) and Pivots scanner which also shows Missed Pivot count and Fibo Golden Ratio Zones. Select separate Pivot Timeframes for each Dashboard Timeframe Check when price is near a Pivot point Check for Price Crossing Pivot Point Use Mid Pivots (Optional) Show Missed Pivots (Optional) Show High Volume Bar Use Fibo (Optional) Use Fibo Golden Ratio (Optional) Set your preferred Timeframe for Fibo or Pivots
Check out Common Scanner Settin

JULY OFFER 80% OFF next price for unlimited version will be 17000$. This is the only time you can get this institutional and professional indicator at this price for unlimited version. Don't dare to miss this. The tool I am about to introduce to you you can't compare it with other tools due to its strategy and accuracy level in predicting the next price directional movement . This tool is designed for serious traders who have decided to make a difference through trading. Be the next person to wi

Cloud Eyes is an advanced moving average alert that will easily monitor the price action based on set moving averages to multiple open charts. Objective: To monitor multiple open charts and notify traders conveniently in a single display panel when using the moving averages to enter/exit a trades. Features: Monitor price action in two timeframes at the same time Supports simple, exponential, smoothed, linear weighted moving averages Trigger an alert based on candle size (full/body length)
Ca
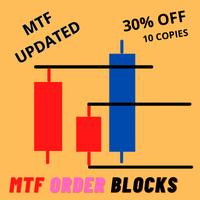
30% discounted ONLY 10 COPIES HURRY UP! 5 LEFT COPIES All Features now have in current version. Very precise patterns to detect High Accurate Order Blocks: It Draw zone after market Structure Breakout with a high Accuracy, institutional orders with the potential to change the price’s direction and keep moving towards it, have been placed. Features Auto Order Blocks Draw Market Structure BOS LINE Auto Imbalance Detect Auto Trend Detect MTF Order Blocks Double Signal One Alert Signal Second Lo
The indicator may be of interest to traders who use Fibonacci and Gann levels in their trading. The construction of levels is set by the range of the previous day. It is possible to set colors and styles of all lines in the indicator. It is possible to switch the view mode using buttons on the chart. The indicator practically does not load the terminal as it is recalculated either on a new bar or when switching buttons.

This Scanner will help you to get Pivot points , Resistance and Support Points on the Symbols in your watchlist, using this and the best part is it give alert in all format whether its a e-mail, or Phone Notification alert, or Pop-up Alerts. There are multiple points as : 1) Standard Pivot Points 2) Fibonacci Pivot points 3) Camarilla Pivot points 4) Woddie Pivot points. 5) Bollinger Bands.
Type of Alerts are : 1) Cross Alert. 2) Near_Alert. 3) Cross and Bounce Alert. 4) Bounce only Alert.
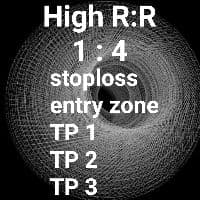
斐波那契突破是一种使用斐波那契回撤的交易策略。这种技术实际上是一种让我们进入趋势开始的技术。即使是初学者也很容易理解。 策略是您只需要等待自动自定义斐波那契出现,然后手动下达您的挂单,在斐波那契水平止损和获利。当价格成功重新测试时,该头寸将被打开。斐波那契突破适用于外汇、加密货币和股票。 斐波那契突破水平详细信息: 1- 监控交易 = 0(可以是止损水平) 2- 进入区域 = 0.50 – 1.00(当价格在区域内时进入) 3- 获利区 目标 1 = 1.618 目标价 2 = 2.618 目标价 3 = 4.236
标准操作程序 (SOP) • SOP 非常简单易懂。系统将识别存在: 1. 初始中断 (IB) 或显性中断 (DB) 2. Candle Break 1 (CB1) - 标有蓝色或红色的 X 符号(实际上是之前 ABC 模式的 B 点) 3. 重新测试(斐波那契水平 0.50 – 1.00) • 当三个条件都满足时,SOP 就完成了。斐波那契将出现在图表上,给出入场区域 (EZ)、止盈 (TP) 水平和止损水平 (SL)。 • 如果遵循 SOP 和资金管

Possible Price reversals levels - based on Fibonacci + Support + Resistance Levels Auto levels drawn based on input index (Bars Count ) ---->>> Price Over 50% Fibo line ---> UP TREND ---> BUY when price drop near Support Lines ---->>> Price Down 50% Fibo line ---> DOWN TREND ---> SELL when price goes up near Resistance Lines
--->>> The more close price levels ----> the more possibility for price reversals --->>> are you a scalper --> try it on M1 charts with big index like 5000 bars or

** All Symbols x All Time frames scan just by pressing scanner button ** *** Contact me after purchase to send you instructions and add you in "Divergence group" for sharing or seeing experiences with other users. Introduction MACD divergence is a main technique used to determine trend reversing when it’s time to sell or buy because prices are likely to drop or pick in the charts. The MACD Divergence indicator can help you locate the top and bottom of the market. This indicator finds Regular div
Introduction to Support Resistance Risk Management Support Resistance is the most trusted technical analysis. However, the risk management for the support and resistance is not practiced often. Hence we provide one effective risk managment method for the support and resistance trader. In the book: Scientific Guide To Price Action and Pattern Trading (Wisdom of Trend, Cycle, and Fractal Wave), how to use Support Resistance is described as well as Fibonacci Analysis, Harmonic Pattern, Elliott Wave

Wave Anatomy Visit: http://www.tradethevolumewaves.com for more information
Construct your own 5 Waves and analyze the price movements stages:
Easy Movement Hard time to move Fast move This indicator is based on Wyckoff’s, David’s Weis and my Speed Index Theory. This indicator will you help analyze what is happening in 5 Price Waves that you can construct yourself. This tool is designed for scalpers and swing traders and will help them to analyze any wave on any timeframe at the same tim

Basic tool
Showing annual candle, range for Day, range for Week, range for Month, range for Year. Showing fibonacci for Day fibonacci for Week, fibonacci for Month, fibonacci for Year. Showing percent change for Day, percent change for Week, percent change for Month, percent change for Year. Showing distance of the current value the previous close for Day, Week, Month, Year.

Daily Pivots Multi Indicator Daily Pivots Multi is an exclusive indicator to draw your pivots levels and much more.
Most indicators draw daily pivots for the day. Daily Pivots Multi is able to draw levels for different days.
The indicator can do the calculation for unlimited number of days backward. It means that you can draw the levels for today but also for the past days.
This is very useful if you want to study a strategy with Pivots levels over a period of time.
Another problem is th

This tool eliminates the need for anything. With the help of this tool, you can save hours of your time. By installing this tool, you have a complete and comprehensive view of the market. Just enable the tool so that the artificial intelligence designed inside the tool starts scanning the market and measuring the market power and volume of buyers and sellers. Powerful trend detection This tool allows you to analyze all market time periods in the shortest time without any care. This tool automat

What are Fibonacci Numbers and Lines? Fibonacci numbers are used to create technical indicators using a mathematical sequence developed by the Italian mathematician, commonly referred to as "Fibonacci," in the 13th century. The sequence of numbers, starting with zero and one, is created by adding the previous two numbers. For example, the early part of the sequence is 0, 1, 1, 2, 3, 5, 8, 13, 21, 34, 55, 89,144, 233, 377, and so on.
The Fibonacci sequence is significant because of the so-call

This indicator detects trade direction and sends notification to your mobile phone so that you can enter/exit a trade without having to be seated in front of desktop computer all day and night. Although you have to execute/send an order yourself, you can setup rules through the setting made available for proper lots size base on the available balance/fund you are trading with. The opportunity to take a profit at the right time and set reasonable stop loss that will not be overwhelming and gett
Become a constantly profitable 5-star forex trader!
We offer a few indicators to support you understand and analyse the market! With our strategies you will improve your trading system and bacome an expert...
We have indicators for trend direction, market direction and others.. for multi-time frames and that covers all majors or your favorite trading symbols! Some of them offer a customizable calculation parameters... or Graph features!
See how powerful they are! The are also easy-to-use

Non-repaint indicator to identify trade opportunities in swing action as prices move within an upper and lower band. Inspired by the Keltner Channel, the most popular channel Indicator introduced by Chester Keltner. It is different with a Bollinger Bands. It represents volatility using the high and low prices, while Bollinger's studies rely on the standard deviation. Customized by adding the trends exactly in the middle line, arrows when price cross over the outer lines and Fibonacci Levels L

Improve trading with this indicator. Find areas of buys or sells in Fibonacci retracement areas. Fulltrend is for scalping and making swing trades. Fib levels are added for take profits and stop losses. This works on any time frame and can be used by itself or together with other systems and indicators for filters. The indicator doesn't repaint. Alerts are added and can be true or false. No need to sit glued to the computer, just set on charts and listen or the alerts to come. Take a pos

Fibonacci retracements are trend lines drawn between two significant points, usually between absolute lows and absolute highs, plotted on a chart. Intersecting horizontal lines are placed at the Fibonacci levels. Fibonacci retracements are useful tools that help traders identify support and resistance levels. With the information gathered, they can place orders, identify stop-loss levels, and set price targets. Although useful, traders often use other indicators to make more accurate assessments

50% off. Original price: $60 (Ends in May 15th) Support and Resistance zones indicator for MT4 is a multi-timeframe panel and alert that finds support and resistance zones and pivot points for all timeframes of MetaTrader 4 and gives alert when price has interaction with them. Download demo version (works on GBPUSD, EURJPY and NZDUSD symbols) Read the full description of scanner parameters in the blog page . Many unique features in one indicator:
Integrating support and resistance zones and p
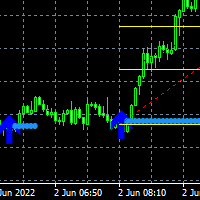
Here is the Double Arrow ArrZZx2 indicator that works best on 5 minutes time frame with Alerts. Good for pairs like NAS100, US30, GER30 and XAUUSD Your buy entry or Sell entry is on the second arrow of the Arr zzz You can confirm your second arrow with Fibonacci retracement levels the 50% level and the 61.8% which is the golden zone The double is good on strong trending markets look for the breakout on the second arrow Look at the screenshots for examples.
您知道为什么MetaTrader市场是出售交易策略和技术指标的最佳场所吗?不需要广告或软件保护,没有支付的麻烦。一切都在MetaTrader市场提供。
您错过了交易机会:
- 免费交易应用程序
- 8,000+信号可供复制
- 探索金融市场的经济新闻
注册
登录