sathish kumar / Profil
HAI, I AM TRADER. I HOPE YOU ALL DOING WELL.
I USE FIBONACCI RETRACEMENT, SUPPORT AND RESISTANCE
Arkadaşlar
544
İstekler
Giden
sathish kumar
Economic events for 05.01.2016 gönderisini yayınladı
05.01.2016 00:00Bank holiday Currency: RUB, Importance: Not significant...
sathish kumar
Economic events for 04.01.2016 gönderisini yayınladı
04.01.2016 00:00Day after New Year's Day Currency: NZD, Importance: Not significant...
sathish kumar
Economic events for 28.12.2015 gönderisini yayınladı
28.12.2015 00:00Boxing Day Currency: EUR, Importance: Not significant...
sathish kumar
Economic events for 27.12.2015 gönderisini yayınladı
27.12.2015 23:50Industrial Production (MoM) (November) Currency: JPY, Importance: Medium...
sathish kumar
Economic events for 24.12.2015 gönderisini yayınladı
24.12.2015 00:00Christmas Eve Currency: EUR, Importance: Not significant...
Sosyal ağlarda paylaş · 1
200
sathish kumar
Economic events for 23.12.2015 gönderisini yayınladı
23.12.2015 00:00The Emperor's Birthday Currency: JPY, Importance: Not significant...
sathish kumar
sathish kumar
Konuya yorum yap achievements bonus gone?
i have 400 rating point, i do not get bonus. i contact support, i got replay as Bonus is not charged anymore. does any other member get bonus yesterday
sathish kumar
Economic events for 22.12.2015 gönderisini yayınladı
22.12.2015 00:05Gfk Consumer Confidence (December) Currency: GBP, Importance: Medium...
sathish kumar
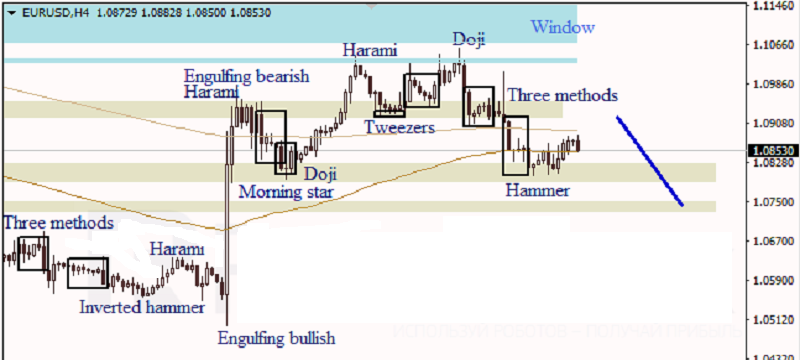
EUR USD, “Euro vs. US Dollar” At the H4 chart of EUR USD, Three Methods continuation pattern indicates a descending movement. Three Line Break chart confirms a bearish direction; Hammer pattern and Heiken Ashi candlesticks show that the sideways correction may yet continue...
Sosyal ağlarda paylaş · 1
221
sathish kumar
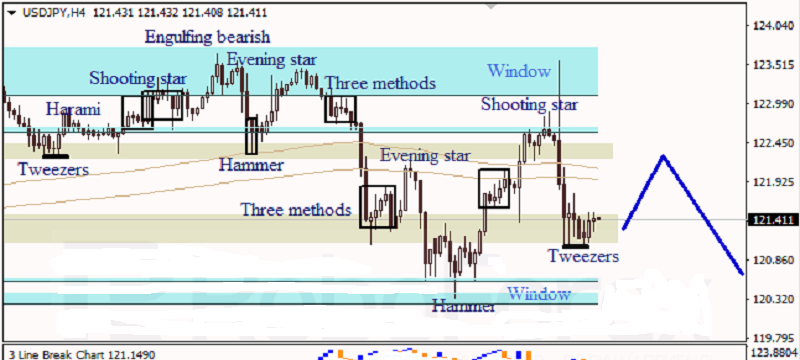
USD JPY, “US Dollar vs. Japanese Yen” The H4 chart of USD JPY shows a sideways correction. The upside/downside Windows provide support/resistance respectively. Three Line Break chart indicates a bearish direction; Tweezers pattern and Heiken Ashi candlesticks confirm an ascending movement...
Sosyal ağlarda paylaş · 1
183
sathish kumar
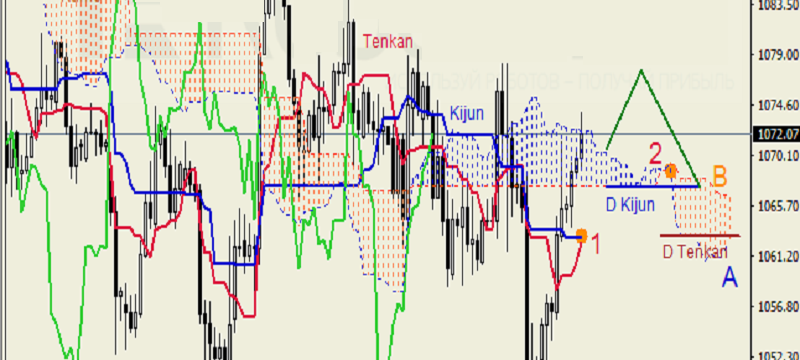
XAU USD, “Gold vs US Dollar” XAU USD, Time Frame H4. Indicator signals: Tenkan-Sen and Kijun-Sen ran into one another below Kumo Cloud (1); Tenkan-Sen is directed upwards. Chinkou Lagging Span is on the chart, Ichimoku Cloud is moving downwards (2), and the price is near the cloud’s upper border...
sathish kumar
Important weekly economic events for 21.12.2015 - 28.12.2015 gönderisini yayınladı
22.12.2015 13:00Gross Domestic Product Price Index (July) Currency: USD, Importance: High...
sathish kumar
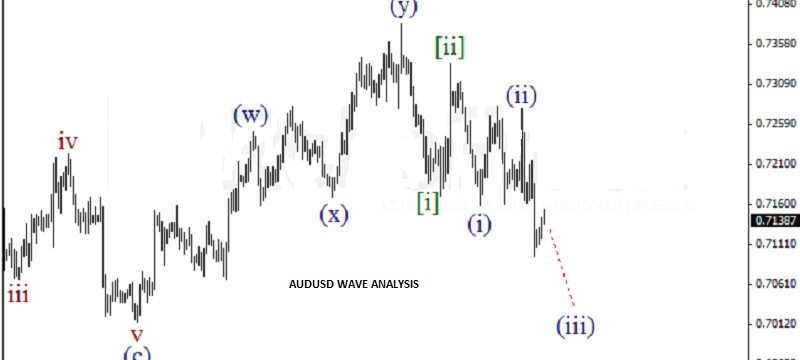
AUD USD, “Australian Dollar vs US Dollar” The price is forming the extension in the wave [iii]. On the minor wave level, the price may continue falling in the wave (iii...
: