Maxim Kuznetsov / Profil
- Bilgiler
|
11+ yıl
deneyim
|
33
ürünler
|
67
demo sürümleri
|
|
19
işler
|
0
sinyaller
|
0
aboneler
|
My big personal project : http://nektomk.ru/en:atcl:start
Integration MT4 with world via Tcl :-) Excel, Mail, Networking, Rest-API, Websockets and many many others are accessable from MetaTrader.
The second time gave the oath of allegiance to "freelance service", and now there you can ask a personal order for me :-)
If you want to order the development of software, then see contacts in the profile or on the site http://nektomk.ru/en:service:start
Arkadaşlar
703
İstekler
Giden
Maxim Kuznetsov


у кого есть архив или кто знает зеркало docs.bitfinex.com/docs ?
тут накрылась знатное число CDN и многие тех.сайты взглючились на 1/6 части.
День-два-три оно конечно заработает, но надо сейчас и сразу.
И очень не хочется ходить через левые прокси-впн или нагружать торговый VDS
тут накрылась знатное число CDN и многие тех.сайты взглючились на 1/6 части.
День-два-три оно конечно заработает, но надо сейчас и сразу.
И очень не хочется ходить через левые прокси-впн или нагружать торговый VDS
Maxim Kuznetsov


Простые движенья трейдера-интрадейщика. Достаточно просто, красиво и динамично. И конечно музыка...
Sosyal ağlarda paylaş · 1
75
2
Maxim Kuznetsov


есть такое ощущение, что тестер стал работать мучительно долго.
Для чистоты опыта достал старый советник, который точно помню что оптился быстро.
Так у него теперь даже еденичный прогон чуть ли не час ;-(
Для чистоты опыта достал старый советник, который точно помню что оптился быстро.
Так у него теперь даже еденичный прогон чуть ли не час ;-(
Maxim Kuznetsov


Что-то у товарищей возникли некоторые проблемы с блогами. Если слово "консоль" вас не страшит, то вот пример решения подобных проблем. Эта заметка написана используя HUGO для управления и генерации блога и AsciidocFX для непосредственного редактирования контента...
Sosyal ağlarda paylaş · 1
57
Maxim Kuznetsov
Панелька, рабочая gönderisini yayınladı
По личным делам несколько припозднил (о чём предупреждал), но вот панелька можно сказать что готова, можете брать...
Maxim Kuznetsov
Переход к "исполнятору" gönderisini yayınladı
По личным причинам день-полтора панельку с моделькой не трогал, сегодня руки дошли и добавил планирование сделок. Остаётся "исполнятор" и отполировать+опубликовать...
Maxim Kuznetsov
Панелька уже с моделькой gönderisini yayınladı
3-я часть про изготовление торговой панельки...
Maxim Kuznetsov
Набросок модельки gönderisini yayınladı
Вслед за релизом ATcl и эскизом панельки, делаем набросок модельки...
Maxim Kuznetsov
Эскиз панельки gönderisini yayınladı
В честь релиза ATcl, по шагам, делаем торговую панельку. Начнём с вариантов использования и чернового эскиза GUI...
Maxim Kuznetsov
Предложение в честь очередного релиза ATcl:
предлагаю сделать торговую панель (тот самый GUI открытия/модификации ордеров и позиций). С вас эскиз и краткое описание текстом, с меня итоговый код с пояснениями и комментариями.
Время есть, потому БЕСПЛАТНО и полностью открыто.
предлагаю сделать торговую панель (тот самый GUI открытия/модификации ордеров и позиций). С вас эскиз и краткое описание текстом, с меня итоговый код с пояснениями и комментариями.
Время есть, потому БЕСПЛАТНО и полностью открыто.
Maxim Kuznetsov
ATcl 1.0.9d gönderisini yayınladı
Релиз библиотеки ATcl (tcl/tk для MT5). В догонку за изменениями в платформе MetaTrader...
Sosyal ağlarda paylaş · 1
46
2
Maxim Kuznetsov


Как промежуточный результат получилась "мечта любителей оптимизаций оптимизатором" :-) Почти универсальный индикатор с разумно варьируемыми опциями. Не поделиться грех...
Maxim Kuznetsov
вместо Кодобейз: поиск ближайшей дроби gönderisini yayınladı
из принципа "увидел прикольный алгоритм, не проходи мимо...
Maxim Kuznetsov
немного поотвлекался от текстов, крутил-вертел SciLab (некоторый аналог MatLab)..
в принципе его довольно удобно вызывать из MT и это даже сильно быстрее тормозного Питона.
Традиционная проблема для таких числогрызов (Julia и Octave в том числе) - инстанс один на весь процесс,
до уровня отдельных тредов и дескрипторов он не изолируется.
в принципе его довольно удобно вызывать из MT и это даже сильно быстрее тормозного Питона.
Традиционная проблема для таких числогрызов (Julia и Octave в том числе) - инстанс один на весь процесс,
до уровня отдельных тредов и дескрипторов он не изолируется.
Maxim Kuznetsov

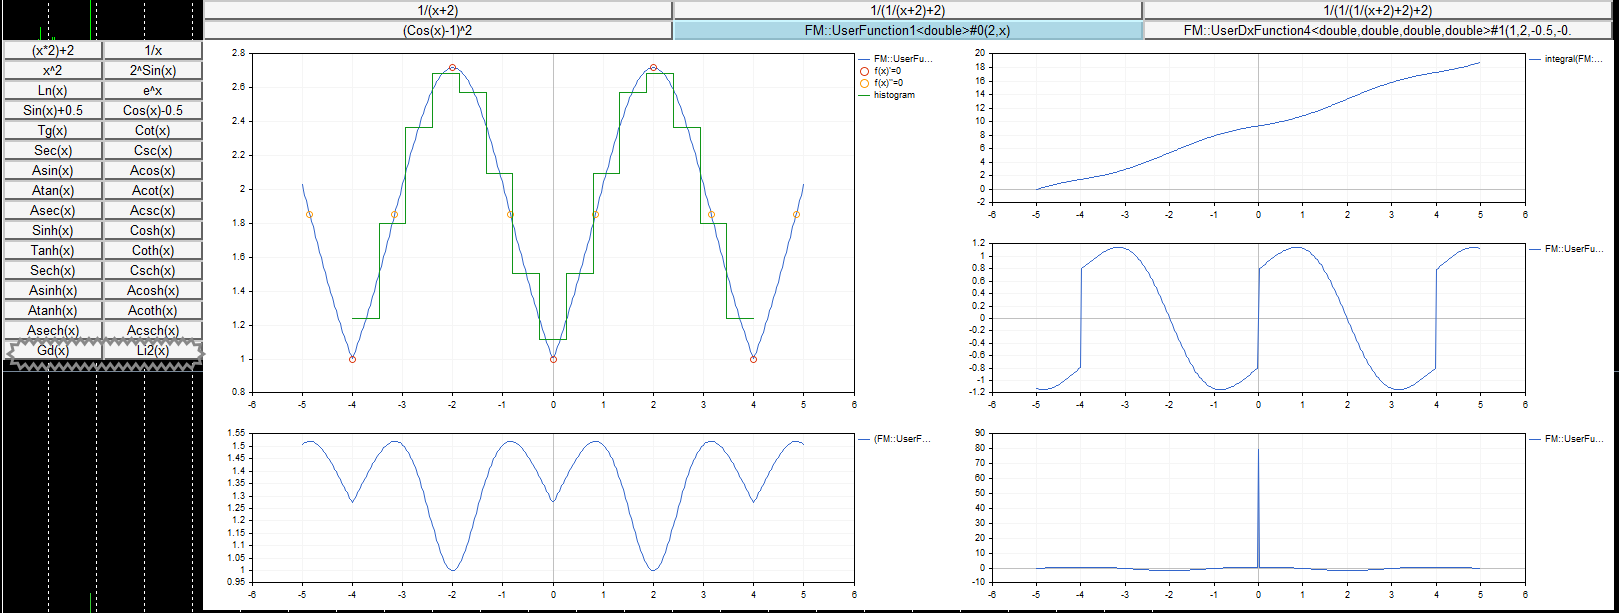
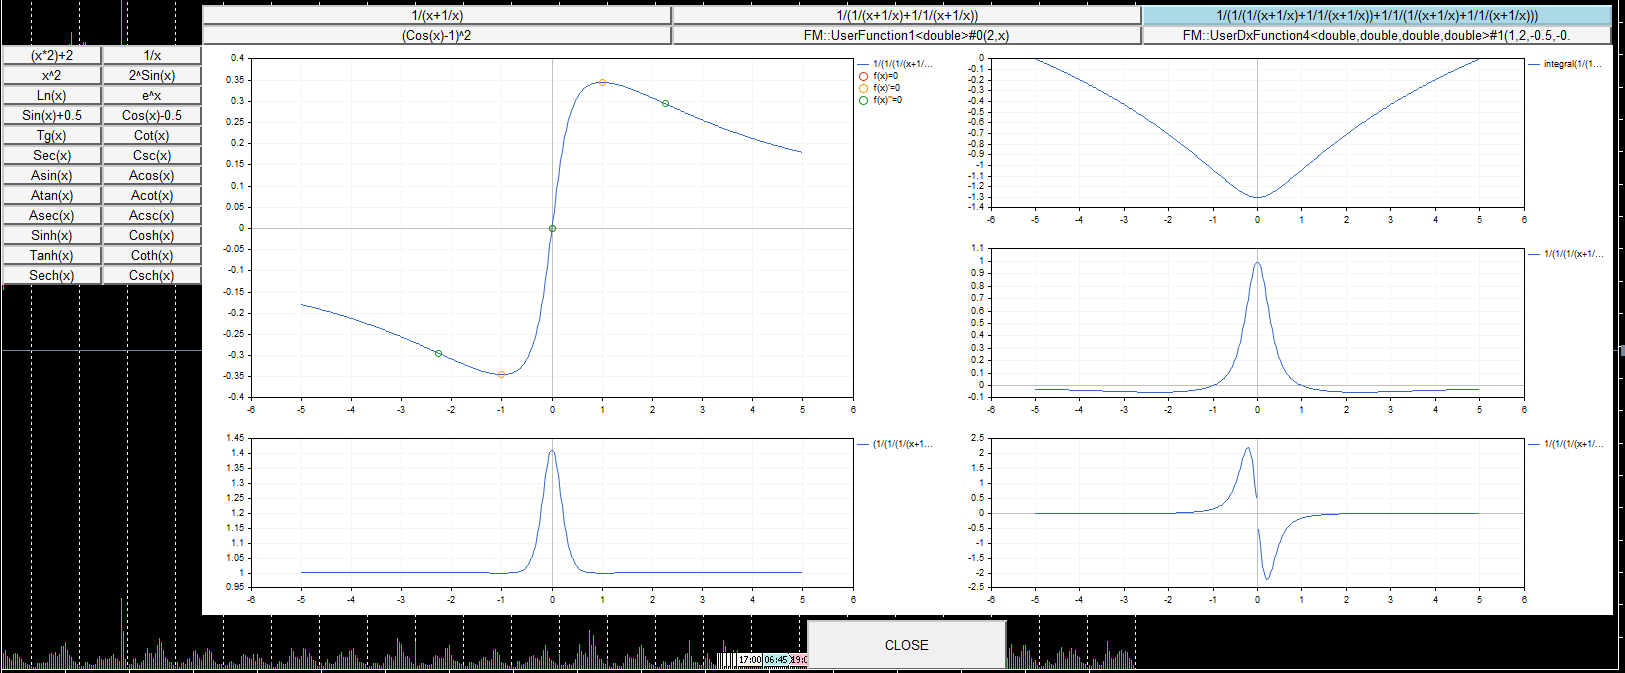
Добавил полезные специальные функции
и проиллюстрировал типичную методическую ошибку роботостроения (она у всех есть)
и проиллюстрировал типичную методическую ошибку роботостроения (она у всех есть)

Maxim Kuznetsov

чё-то как-то с трудом идут слова для предполагаемой статьи
с кодом всё проще..
при текущих тенденциях, ещё чуть и он сам обретёт самосознание и начнёт писать тексты :-)
с кодом всё проще..
при текущих тенденциях, ещё чуть и он сам обретёт самосознание и начнёт писать тексты :-)

:


