• Обзор
  • Отзывы
  • Обсуждение
  • Что нового

Audusd and Nzdusd Hedge Strategy

Caution!   This indicator is mainly for investors and medium term traders,  Day-trading is not possible! This is because correlation is a medium to long term thing.   Ideal use of this indicator is for currency Option sellers, where they can deploy sure fire profiable Option selling over few days to several weeks out. We provide further advice on this plus an optional hedge strategy idea and indicator on long time rentals*.


This indicator keeps performing very well,  in all market conditions,  making it extremely difficult to get trapped on the wrong side of the market

and only has temporarily open losing trades when timing is bad, and final real winning trades.  In addition, it has some unique ultra accurate signals occuring on daily and weekly charts,  few times a year.


An indicator with an incredible edge in detecting one type of bounding condition, one where the forward trade is bound to reverse!

No other indicator in the market does this!


Forward trade = long AUDUSD & short NZDUSD

Reverse trade = short AUDUSD & long NZDUSD


This indicator comes with complete support and version updates, for example one client requested custom made version with email alerts and additional training and guidance, which we delivered over several months.


In these strategies we trade the combined trend, we trade AUDUSD and NZDUSD at the same time, and yet one of them will usually be a losing trade and the other will be a winner, and often we don't know which will be which.  NO classic forex strategy is this profitable! The only catch is that you need more capital than classic strategies. It's far better than classic forex, Binaries, or Cryptos. Of course is not the only 2 pair strategy, but it is one of the best. Before this one we used to test the GOLD vs USDJPY strategy (inverse markets)


This is for large account traders seeking low stress/risk trading!


This strategy is quite safe, there's no need to worry about stops getting triggered, the trade is self protected against sudden movements, since one trade offsets the other. The indicator takes care of the directional bias, sooner or later some trend may develop.

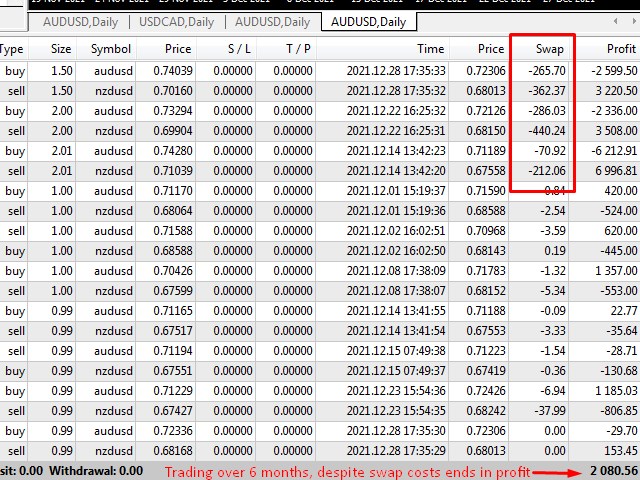
This strategy requires more capital to implement than classic trading. Nonetheless, it can make many $1000s per year, on a medium size account. Risk is significantly lower! Typical profitability is few $100s per week, at one lot size.  More specifically,  in actual demo tests over 6 months, this strategy was able to turn a $50K demo account into $225K, trading in relaxed mode, just once per day, on trades lasting few days each. When the trend of the 2 pairs changed against us, we were able to get out at small loss, typically at a $150-$300 loss, then catching the new trend right away for a profit in the range of $400 to $1500.


How to use:

Drop the indicator on either AUDUSD or NZDUSD chart, or any other chart, it will work. Please read through the instructions.

also on the sam chart use the free trading tool to see what a trade would look like

Free trade simulation tool


This is an indicator which looks into the deep hidden correlation patterns between AUDUSD and NZDUSD. As you pobably know these two pairs are strongly positively correlated, yet the correlation is not clear, nor can you just buy one and sell the other at random and hope to have a hedged trade scenario, because a directional trend component still does exist.


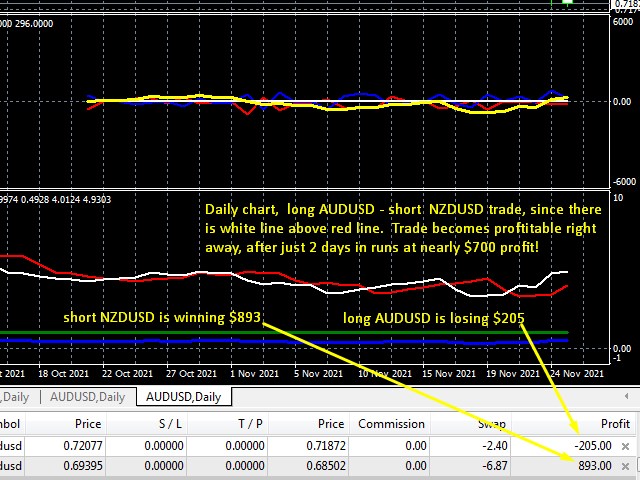
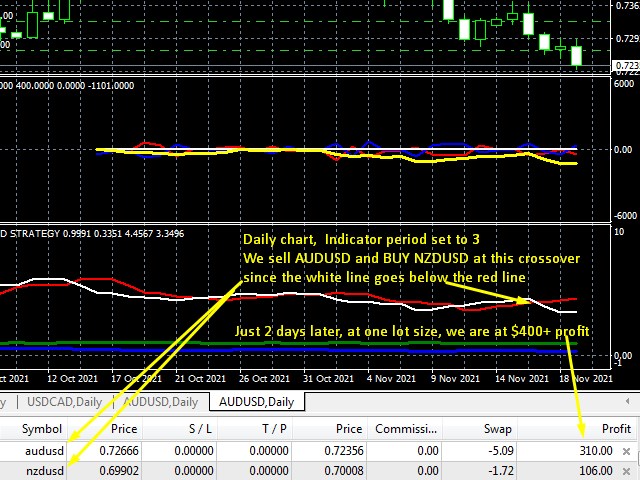
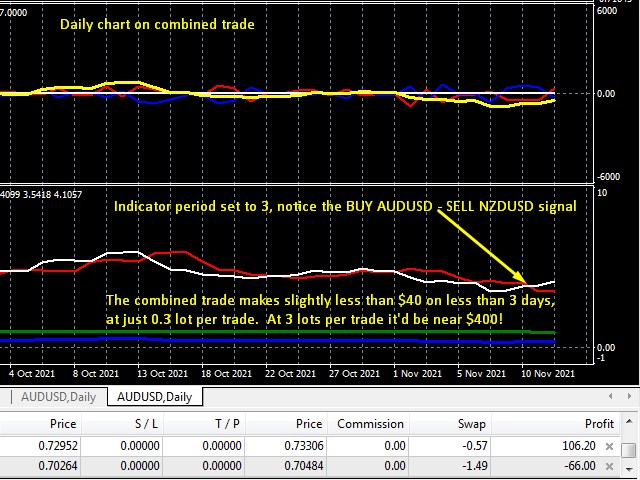
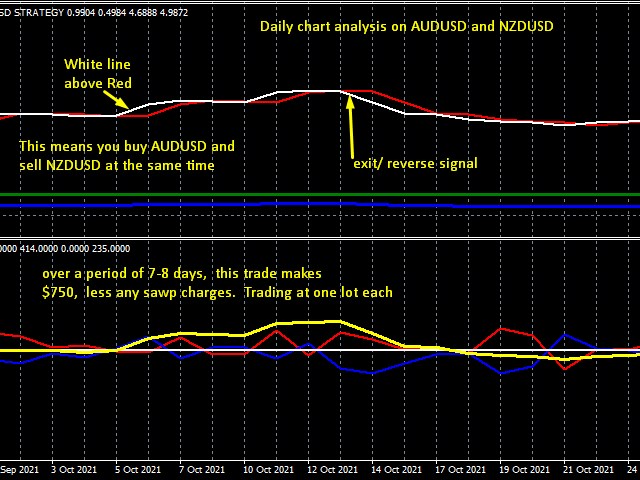
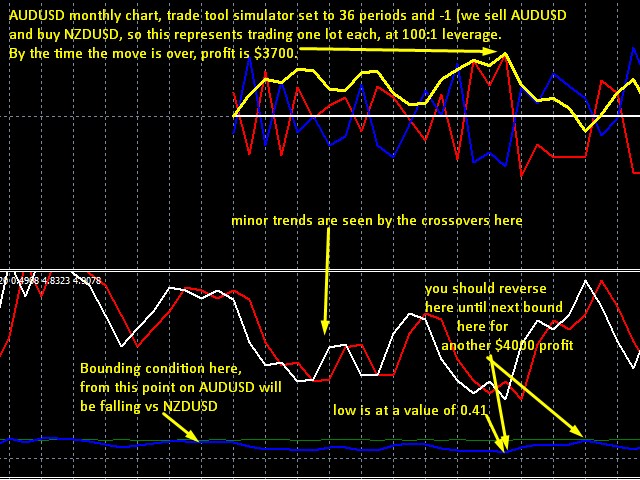
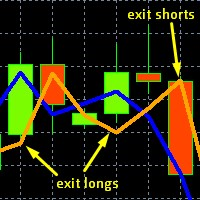
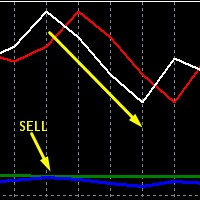
The indicator does just that, it detects the directional component in 2 phases, first ti detects the momentum based component, which si apparent in all time frames.  If the white line is aboe the red line,  then you have to buy AUDUSD and SELL NZDUSD.   If the White line is below the Red line you have to sell AUDUSD and buy NZDUSD.  No stops are required, since further risks on one pair are offset by the opposing trade in the other currency pair.


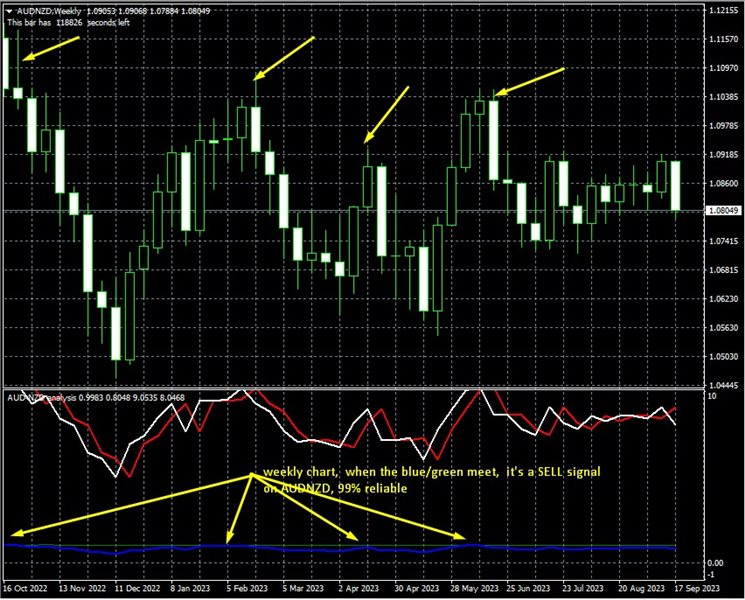
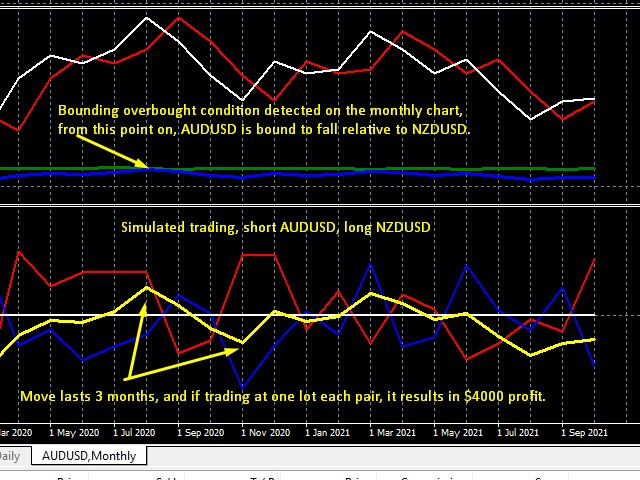
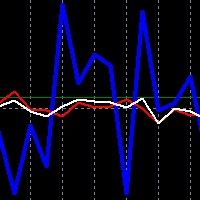
On the second, more long term phase (weekly and monthly charts only),  the indicator does something incredible,  it can detect bounding conditions when the long AUDUSD short NZDUSD is totally exhausted, and there's no chance of going further, which means the trend will reverse you have to SELL AUDUSD, and BUY NZDUSD.  This is incredibly accurate!  And it is detected when the blue line approaches the value of 1, which is almost always at the Green line.  This is something which is impossible to do in single pair trading!  As you know with indicators such as RSI, overbought can become more overbought,  whereas here with these 2 pairs,  when a bounding condition occurs, it is really overbought and cannot go any further, that is what a bounding condition is.


The reverse is not possible,  we cannot detect bounding conditions when the said trade is oversold,  we can only approximate oversold levels on the Blueline, based on previous lows. 


All in all,  the  White and Red lines are a kind of momentum indicator,  but because we are trading 2 pairs, the underlying combined trend is much smoother than trading any single currency pair on its own. That being said,  it is possible for this momentum function to repaint.  Whereas the weekly and monthly bounding overbought conditions, is an indication which happens few times over the year, but is so solid, we have never seen it repaint, or give nonsense.


#hedge trading,  #corrolation hedge, #directionless trading, #hedge fund method, #riskless arbitrage


Рекомендуем также
Black series MT4 - Индикатор предназначен для торговли на бинарных опционах с Tаймфреймом М1-M5-M15 Мультивалютный (Работает на криптовалюте и на валютных парах) Сигнал появляется при открытии свечи До 90% верных сигналов Полностью отсутствует перерисовка сигналов  Можно использовать с другими индикаторами. Хороший для скальпинга! В Настройках есть: -Методы работы индикатора -И Аллерт Цвет стрелок Красный сигнал вниз Синий сигнал вверх Так же смотрите видео как работает индикатор и появляются си
Chart Patterns Detect 15 patterns (Ascending Triangle, Descending Triangle, Rising Wedge, Falling Wedge, Bullish Flag, Bearish Flag, Bullish Rectangle, Bearish Rectangle Symmetrical triangle, Head and Shoulders, Inverted Head and Shoulders, Triple top, Triple Bottom, Double Top, Double Bottom) Use historical data to calculate the probability of each pattern to succeed (possibility to filter notification according to the chance of success) gives graphic indication about the invalidation level and
Это трендовый индикатор без перерисовки Разработан вместо стратегии бля бинарках опционов (по цвету свечи мартингейл) Так же хорошо работает в торговле на рынке форекс Когда открывать сделки ( бинарные опционы ) Сигнал появится в месте с свечой сигналит на текущую свечу  Открывать сделку стоит на одну свечу текущего таймфрейма рекомендуется м1 и М5 При появлении синей точки открываем сделку вверх При появлении красной точки открываем сделку в низ. Как открывать сделки на Форекс. При полу
Owl smart levels
Sergey Ermolov
4.63 (54)
Версия MT5  | Как установить?  | FAQ Индикатор Owl Smart Levels   – это полноценная торговая система внутри одного индикатора, которая включает в себя такие популярные инструменты анализа рынка как усовершенствованные   фракталы Билла Вильямса , Valable ZigZag, который строит   правильную волновую структуру   рынка, а также  уровни Фибоначчи,   которые   отмечают точные уровни входа в рынок и места взятия прибыли. Подробное описание стратегии Инструкция по работе с индикатором Советник-помошник
Strength and weakness of currencies : Shows the currency status at any time, values between 50 and -50 are neutral, everything outside indicates a trend change  Waves : Current state of waves, daily, weekly monthly and yearly Recommended volume for trading a specific number of waves Yearly High Low Drawn waves on which the market will react in advance, without redrawing Yearly candle with bonus levels used to display deviations  For more info contact me
Свинг-трейдинг - это первый индикатор, предназначенный для обнаружения колебаний в направлении тренда и возможных разворотов. Он использует базовый подход свинговой торговли, широко описанный в торговой литературе. Индикатор изучает несколько векторов цен и времени для отслеживания направления совокупного тренда и выявляет ситуации, когда рынок перепродан или перекуплен и готов к исправлению. [ Руководство по установке | Руководство по обновлению | Устранение неполадок | FAQ | Все продукты ]
"Тренд - друг трейдера" . Это одна из самых известных пословиц в трейдинге, потому что правильное определение тренда может помочь заработать. Однако проще сказать о торговле по тренду, чем сделать, потому что многие индикаторы основаны на развороте цены, а не на анализе тренда. Они не очень эффективны при определении периодов тренда или в определении того, сохранится ли этот тренд. Мы разработали индикатор Trendiness Index , чтобы попытаться решить эту проблему. Индикатор определяет силу и напра
Индикатор LineMagnit для MT4 - высокоточный индикатор, который строит уровни поддержки и сопротивления, притягивающие к себе цену по принципу магнита. Это позволяет трейдеру легко определить наиболее вероятные точки входа и выхода из рынка, а также определить направление сил в рынке так как уровни строятся на основе вливаний капитала в инструмент. Индикатор LineMagnit   оснащен интуитивно понятным графическим интерфейсом, который позволяет быстро находить и анализировать уровни поддержки и сопро
Fourteen plus nine What is it for? Applying Tom DeMark’s TD Sequential serves the purpose of identifying a price point where an uptrend or a downtrend exhausts itself and reverses. . What are the main components of TD Sequential? TD Sequential has two parts – TD Setup and TD Countdown. The first phase of TD Sequential starts with a TD Setup and is completed with a 9 count. When the 9 count is completed, it is at that point, a price pause, price pullback, or reversal is likely. It is also at tha
This is the complete REX package. It consists of the lite, pro and ULTRA version.  Perfect for beginners and intermediates. REX complete is 100% non repaint. The strategy is based on a mix of different strategies, statistics, including pivot points, oscillators and patterns.  As the trading idea consists of a variety of some classic indicators like Momentum, Williams Percent Range, CCI, Force Index, WPR, DeMarker, CCI, RSI and Stochastic, it is clear that the fundamental indicators have being
VR Cub
Vladimir Pastushak
VR Cub это индикатор что бы получать качественные точки входа. Индикатор разрабатывался с целью облегчить математические расчеты и упростить поиск точек входа в позицию. Торговая стратегия, для которой писался индикатор, уже много лет доказывает свою эффективность. Простота торговой стратегии является ее большим преимуществом, что позволяет успешно торговать по ней даже начинающим трейдерам. VR Cub рассчитывает точки открытия позиций и целевые уровни Take Profit и Stop Loss, что значительно повы
Towers -  Индикатор тренда, показывает сигналы, можно использовать с оптимальным коэффициентом риска. В расчетах использует надежные алгоритмы. Показывает благоприятные моменты для входа в рынок стрелками, то есть использовать индикатор достаточно просто. Он сочетает в себе несколько фильтров, отображая на графике стрелки входа в рынок. Учитывая это обстоятельство, спекулянт может изучить историю сигналов инструмента и оценить его эффективность. Как видите торговать с таким индикатором легко. До
BinaryIndicator - высокоточный индикатор для торговли бинарными опционами. Отличные результаты показывает при скальпинге. Основу данного индикатора составляет многофакторный анализ трендовых индикаторов, а также подтверждающих осцилляторов, что в итоге дает повышенную точность сигналов. Преимущества индикатора Повышенная точность сигналов; Показывает отличные результаты при торговле бинарными опционами с временем экспирации от M30 до M1 ; Работает на любых временных интервалах; Работает с любы
This indicator is based on the Weis wave principle of wave volume. Below are few features of the indicator It draws the wave on the chart while the accumulated volume per wave in a different window at the bottom of the chart You can configure the turning point move It displays the accumulated volume (in thousands, eg for 15000 volume it will show 15) at the end of each wave You can also configure to show number of candles in the wave along with the wave volume The indicator calculates the distin
Taurus All4 Taurus All4 is a high-performance indicator, it will tell you the strength of the trend, and you will be able to observe the strength of the candle. Our indicator has more than 4 trend confirmations. It is very simple and easy to use. Confirmation Modes Candle Trend Confirmations: When the candle switches to light green the trend is high. When the candle switches to light red the trend is reverting down. When the candle changes to dark red the trend is low. Trendline Trend Conf
Анализ распределения Галактического Объема (VSA) - это индикатор, предназначенный для визуализации Объема и доли, в которой он влияет на волатильность разброса различных пар. Стратегия состоит из следующего: Bull Trend: Всегда в пользу тренда, открывайте покупки на минимумах тренда, при условии, что он совпадает с большим объемом, показанным индикатором Galactic VSA. Нисходящий тренд: Всегда в пользу тренда, открывайте торговые операции на максимумах тренда, при условии, что он совпадает с
PipFinite Trend PRO
Karlo Wilson Vendiola
4.9 (2775)
Стратегия пробоя для торговли по тренду, фильтрация и все необходимые функции, встроенные в один инструмент! Интеллектуальный алгоритм индикатора Trend Pro с точностью определяет тренд, отфильтровывает рыночный шум и генерирует входные сигналы и уровни выхода. Новые функции с расширенными правилами статистического расчета улучшают общую производительность этого индикатора. Важная информация Для максимального использования потенциала Trend Pro прочитайте полное описание www.mql5.com/en/blogs/
Introduction to Chart Pattern MT Chart Pattern MT is a chart pattern scanner to detect the triangle pattern, falling wedge pattern, rising wedge pattern, channel pattern and so on. Chart Pattern MT uses highly sophisticated chart pattern detection algorithm. However, we have designed it in the easy to use with intuitive user interface. Chart Pattern MT will show all the patterns in your chart in the most efficient format for your trading. You do not have to do tedious manual pattern detection an
Индикатор представляет собой видоизмененный индикатор Fibonacci-SS https://www.mql5.com/ru/market/product/10136 . Отличается поведение при размещения отложенных ордеров и линии TP. Автоматическое размещение линий Фибрначчи от максимума до минимума видимых баров: Автоматические отложенные ордера (Buy/Sell) Taking Profit 1, Taking Profit 2 как точки разворота и Taking Profit 3 для улучшения возможной прибыли. Лучшее соотношение риска и прибыли. Простой и мощный индикатор Этот индикатор, наряду с
This index can be traced back to historical transactions, and can clearly see the trading location, trading type, profit and loss situation, as well as statistical information. Showlabel is used to display statistics. Summy_from is the start time of order statistics. This parameter is based on the opening time of the order. Backtracking can help us to correct the wrong trading habits, which is very important for beginners to learn manual transactions. This index is suitable for each time
Super Gator
Agustinus Biotamalo Lumbantoruan
This indi shows the following 1. Supertrend 2. Alligator (Not a regular alligator) 3. ZigZag 4. Moving Average 5. Trend Continuation/Mini correction Signal (plotted in X) (See screenshots in green background color 6. Early Signal Detection (See screenshots in green background color) You may treat Alligator as the lagging indicator The leading indicator is the supertrend. The zig zag is based on the leading indicator where it gets plotted when the leading indicator got broken to the opposite.
PABT Pattern Indicator - это классическая реализация одного из сигнальных паттернов.  Логика индикатора заключается в том, что он определяет ситуации в которых максимум и минимум сигнального бара находится в пределах максимума и минимума предыдущего бара, тем самым показывает разворот тренда. Для сигнала на покупку сигнальный бар закрывается выше цены открытия, для сигнала на продажу сигнальный бар закрывается ниже цены открытия, предыдущий бар соответственно противоположного сигнальному типа. В
Trend Flasher Trend is your friend is the age old saying quote in trading arena, there are though many ways to gauge the trend and its direction, more scientific measure and logically meaningful will be an ATR break outs to identify and spot the trend and its acceleration, so we created this easy to use trend identification panel and optimized super trend based multi time frame panel entry system to aid and help the traders to make their trading decision. Unique Features of Trend Flasher 1
UniversalIndicator - универсальный индикатор. Отличный помощник для начинающих и профессиональных трейдеров. В алгоритме индикатора используются вероятностные и статистические методы анализа цены торгового инструмента. Индикатор устанавливается обычным образом. Преимущества индикатора работает на любом временном периоде работает с любым торговым инструментом имеет высокую вероятность положительного прогноза не перерисовывается Параметры индикатора LengthForecast  =30 - количество прогнозируемых
Профессиональный эксперт форекс   Gyroscope (для пар EURUSD, GBPUSD, USDJPY, AUDUSD, USDCHF, EURGBP, EURJPY, NZDUSD, USDCAD, EURCHF, AUDJPY, CADJPY)  ализирующий рынок при помощи индекса волн эллиота. Волновая теория Эллиотта — интерпретация процессов на финансовых рынках через систему визуальных моделей (волн) на ценовых графиках.  Автор теории Ральф Эллиотт выделил восемь вариантов чередующихся волн (из них пять по тренду и три против тренда). Движение цен на рынках принимает форму пяти вол
[V 1.00] Выпущен MTF NRPA 5 RSI RTD! Приборная панель в реальном времени без перерисовки стрелок. Если вы устали от использования различных индикаторов RSI, но обнаружили, что они неточны, попробуйте этот инструмент. Обычно люди устанавливают только 1 RSI, чтобы определить уровень OBOS на таймфрейме. Плохая новость заключается в том, что вы не можете одновременно видеть уровни и тренды OBOS на разных таймфреймах. Вот почему я разработал этот торговый инструмент. Вот как это объясняется:
Это отличная система технических индикаторов, которая анализирует периодические восходящие или нисходящие торговые тенденции с малых, средних и больших аспектов. Period1 в параметрах — малый период времени, Period2 — средний период времени, Period3 — большой период времени, small_symbol — идентификатор сигнала 1, middle_symbol — идентификатор сигнала 2, big_symbol — идентификатор сигнала 3 ;alert — переключатель кнопки предупреждения, Mail — переключатель отправки электронной почты, а Not
IPDA and PD Ranges MT4
Thank-god Avwerosuoghene Odukudu
5 (1)
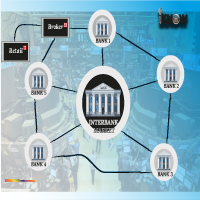
IPDA AND PD RANGES. Interbank Price Delivery Algorithm (IPDA) Range Liquidity and trades in the FX market take place in a decentralized manner as banks, brokers and electronic communication networks (ECNs) interact with one another to set prices. In FX, and ECN is a trading platform or electronic broker that hosts bids and offers and transmit them to users worldwide. ECN broadcasts a price around the world as various participants leave orders to buy and sell. Banks provide streaming prices base
Прежде всего стоит подчеркнуть, что этот торговый индикатор не перерисовывается, не перерисовывает и не отставает, что делает его идеальным как для ручной, так и для роботизированной торговли. Атомный аналитик - это индикатор ценового действия PA, который использует силу и импульс цены, чтобы найти лучший край на рынке. Оборудованный расширенными фильтрами, которые помогают убирать шумы и ложные сигналы, и повышают торговый потенциал. Используя несколько слоев сложных индикаторов, Атомный анали
Advanced Trend Regime
Shellard Securities (Pty) Ltd
The indicator has been designed to function on any time-frame and any pair.   This regime filter will help the trader better evaluate whether the current market is trending, and in which direction. It quickly reacts to changes in market dynamics using a series of advanced calculations. The user is able to select whether the calculation remains standard, or if a further filter constraint is added to the calculation.   A Yellow moving average of the signal has been included for the trader to smoot
С этим продуктом покупают
Представляем удивительный форекс-индикатор "Miraculous": раскройте силу точного трейдинга Вы устали от бесконечного поиска лучшего форекс-индикатора, который действительно доставляет исключительные результаты на всех таймфреймах? Не ищите дальше! Представляем вам форекс-индикатор "Miraculous", который пришел, чтобы изменить ваш опыт трейдинга и поднять ваши прибыли на новый уровень. Основанный на передовых технологиях и годам тщательной разработки, форекс-индикатор "Miraculous" является вершиной
Idea: RSI ( Relative Strength Index) and CCI ( Commodity Channel Index ) are powerfull to solved the market.  This indicator has Smoothed Algorithmic signal of RSI and CCI. So that, it separates the market into buy and sell zones, these areas are marked with arrows, red for downtrend, green for uptrend. This algorithm has the effect of predicting the next trend based on the historical trend, so users need to be cautious when the trend has gone many candles. Please visit screenshots
IA Trendx3 PRO
Marco Aurelio Santos Costa
Что если бы Бог создал торговую систему? Без чудес... Просто посмотрите, как математика может быть эффективной на рынке. Нам удалось объединить технический анализ / ценовое движение в индикаторы, создав лучшую настройку для торговли, будь то на рынке Forex, индексах или акциях. Нам понадобилось 2 года, чтобы создать что-то, что действительно работает, и теперь пришло время вам это открыть. TrendX3 - это революция в анализе трендов. На основе передовых алгоритмов и данных в реальном времени он пр
The breakout algorithm is a technique based on price, price features, to shape a breakout strategy. The strategy in this indicator will not be redrawn (none-repaint indicator), it is suitable for short or long term traders In the screenshot is the EURUSD pair, these currency pairs, commodities or stocks, it have similar strength *Non-Repainting (not redrawn) *For Metatrader4 Only *Great For Scalping *Great For Swing Trading *Arrow Entry, Green is Long, Red is Short *Works On Any Timeframe *Work
Dear Onis, This Indicator is used for   GBPUSD, US30 and GOLD on 1-Min Chart . For US30 , Depending on your broker, Minimum Lot Size will differ from 0.01 to 1.0 lots. My Current Account is trading at 1.0 lots at $1 per point . Please check with your Broker what's the Margin Required for your Minimum lot sizes before you trade on your Real account. I have Forward Tested the indicator for around 6 months before releasing it to the public. ( No Demo is available for the Indicator, Strategy
Скачайте индикатор уровней поддержки и сопротивления( Support and resistance ). Индикатор рисует горизонтальные и трендовые уровни поддержки и сопротивления. Настройки индикатора: Trends - Установка режима отображения трендовых или горизонтальных уровней поддержки сопротивления Yes - отображает только трендовые уровни No - отображает только горизонтальные уровни UseResource - Установка режима использования встроенных в индикатор ресурсов. Yes - использовать индикатор ZigZag из ресурсов продукта.
Торговая система для ручной торговли The [GRAFF] III основана на многочисленных индикаторах MetaTrader (MT4). Собранные вместе, эти индикаторы представляют собой эффективный торговый инструмент. Система включает в себя более 20 различных пользовательских индикаторов, которые были тщательно отобраны и протестированы на длительном историческом периоде. Каждый конкретный индикатор основан на той или иной формуле расчета. Таким образом вся система настроена таким образом, чтобы отсеивать ложные сигн
Данный индикатор используется для определения тренда. Используются три скользящие средние и ADX. Оснащен системой оповещений: звуковые сигналы, оповещения на электронную почту и три типа алертов, включая отправку сообщений на мобильный телефон. Наилучший результат зафиксирован на M5. Система оповещений активируется при достижении трендом установленного значения. Индикатор работает только с CFD. Входные параметры SoundAlarm = true - звуковое оповещение Sendmail=true - отправка уведомления о сиг
Данный индикатор используется для определения тренда. Используются три скользящие средние и ADX. Оснащен системой оповещений: звуковые сигналы, оповещения на электронную почту и три типа алертов, включая отправку сообщений на мобильный телефон. Наилучший результат зафиксирован на M5. Система оповещений активируется при достижении трендом установленного значения. Индикатор работает только с Forex-символами. Входные параметры SoundAlarm = true - звуковое оповещение Sendmail=true - отправка уведо
Данный индикатор используется для определения тренда. Используется стандартный индикатор MACD. Оснащен системой оповещений: звуковые сигналы, оповещения на электронную почту и три типа алертов, включая отправку сообщений на мобильный телефон. Лучшие результаты были получены на 5-минутном графике. Система оповещений активируется при достижении трендом установленного значения. Работает на Форекс с CFD и другими инструментами. Первое значение - быстрое EMA. Значение по умолчанию 26. Входные парам
Индикатор отображает в отдельном окне разность между количеством пунктов, которые увеличили цену, и количеством пунктов, которые уменьшили цену за заданный в настройках интервал времени. Временной интервал, за который проводится расчет, выражается в количестве баров графика, на который индикатор прикреплен. Данный подход позволяет оценить в какую сторону (рост или падение) движется цена инструмента, силу движения и величину движения в пунктах. В работе индикатор использует только тики поступающи
NostradamusMT4
Andrey Spiridonov
1 (1)
NostradamusMT4 - мощный индикатор из набора профессионального трейдера. В основе индикатора лежит авторский метод Андрея Спиридонова расчета цены (ESTIMATED PRICE) для текущей цены свечи. Преимущества Индикатор не перерисовывается; Работает на любых временных интервалах; Работает с любыми торговыми инструментами; Отлично подходит для скальпинга и торговли бинарными опционами. Параметры Color - цвет линии ESTIMATED PRICE FUTURE . Порядок работы с индикатором Индикатор формирует расчетную ц
BinaryScalping - профессиональный индикатор для торговли бинарными опционами и скальпинга. Алгоритм работы индикатора основан на расчете опорных точек ( Pivot) для каждого временного периода отдельно, анализируется расположение цены торгового инструмента относительно опорных точек и вычисляется вероятность совершения торговой операции. В индикатор встроен фильтр торговых сигналов по глобальному тренду. Индикатор устанавливается обычным образом и работает с любым торговым инструментом. На графике
BinaryUniversal - сигнальный индикатор для бинарных опционов и форекс. В своей работе индикатор использует сложный алгоритм генерации сигналов. Прежде чем сформировать сигнал, индикатор анализирует волатильность, свечные модели, важные уровни поддержки и сопротивления. В индикаторе есть возможность настроить точность сигналов, что дает возможность применить данный индикатор как для агрессивной, так и для консервативной торговли. Индикатор устанавливается обычным образом, работает на любом времен
The arrows are calculated with: -     2 Parabolic  parameters -     2 ADX parameters -     4 Stochastic parameters We recommend to combine it with Parabolic, ZigZag or Elliot waves indicator. Always trade the trend! If you make sure to draw your trend lines and support/resistance zones you will just have to wait for the signal to appear. Take the trade. For Binary Options it is advisable to set the expiry time to 5-15 min in M1 chart. THIS INDICATOR IS ZERO REPAINT Best assets to trade: -
Let´s try to make some real money! Call me profit addicted. I thought why not try to make THE dream come reality. With discipline, a clear strategy and this indicator I focus on entering the perfect trades. This indicator is very easy to use as you will get perfect entry points for Put or Call trades. The arrows are calculated with: -     Momentum  parameters -     Candle stick patterns -     Fundamental Price action We recommend to combine it with Parabolic, ZigZag or Elliot waves indic
SystemPro - профессиональный индикатор, представляет собой полноценную, самодостаточную авторскую стратегию работы на рынке Forex. Уникальный алгоритм работы анализа валютного рынка основан на расчете опорных точек на трех разный временных периодах. Таким образом, индикатор одновременно анализирует долгосрочное, среднесрочное и краткосрочное поведение цены перед тем как выдать сигнал. Индикатор устанавливается обычным образом и работает с любыми торговыми символами. Преимущества индикатора явл
Pisces TheProfitZone "Pisces TheProfitZone MT4 Indicator Powered byFxGangster" This indicator will calculate new support and resistant zone everyday, and that give us a trading zone such as thats telling us TP and SL, So it still telling us for where should the price will go reach? Fore Example. Uptrend : If Price can stay upper a Line and price close higher above a Line, then the price will continue go up to reach next Line. Downtrend : If Price can't pass to stay upper a Line and the pr
Golden Chip provides Basic Market Structure, Fibonacci, supply and Demand Zones. Letting you identify when a sell off point is approaching or whne a buy opportunity is arriving. The awesome thing about Golden Chip is that, you will see rejection levels or continuation before ANYBODY ! This indicator moves directly with price and lines up perfectly with the Chart. Some indicators would lag but NOT this one ! Golden Chip is amazing for Clean chart (Naked Chart). GOLDEN CHIP IS ONLY ON METATRADER (
A scalping indicator based on mathematical patterns, which on average gives signals with relatively small SL, and also occasionally helps to catch big moves in the markets (more information in the video) This indicator has three main types of notifications: The first type warns of a possible/upcoming signal on the next bar The second type indicates the presence of a ready signal to enter the market/open a position The third type is for SL and TP levels - you will be notified every time price r
После покупки свяжитесь со мной через mql5. Так мы сможем убедиться, что дашборд корректно работает на вашей платформе. Вложенные зоны Forex предназначены для получения всех ключевых уровней на одном графике, чтобы найти области отскока и прорыва. Все, что вы можете себе представить, переносится из нескольких таймфреймов на одну панель мониторинга, чтобы определить вложенные области слияния и спроса. Если приборная панель показывает высокие баллы, это означает четкое определение поддержки и с
You can fins our other products from link : https://www.mql5.com/en/users/drbastem/seller   Also, you can ask all your questins from email : haskayafx@gmail.com or mobile : +90 530 867 5076 or @MehmetBastem    on telegram application This system created by using Corrected MACD, Different time zone support and resistant points,  Parabolic Sars, Bollinger band, 4 moving average, stochastic oscillator and ADX. In this system, Using parabolic Sars reverse bar count,  Pips difference between clo
This indicator prepared by using 57 days moving averagr and least square method. It can only work for 1 hr time interval. Once a signal created. It is creating order and 2 limit orders. It works in CFD pairs as well as in Forex pairs. You can fins our other products from link : https://www.mql5.com/en/users/drbastem/seller Also, you can ask all your questins from email : haskayafx@gmail.com or mobile : +90 530 867 5076 or @MehmetBastem on telegram application This system is for Long term and pr
This system created by using Corrected MACD,ADX, Different time zone support and resistant points,  Parabolic Sars, Bollinger band, 9 moving average, stochastic oscillator and ADX. In this system, Using parabolic Sars reverse bar count,  Pips difference between closing price and last parabolic Sars in the direction of signal and Trend strength.   Note that this system is not martingale, this system is creating limit order.    Best result for the orders are 25 Pips in USD, 50 Pips in GBP. Best
This system created by using Corrected MACD,ADX, Different time zone support and resistant points,  tree Parabolic Sars,two Bollinger band, 3 moving average, stochastic oscillator and ADX. In this system, Using parabolic Sars reverse bar count,  Pips difference between closing price and last parabolic Sars in the direction of signal and Trend strength.   Note that this system is not martingale, this system is creating limit order.    Best result for the orders are 45 Pips in USD, 75 Pip
This system created by using  Stochastic oscillator and moving average.  Entrance value and take profit values can be seen by system.  This is system for Long term and profitable. this system can be used for 15 minutes time frame. This system is not  repaints.         This system is for Long term and profitable.  Signals are shown as arrows. as an optional,  you can set a voice alarm or email notification  You can fins our other products from link : https://www.mql5.com/en/users/drbastem/seller
This indicator prepared by using 311,1298 days moving average and Calculates the Envelopes.    This system can be used for 5M time frame.     This system is for Long term and profitable.    Signals are shown as arrows. as an optional,    you can set a voice alarm or email notification    You can fins our other products from link : https://www.mql5.com/en/users/drbastem/seller    Also, you can ask all your questins from email : haskayafx@gmail.com or mobile : +90 530 867 5076 or @MehmetBastem   
This indicator prepared by using 311,1298 days Haskaya Trend Bandse and Calculates the strand ADX.    This system can be used for 5M time frame.     This system is for Long term and profitable.    Signals are shown as arrows. as an optional,    you can set a voice alarm or email notification    You can fins our other products from link : https://www.mql5.com/en/users/drbastem/seller    Also, you can ask all your questins from email : haskayafx@gmail.com or mobile : +90 530 867 5076 or @Meh
This indicator is created by considering volume divergence with price that is outcome of Bollinger band and Envolpes indicators crossing. It won’t repaint.  It is providing 1 market and three pending orders.  If it is followed with patient, it is providing remarkable profit at the end.  This indicator will be on sale soon on expert advisor. Target is calculated for buy orders as follow 1. 50 pips standard 2. Top Bollinger band 3. Sell Signal Target is calculated for buy orders as follow 1. 50
https://youtu.be/t3SLLgcEEPM This indicator prepared by  using Moving Averages, Bollingers Bands .    This system can be used for 5M time frame and Gold Symbols (XAUUSD).     This system is for Long term and profitable.    Signals are shown as arrows. as an optional,    you can set a voice alarm or email notification    You can fins our other products from link : https://www.mql5.com/en/users/drbastem/seller    Also, you can ask all your questins from email : haskayafx@gmail.com or mobile : +90
Другие продукты этого автора
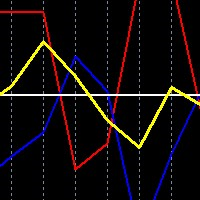
This is a simple free tool for simulating trades when trading both AUDUSD and NZDUSD in a hedge strategy, you can drop the indicator on either market chart.  It is essential because you cannot tell at a glance, what a combined trade would be like, just by looking at the two individual charts separately.  New premium low cost indicator How to use: Drop the indicator on either AUDUSD or NZDUSD chart, or any other chart, it will work. You choose ploting period,   to the number of days/weeks
FREE
This is the original, simpler version of our core EURUSD algorithm (it calculates and displays 2 lines rather than 3), but it is still capable of detecting levels in the market where EURUSD will likely move to. These levels are indicated by unusual large gaps, formed by the two lines. Detailed guidance is given to users.  All in all it works on the very short term,  and more importantly on the daily chart. The differences between this and our top EURUSD indicator, is that this one only dis
For the new traders of this strategy please remember the convention: FORWARD trade =  BUY AUDUSD and SELL NZDUSD at equal lot size REVERSE trade = SELL AUDUSD and BUY NZDUSD at equal lot size Risk is mittigated by the opposing nature of the trades, one tends to offset the other almost 70% of the time,  and for when this is not the case we rely on the indicators accordingly - no stops are used in correlation hedge! This is an enhanced oscillator like analysis of the relationship betw
This is a correlation hedge type indicator which helps trade the obscure relationship between crude oil and natural gas markets. Which is overall an unknown trading concept to most traders, yet a very impressive one. The usual market risk is mittigated through the smooth trend of hedge tading, as well as the leading signals the indicator provides! Pros: low risk trading, normal profits, no need to be right about either market Cons:  requires large capital ----------------------------------
Фильтр:
Нет отзывов
Ответ на отзыв
Версия 5.0 2023.12.29
New version with more user friendly features
Версия 3.0 2023.03.02
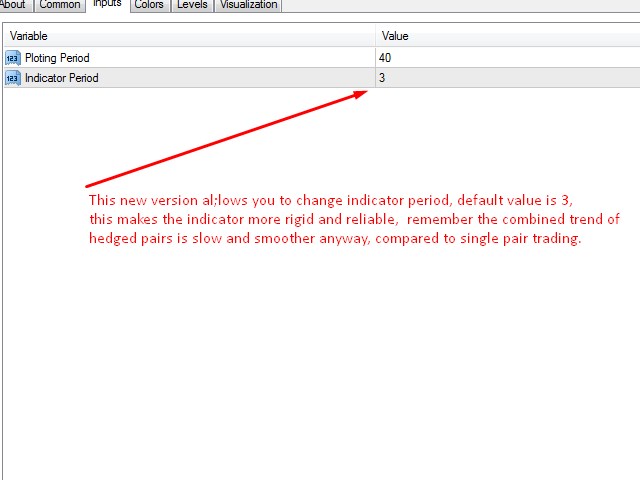
New easier to use version with variable period seting.
Версия 2.0 2021.11.13
New version with variable period option.