• Обзор
  • Отзывы
  • Обсуждение

Adaptive SSA

SSA stands for 'Singular Spectrum Analysis'. It combines elements of classical time series decomposition, statistics, multivariate geometry, dynamical systems and signal processing.
SSA decomposes time series into a sum of components (ETs), with each component representing a lower smoothing, using several SVD (Singular Value Decompositions).

It is a powerful filtering process used in many fields of research (climatology, biomedical, aerospace, etc), where high quality forecasting and smoothing of data is important.

The SSA is adaptive in nature, but this Adaptive Version takes it to the next level, by adding a better fit to the data, while keeping smoothness to its maximum.


YOU NEED A HIGH-END CPU TO USE THIS INDICATOR, SPECIALLY IN ADAPTIVE AND REALTIME MODE. THIS IS AN OPTIMIZED VERSION.


HOW TO USE IT:
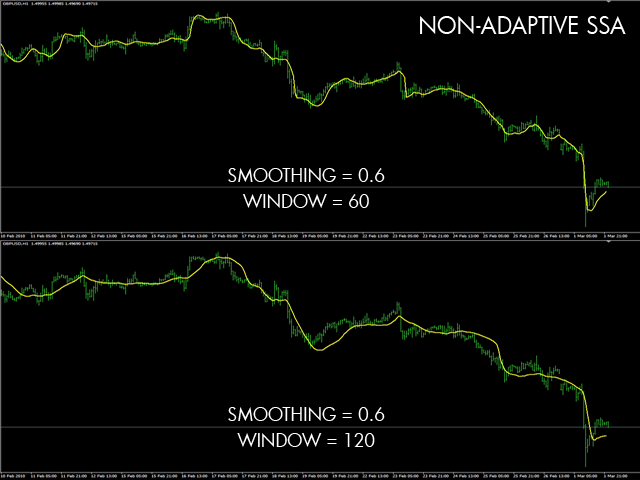
  1. First Set your Window Size. The higher the size, the higher the smoothing capability, but it is also slower to process.
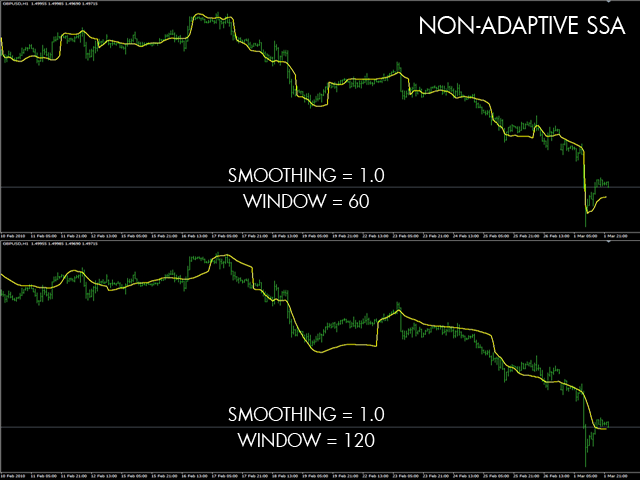
  2. Select the ET bins you like. If you want more smoothing select only 'Bin 1', but 'Both Bins' is often the best choice. Bin 1 selection is often best for the Non-Adaptive mode.
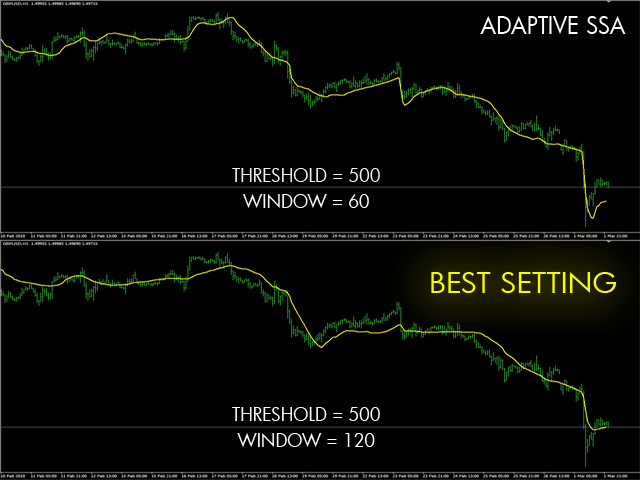
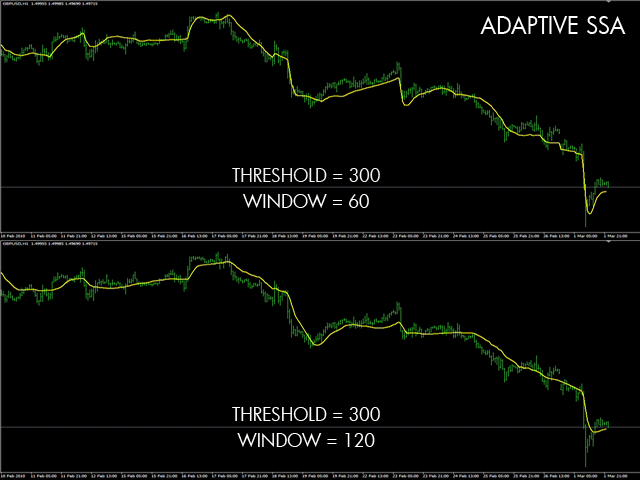
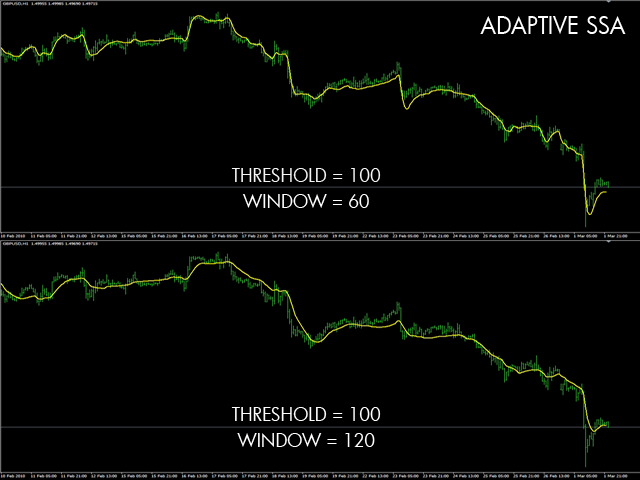
  3. Set the Threshold to a high value (for example 800.0) and lower it step by step until you're satisfied with the adaptiveness of the curve. A value too low and there is no smoothing, A value too high and there is too much smoothing and no adaptiveness, so you have to find the right value for your trading style.


WHAT TO DO IF YOU HAVE A SLOW PC :

If the processing of N past bars is cut short because of the time limit set in the parameters, you can do several things:
  1. use a VPS
  2. Make the processing time limit higher ('Max Computation Time').
  3. Lower the Smoothing factor.
  4. Lower the Window Size (less smoothing but faster processing).
  5. Use only ET Bin 1 only.
  6. Raise the 'Step' parameter in Adaptive Mode.
  7. Disable 'Extra Precision'.

As a rule of thumb, the bigger the 'Window Size', the better the smoothing, but also requires more processing power.

If your computer is not powerful enough to process Realtime tick data :
This indicator has been made to be used at the close of the bar. The computation happens only once per bar, at the close of the bar.
Another way is to use the 'extrapolate last bar' function : It will compute the SSA for the last bar at the open.

PARAMETERS DESCRIPTION
  • Threshold -- the smoothing is lowered step by step until the difference with the signal is under the 'Threshold' value.
  • Smoothing Start  [0..1] 
  • Smoothing Stop  [0..Smoothing Start]
  • Adaptive Step [1..window] -- The 'Smoothing Start' value is lowered step by step (using the 'Adaptive Step' value), until it reaches the 'Smoothing Stop' value.
  • Extra Precision
  • Extra Precision Threshold [0..1] -- If 'Extra Precision' is set to 'True', the step value is lowered to the smallest value possible.
Global Parameters :
  • ET -- You can select the 'Bin 1', the 'Bin 2' or 'Both'. 'Bin 1' is smoother than 'Bin 2' but sometimes you need both, specially in the 'Adaptive Mode'.
  • Window Size -- Higher Size = more smoothing but also is lower to process.
  • Realtime Mode (recomputes SSA on every tick) -- this mode requires a high-end CPU and is not really necessary because it's better to wait the end of the bar before deciding if there is a reversal.
  • Max Realtime Tick Computation Time (in seconds) -- This value is the maximal duration of the processing of ONE window. If the processing takes longer, 'Realtime Mode' processing is not possible, because ticks will arrive faster than the processing of the data is possible.
  • Extrapolate last bar -- Forecast of the next value based on the past values and the Open of last bar ('Realtime Mode' must be 'OFF').
  • Use Additional Memory -- More memory is used but this speeds up the processing of the SVDs.
  • Bars to compute -- Number of past values to compute.
  • Max Computation Time (in seconds) -- If the processing of the 'Bars to compute' past values takes more time than that value, the process will be stopped.
Alerts :
  • Display Current Slope Value -- true/false. Will print out the slope of the current bar in the "Experts" or "Log" tab.
  • Alert on Reversal
  • Minimum reversal amount (in points) -- the minimum amount a price has to pull back before an alert is sent.
  • Alert on Slope
  • Minimum Slope amount -- the minimum slope of the SSA before an alert is sent.
  • Use MT4 Sound Alerts
  • Use Email Alerts
  • Use Push Alerts 


Рекомендуем также
SSA stands for 'Singular Spectrum Analysis'. It combines elements of classical time series decomposition, statistics, multivariate geometry, dynamical systems and signal processing. SSA decomposes time series into a sum of components (ETs), with each component representing a lower smoothing, using several SVD (Singular Value Decompositions). It is a powerful filtering process used in many fields of research (climatology, biomedical, aerospace, etc), where high quality forecasting and smoothin
The Trend Professor is a moving average based indicator designed for the purpose of helping the community of traders to analyse the price trend. The indicator will be displayed in the main chart as it is indicated on the screenshot section. How it works The indicator has lines of moving averages and colored histograms to depict the direction of the trend. There will be a fast signal line colored blue/yellow/red at some points. The red/yellow colored lines stands for bearish trend/signal while th
hint: my basic indicators are used like that KingLevel combind with KingSequence will provides basic insights of the price action of the markets and KingSequenceSgn is just for the convienent for watching. And plus with Forex Trading mentor subsccription I will assist you to win the market at first later if it's great will be upgraded to King Forex trading mentor. Introducing the K-Level Indicator: A Powerful Tool for Unveiling Hidden Trading Opportunities In the dynamic world of trading, i
XFlow показывает расширяющийся ценовой канал помогающий определять тренд и моменты его разворота. Используется также при сопровождении сделок для установки тейк-профит/стоп-лосс и усреднений. Практически не имеет параметров и очень прост в использовании - просто укажите важный для вас момент истории и индикатор рассчитает ценовой канал. ОТОБРАЖАЕМЫЕ ЛИНИИ ROTATE - толстая сплошная линия. Центр общего вращения цены. Цена делает широкие циклические движения вокруг линии ROTATE. Положение цены око
The Trend Analysis Indicator is an innovative tool designed for traders and investors who seek to navigate the complexities of the financial markets with greater precision and insight. This powerful indicator is engineered to adeptly identify whether a market is trending or not, offering users a vital edge in their trading strategy. Key Features: Accurate Trend Detection : The core functionality of the Trend Analysis Indicator lies in its ability to accurately detect market trends. It analyzes p
Neon Bot EA
Aleksandr Ivanov
5 (1)
Считается, что валютный рынок большую часть времени является флэтовым. Поэтому Neon Bot был разработан, опираясь на этот принцип, а именно на логику возврата цены к среднему значению с фильтрацией входов по пользовательскому индикатору. Советник использует стратегию мартингейла, поэтому стоп-лосс выставляется отдельно для каждой позиции, а количество ордеров строго ограничено. Не нарушайте рекомендуемый ММ, чтобы избежать большой просадки. Сигналы:   https://www.mql5.com/ru/users/samivanov/sell
Please contact me at telegram  https://t.me/smartforex7 After purchasing SmartForex Indicator then Use This Indicator...................... SMART EXIT PROFIT LINE Indicator is very Helpful with SmartForex Indicator ........................................ SMART EXIT PROFIT LINE Indicator Attach with SmartForex Indicator after then Red Line Show Exit buy Profit , Green Line show Exit Sell Profit................
FREE
Market Pulse EA
Evgenii Golovanets
5 (2)
Market Pulse is a unique author's algorithm that combines a simple strategy for breakout levels, combined with a multi-level system of filters and modules.  If you noticed that 90% of authors in MQL have real monitoring of their experts is rarely more than $100-$500. But in strategy tester, their EAs bring millions of dollars in profit. However, nobody asks why they sell these EAs, if they can become a millionaire in one year. I offer you a different approach to forex trading, a realistic profes
PowerXXX
Marco Fornero Monia
PowerXXX measures the power of the current candlestick and displays it in numerical format and colors. The indicator can cover multiple timeframes and can be placed on the main chart or on the charts of the underlying indicators. The number of timeframes is selectable, as well as the color levels according to the power expressed. In the latest version, the power can be expressed as a function of the opening of the candle itself or as a function of the opening of the total candles before. There
Этот индикатор представляет собой идеальный индикатор волнового автоматического анализа для практической торговли! Стандартизированное определение диапазона больше не является волной для разных людей, и рисунок антропогенных помех устранен, что играет ключевую роль в строгом анализе подхода. =>Increase the choice of international style mode, (red fall green rise style)             На данный момент при покупке со скидкой!   Содержание индекса: 1.         Базовая волна:   Сначала мы нашли
Pyro Trend - это новый продукт, который позволяет идентифицировать текущую рыночную фазу (восходящий тренд, нисходящий тренд или флет). Индикатор применим на любых данных и периодах. Середина трендовой волны, так же как и грани, это места особого накала и поведения рынка, при написании индикатора осуществлялась попытка реализовать именно нахождение середины. Pyro Trend - трендовый индикатор, использующий оригинальный алгоритм вычислений. Данный индикатор раскрашивает стрелки в разные цвета в
Drawing Pack
John Louis Fernando Diamante
4 (1)
This indicator provides several drawing tools to assist in various methods of chart analysis. The drawings will keep their proportions (according to their handle trendline) across different chart scales, update in real time, and multiple drawings are supported. # Drawing Option Description  1 Grid box draggable boxed grid, user defines rows x colums, diagonal ray option  2 Grid partial or fullscreen grid, sized by handle line  3 Grid flex a diagonal grid, sized and sloped by handle line
NNFX Algo
AHMED ZABIR SAZOL
This  Expert adviser developed on Prop Trader VP( Patrick Victor) From No Nonsense Fx.  It is an automated trading system that uses 100% technical indicators with very complex settings and some hidden Mathematical calculations to open and close trades. Trade different times for each day. It doesn't use the grid, martingale, or other dangerous money management methods. It has a lot of Entry and Exit Methods, and Every Trade is Stop loss protected. Download Preset file  Features: Every trade is
Простой алгоритм индикатора с высочайшей точностью генерирует входные сигналы с помощью пересечения линий. Стратегия для торговли по тренду, фильтрация и все необходимые функции, встроенные в один инструмент! Принцип работы индикатора заключается в том, чтобы при размещении на график автоматически определять текущее состояние рынка, анализировать исторические данные, на основании исторических данных и выводить на экран трейдеру указания к дальнейшим действиям. Система сама показывает в виде пере
Impulse fractals indicator - is counter-trend oriented complex market fractal pattern.  Market creates bull/bear impulse, trend starts, fractals on impulsed wave are an agressive pullback signals. Buy arrow is plotted when market is bearish and it's impulse showed up-side fractal, and sell arrow is plotted when market is bullish and it's impulse showed dn-side fractal. Main indicator's adjustable inputs : impulsePeriod - main period of impulse histogram  filterPeriod  - smoothes impulse accordi
С помощью этого торгового инструмента вы можете одновременно сканировать 15 рынков. Представляем новый торговый индикатор 2024: ️ Мультивалютный стохастик на нескольких таймфреймах. Есть как минимум две причины, по которым я создал этот торговый инструмент: Во-первых, мне надоело наблюдать только за одним рынком. Во-вторых, я не хочу упустить момент входа на другой рынок. Вот почему я хочу одновременно знать и другие рыночные условия. По этой причине мне нужен сканер, который сможе
Работа бота Stable Pulse отображена в виде некольких ключевых ммоментов, что можно увидеть на скриншотах. Данная разработка это скальперская система. Вы можете бесплатно загрузить и протестировать бот таким образом самостоятельно убедившись в его возможностях. Бот можно тестировать на разных валютных парах и разных периодах. Главное установите настройки тестера так как показано на скриншоте, для корректного тестирования. Торговать нужно на таймфреймах M1-M15. Эксперт создан для торговли на любо
Данный индикатор непрерывно изменяет цвет окантовок и тел свечей, а также цвет объёмов в реальном времени. Индикатор прост в применение. Палитра цветов разнообразна. Данный продукт является графическим решением поэтому сложно описывать что он делает текстом, это легче увидеть скачав его, к тому же продукт бесплатный. Индикатор подойдёт блогерам, которые хотят создать красивую картинку графика для видеомонтажа или трейдерам которые хотят сделать свой график живым, меняющим цвет в реальном времен
FREE
Moving Pivot Average - индикатор технического анализа для определения общего рыночного тренда на разных таймфреймах. Индикатор Price Pivot Indicator представляет собой среднее значение максимальных и минимальных цен, а также цен закрытия предыдущего торгового дня. Индикатор отрисовывает линию, указывающую на область пивота (разворота) на свечном графике. Индикатор лучше всего использовать на младших таймфмреймах, например 15 минут и 5 минут (рекомендуется). Если у вас есть вопросы о работе индик
SmartScalper
Oleg Borisov
3.67 (3)
Простая в использовании торговая система SmartScalper вырабатывает сигналы: BUY SELL close BUY close SEEL SmartScalper работает на таймфрейме М15 и оптимизирован для валютных пар GBPUSD, XAUUSD, GBPJPY, EURJPY, EURUSD. Для торговли разработаны 12 различных наборов торговых алгоритмов ( по 6 для сделок buy и sell), которые выбираются трейдером оперативно с помощью кнопок, расположенных в окне индикатора, или задаются в окне ввода данных. Эффективность выбранных трейдером торговых алгоритмов оцени
CyberVision EA is a technology I developed during my undergraduate studies. CyberVision EA is not just an advisor, it is a high-speed computing machine that can generate historical data. CyberVision EA is not just an EA, it is a high-speed computing machine that works with recurrent neural network (RNN) and generative adversarial network (GAN), and my EA also uses data quantization. Live Signal High:  https://www.mql5.com/ru/signals/2221931 Live Signal:  https://www.mql5.com/en/signals/2218278 C
Ska ZigZag BuySell
NKATEKO VUKOSI LEROY MASANGO
Ska ZigZag BuySell indicator determines the overbought and oversold regions within a trend. The indicator determines the overbought region by the candlestick high and the oversold region by the candlestick low. This indicator only gives signals with arrow and audible alerts each and every time when a new candlestick appear. To utilize the full strategy i recommend using "Ska ZigZag BuySell" together with "Ska ZigZag Line". The Ska ZigZag Line indicator is available for free. NOTE: Indicator is h
Clear trend filter   This is a filter-trend indicator.  From the settings you can select to use more filter or less. The very interesting part of the indicator comes out using with all the filter. In this way you can follow the trend easily even when the market is without a strong trend, but is instead more flat. I personally use it on 1 minutue timeframe with  MORE FILTER (you can select it from the input setting) in order to have an overlook of trend in the market.   Added: - Sound Notificatio
KT Forex Trend Rider uses a trend following algorithm developed specifically for the Forex market to provide reliable buy & sell signals across the major currency pairs. It works best on major FX pairs and all time-frames. Features It comes with a Multi-Timeframe scanner that can search for upcoming signals across all the time-frames. It comes with four preset profiles to facilitate trading for scalpers, tick-trend, swing, and trend traders. It marks the potential reversal points in the mark
Индикатор Ruby Trend рассчитывает уровни насыщенности ценового графика. Сигнал на выход из области перепродажи является сигналом на покупку. Сигнал на выход из области перекупки является сигналом на продажу. Обычно нужно задать относительные величины для уровня перекупленности и перепроданности Bottom и Top - для данного индикатора.  Чаще всего хороший тренд виден на ценовом графике визуально. Но опытный трейдер перед входом должен четко понимать текущую расстановку сил на рынке. И индикатор
CSS " currency strength slope "  is a a multi currency strength indicator that use Forex major currencies, EUR, USD, CAD, AUD, NZD, JPY, CHF, GBP. it use 28 major pairs to calculate the power of every currency using a based moving averages algorithm : you will see volatility clearly between currencies. input: MA Fast & Slow. - MA Mode : simple, exponential, smoothed, linear weighted - Applied Price : close, open, high, low, median price, typical price, weighted price.
Market Chopper Indicator - is the manual system for market scalping. Indicator uses most accurate points to enter, when current trend has lost it's power and new one starts. Indicator shows : Enter points(buy/sell arrows), Exit points(Stoploss/Takeprofit arrows). Indicator makes market analysis and adapts to any market, any timeframe showing most relevant strategy for exact conditions. Main Indicator's Features Signals are NOT repaint, late or disappear; Every signal comes at the open of new bar
Это профессиональный индикатор Trend Sim.  Интеллектуальный алгоритм индикатора Trend Sim с точностью определяет тренд, отфильтровывает рыночный шум и генерирует входные сигналы и уровни выхода. Функции с расширенными правилами статистического расчета улучшают общую производительность этого индикатора.  Индикатор отображает сигналы в простой и доступной форме в виде стрелок (когда покупать и когда продавать). Знание о точке входа каждой из валют очень важно для каждого трейдера, торгующего на
This strategy is characterized by simplicity and rudeness. Simple things, it is widely applicable, durable, strong stability. This is an advantage to having a certain amount of money, because the demand for big money is stable. The need for small capital is efficiency. Efficiency requires Intensive farming. There are a lot of things you can refine to increase your efficiency. But I’m not sure I can build a sophisticated EA money machine. Efficiency and stability are a dialectical relationship. H
Trend Market EA  это полностью автоматическая система. В данный момент советник продаётся по акции по цене 499 $ вместо 999 $ Trend Market EA  - работает по направлению тренда на старшем таймфрейме. Сигналом на открытие ордера служит сигнал индикатора HMA на графике текущего таймфрейма, на котором установлен советник, Если сигнал совпадает с направлением тренда на старшем таймфрейме, то советник открывает рыночный ордер в направлении тренда. Если же тейкпрофит не достигут, а тренд разворачивает
С этим продуктом покупают
TrendMaestro
Stefano Frisetti
5 (2)
note: this indicator is for METATRADER4, if you want the version for METATRADER5 this is the link:  https://www.mql5.com/it/market/product/108106 TRENDMAESTRO ver 2.4 TRENDMAESTRO recognizes a new TREND in the bud, he never makes mistakes. The certainty of identifying a new TREND is priceless. DESCRIPTION TRENDMAESTRO identifies a new TREND in the bud, this indicator examines the volatility, volumes and momentum to identify the moment in which there is an explosion of one or more of these data a
Представляем индикатор астрономии для MT4: Ваш незаменимый небесный товарищ в торговле Готовы ли вы поднять свой опыт торговли до небесных высот? Не ищите дальше, чем наш революционный индикатор астрономии для MT4. Этот инновационный инструмент выходит за рамки традиционных торговых индикаторов, используя сложные алгоритмы для предоставления вам беспрецедентных астрономических понимания и точных расчетов. Вселенская информация под рукой: Взгляните на обширную панель, раскрывающую сокровищницу ас
WARNING: PRICE IS SUBJECT TO RISE AT ANY TIME. GET YOUR COPY TODAY TO AVOID MORE COST! Dear Traders I am so glad to introduce to you my other tool called the Forex Sniper Entries Indicator. This tool is designed to help serious traders and investors capture big moves in the currency price movements. The philosophy behind this tool is all about winning big and riding the price movement from its beginning until the maximum point. We want to capture those big moves in both down and up markets as mu
Способ применения Pair Trading Station Рекомендуется использовать Pair Trading Station на таймфрейме H1 с любой валютной парой. Чтобы получить сигналы на покупку и продажу, следуйте указанным ниже инструкциям по применению Pair Trading Station в терминале MetaTrader. При загрузке Pair Trading Station на график индикатор оценит доступные исторические данные на вашей платформе MetaTrader для каждой валютной пары. В самой начале на графике отобразятся исторические данные, доступные для каждой валют
Black series MT4 - Индикатор предназначен для торговли на бинарных опционах с Tаймфреймом М1-M5-M15 Мультивалютный (Работает на криптовалюте и на валютных парах) Сигнал появляется при открытии свечи До 90% верных сигналов Полностью отсутствует перерисовка сигналов  Можно использовать с другими индикаторами. Хороший для скальпинга! В Настройках есть: -Методы работы индикатора -И Аллерт Цвет стрелок Красный сигнал вниз Синий сигнал вверх Так же смотрите видео как работает индикатор и появляются си
MT My Way
Issara Seeboonrueang
Best strategy,  Easy trade ,  Support of version update in the future MT My Way: develop for new traders with no experience It is a very simple trade. Open the order when there is signal and close the order when there is exit or found the next opposite signal. For experienced traders, It will be very easy to trade. TRADE: Forex TIME FRAME:  All Time Frame SYMBOL PAIR: All Symbol SETTINGS: CALCULATE BARS: Value or bars used must be large enough to calculate the formula. Fo
Это, пожалуй, самый полный индикатор автоматического распознавания гармонического ценообразования, который вы можете найти для платформы MetaTrader. Он обнаруживает 19 различных паттернов, воспринимает проекции Фибоначчи так же серьезно, как и вы, отображает зону потенциального разворота (PRZ) и находит подходящие уровни стоп-лосс и тейк-профит. [ Руководство по установке | Руководство по обновлению | Устранение неполадок | FAQ | Все продукты ] Он обнаруживает 19 различных гармонических цен
Техническая торговая система "BB Reversal Arrows" разработана с целью прогнозирования реверсных точек для принятия торговых решений. Текущая рыночная ситуация анализируется индикатором и структурируется под несколько критериев:  Ожидание разворотных моментов, потенциальные разворотные точки, сигналы покупки и продажи. Индикатор не содержит лишнюю информацию, имеет визуальный понятный интерфейс, позволяя трейдерам принимать обоснованные решения. Все стрелки появляются по закрытию свечи, без
Indicator : RealValueIndicator Description : RealValueIndicator is a powerful tool designed specifically for trading on the EURUSD pair. This indicator analyzes all EUR and USD pairs, calculates their real currency strength values, and displays them as a single realistic value to give you a head start on price. This indicator will tell you moves before they happen if you use it right. RealValueIndicator allows you to get a quick and accurate overview of the EURUSD currency pair tops and bottoms,
Connect Indicator
Sukunthakan Ngernbamrung
Connect Indicator is a tool used for connecting indicators between the MQL market and MT4. The connected indicators are made by our group and can be used for other applications, such as sending messages to the Line application or Telegram application. If you have any questions, please don't hesitate to ask us to receive support. Function and indicator buffer Buffer one is the high price of the previous candle. Buffer two is the high price of the previous candle. Usage To connect indicators to fu
Представляем удивительный форекс-индикатор "Miraculous": раскройте силу точного трейдинга Вы устали от бесконечного поиска лучшего форекс-индикатора, который действительно доставляет исключительные результаты на всех таймфреймах? Не ищите дальше! Представляем вам форекс-индикатор "Miraculous", который пришел, чтобы изменить ваш опыт трейдинга и поднять ваши прибыли на новый уровень. Основанный на передовых технологиях и годам тщательной разработки, форекс-индикатор "Miraculous" является вершиной
Smart Ai Levels  Accumulation & Distribution indicator Smart Ai Levels are Ai controlled indicator which is based on Wyckoff Price cycle theory . It automatically scans the Accumulation & Distribution phases on chart and Ai draws the possible areas before Mark up and Mark down which acts as hot zones and can be traded with confirmation to catch those big price movements . It's a great tool for both Reversal and Breakout Trades suitable to all Trading Styles such as Scalping - Intraday - Swing 
Weddell Pro хороший торговый инструмент который подойдет как для новичка так и для опытного трейдера. С ним можно работать как отдельно так и совмещать с другими стратегиями и индикаторами Настроен для валютных пар несколько раз тестировался на криптовалюте но высокого результата не показал Валютные пары USD/EUR AUD/CAD GBP/USD Очень хорошо себя тут показал Процент правильных сделок выше 68% что не делает его идеальным и плохим Не рисует и не пропадает Красная стрелка показывает сделку на низ  С
Weis Wave with Alert
Trade The Volume Waves Single Member P.C.
4.79 (19)
Индикатор волны Вайса основан на теории Ричарда Вайкоффа. Работает на всех таймфреймах, флетовых и тиковых графиках. Может применяться к любому рынку. Индикатор добавляет объемы соответствующих ценовых волн и рисует кумулятивную гистограмму. Каждая ценовая волна движется в определенном направлении вверх или вниз, пока не изменится. Чтобы индикаторная волна развернулась, цена должна превышать количество точек (пипсы * 10), установленных в параметрах индикатора. Поэтому последняя волна перерисовыв
Powerfull Scalper
Ellan Dirgantara Tholkhah
This product is optimally used for scalping. It is a trend following system, it understands that the trend is your friend. It takes advantage of the buying/selling after the pullback in continuation of the current trend wave.  It works by analyzing dynamic support and resistance, and is based on the Ichimoku Indicator variables which is know to be the most consistent & holistic indicator out there.  Settings can also be adjusted to suite the market conditions. -> can be adjusted for longer term
Ultimate Sniper Dashboard
Hispraise Chinedum Abraham
4.84 (25)
Скидка $299! Цены могут вырасти в будущем! Читайте описание ниже! Лучшая система ввода для Ultimate Sniper Dashboard: ПРЕДЕЛЬНЫЕ ДИНАМИЧЕСКИЕ УРОВНИ. (Пожалуйста, проверьте мои продукты) Ultimate Sniper Dashboard работает ТОЛЬКО на реальных рынках из-за ограничений мультивалютного тестирования MT4. Представляем вам Ultimate-Sniper Dashboard! Наша самая лучшая панель, которая содержит HA-Sniper, MA-Sniper и множество специальных режимов. Ultimate Sniper Dashboard - это абсолютный зверь!
The "Easy Ichimoku Wave Meter" indicator is a basic tool to automatically determine Waves according to Ichimoku! The indicator gives the possibility to simultaneously apply the Wave Theory, Time Theory and Target Price Theory according to the "Little Ichimoku" strategy developed by Sense Hosoda on the MT4 platform.  The use of this tool allows not only novice traders to instantly (fully automatic) determine the waves and their rapid interpretation, it also allows to automatically measure the p
The Volume by Price Indicator for MetaTrader 4 features Volume Profile and Market Profile TPO (Time Price Opportunity). Get valuable insights out of currencies, equities and commodities data. Gain an edge trading financial markets. Volume and TPO histogram bar and line charts. Volume Footprint charts. TPO letter and block marker charts including split structures. Versatile segmentation and compositing methods. Static, dynamic and flexible ranges with relative and/or absolute visualizations. Lay
PZ Day Trading
PZ TRADING SLU
3.67 (3)
Этот индикатор обнаруживает разворот цены зигзагообразно, используя только анализ ценового действия и канал Дончиана. Он был специально разработан для краткосрочной торговли, без перекраски или перекраски вообще. Это фантастический инструмент для проницательных трейдеров, стремящихся увеличить сроки своих операций. [ Руководство по установке | Руководство по обновлению | Устранение неполадок | FAQ | Все продукты ] Удивительно легко торговать Это обеспечивает ценность на каждом таймфрейме Ре
DESCRIPTION The CHAOS INDICATOR has been developed to be used for the TRADING STRATEGY OF CHAOS, as described in the book. The book is in italian language only and can be obtained only on my website indicated below. DATAS COLLECTED AND SHOWN ON GRAPHS The CHAOS INDICATOR apply easily to any graph and any asset, and it is a TRADING FACILITATOR, as it identify immediately the following items on any graph: - The GP (= RIGHT PRICE) i.e. the price to which the asset should be attracted within 24
Данный индикатор основан на математике великого трейдера W.D.Ganna.  С помощью его мы с легкостью найдете сильные уровни анализируя свинг для поиска оптимальной точки входа. Индикатор работает на всех инструментах и всех тайм фреймах. Индикатор полностью ручной и оснащен кнопками управления. Все что вам нужно это нажать на кнопку NEW, появится отрезок, данный отрезок вы размещаете на любое движение, свинг или даже 1 свечу, которую хотите проанализировать. Разместив отрезок нажимаете кнопку ОК. П
Intro to APAMI, PROfessional edition Trace exactly how far prices trend between two price levels with fractional pip precision, while qualifying price movement between the same price levels. Completely automate when trends change direction and volatility, without any lag .  This is possible because the Accurate Price Action Measurement Indicator (APAMI) actually does what no other indicator can:  measure price distance between two points and simultaneously qualify the price action that occurs
Please send me Direct message on MQL5 CHAT after purchasing the Indicator for Training and Installation Support There are some additional files that is important to use with the Indicator . So be sure to contact me after purchasing the Indicator So that I can add you for training and support . If you find any difficulty with installation then send me Direct message here So that I can connect with you via Anydesk or Teamview for the product installation. " Smart Order Block Indicator " to find
Gold Channel is a volatility-based indicator, developed with a specific timing algorithm for the XAUUSD pair, which consists of finding possible corrections in the market. This indicator shows two outer lines, an inner line (retracement line) and an arrow sign, where the theory of the channel is to help identify overbought and oversold conditions in the market. The market price will generally fall between the boundaries of the channel. If prices touch or move outside the channel it is a tra
Свинг-трейдинг - это первый индикатор, предназначенный для обнаружения колебаний в направлении тренда и возможных разворотов. Он использует базовый подход свинговой торговли, широко описанный в торговой литературе. Индикатор изучает несколько векторов цен и времени для отслеживания направления совокупного тренда и выявляет ситуации, когда рынок перепродан или перекуплен и готов к исправлению. [ Руководство по установке | Руководство по обновлению | Устранение неполадок | FAQ | Все продукты ]
Binary FX Ideal
Yaroslav Varankin
3.5 (2)
отличный инструмент для любого трейдера  как для форекс так и для бинарных опционов подойдет любому трейдеру ничего настраивать не нужно все отточено времинем и опытом инструмен совместил в себе 5 индикаторов и 3 собственных стратегии отлично работает на во время флета та и в тренде  Он указывает на разворот тренда в самом его начяли хорошо работает по тренде Рекомендации по торговле Сигнал формулируется на текущей свечи Входить в сделку следует на следующей Возможен пересчет (редко)
Данный индикатор находит и отрисовывает зоны , так сказать места силы, где цена будет разворачиваться. Индикатор может работать на любом графике, любом инструменте, любом таймфрейме. Индикатор имеет два режима. Индикатор оснащен панелью управления с кнопками для удобства и разбит на два режима. Ручной и авто. Ручной режим: Для работы с ручным режимом необходимо нажать кнопку NEW, появится отрезок. Данный отрезок натягиваете на движение и нажимаете кнопку LVL. Отрисовывается уровень. Авто режим:
Данный индикатор предназначен для работы на любом ТФ. Программа на основе авторских алгоритмов и математике W.D.Ganna позволяет рассчитать целевые уровни движения цены по трем точкам с высочайшей степенью достоверности. Является прекрасным инструментом для биржевой торговли. Индикатор оснащен тремя кнопками NEW - вызвать треугольник для расчета. DEL - удалить выбранный треугольник. DELS - полностью удалить все построения. Вероятность достижения целей более 80%. Так же индикатор оснащен сигналом
Индикатор Full STO (включает в себя все версии трех индикаторов STO: Premium, Gold, Silver) - STABLE TRADE OPTION предназначен для автоматической торговли бинарными опционами.  ЧИТАЕМ ВНИМАТЕЛЬНО!!!!! ВАЖНО В одном терминале создаем два шаблона с разными экспирациями, шаблон на 18:01, 18:02 с экспирацией от 1 до 15 минут и шаблон 22:00 c экспирацией от 10 до 20 минут. Winrate: 71% over the past 5 years Money management: 0.3% from the deposit Данная версия индикатора настроена только на
The breakout algorithm is a technique based on price, price features, to shape a breakout strategy. The strategy in this indicator will not be redrawn (none-repaint indicator), it is suitable for short or long term traders In the screenshot is the EURUSD pair, these currency pairs, commodities or stocks, it have similar strength *Non-Repainting (not redrawn) *For Metatrader4 Only *Great For Scalping *Great For Swing Trading *Arrow Entry, Green is Long, Red is Short *Works On Any Timeframe *Work
Другие продукты этого автора
Tick Sound
Jean Francois Le Bas
4 (2)
Tick Sound will play a different sound each time a tick is triggered. When the tick is higher than the previous one, an "UP" sound is triggered When the tick is lower than the previous one, a "DN" sound is triggered The sound i chose is a Sheppard Tone : it's an audio effect that simulates and endless ramping sound up or down which is perfect for this task. There are three main parameters for Tick Sound Ask : will play a sound each time a new Ask value is output. Bid : will play a sound each t
This indicator weigth the actual close price with the high and the low of past values then it is computed by a simple 1 lag IIR filter before being processed by a final logarithmic algorithm to order the data. This Indicator is perfect to find precise reversals. Rules of Trading :  1) Be sure that the yellow line is in overbought/oversold (above +5 or under -5) The higher/lower, the better. 2) Wait for the gray line to touch the yellow line then separate from it : this is the signal. 3) If t
Trend Range detector
Jean Francois Le Bas
1 (1)
Trend/Range Detector is an indicator that allows to determine with accuracy if the future price will range or trend in the following bars. The Indicator is drawn in a separate window where two lines are displayed : the crossing of the main signal (blue) with a moving average (orange) will determine if each zone is a trending or ranging market. Parameters : period : the number of bars to look back (default = 20) type : type of the main signal (trend or range) (default = RangeDetector) Moving av
Oscillators are, by nature, exemple of any trend information. This indicator is "trended", meaning is it reacting to trend as well: if the oscillator is in the UPPER part of the window, then trade only BUYs. if the oscillator is in the LOWER part of the window, then trade only SELLs; You can also choose to start trading when the trend begins (see Alerts) Parameter description: lookbackOsc : Period of the yellow line (the digital oscillator). (default = 14) DSFast :  Fast Period of the oscillat
SSA stands for 'Singular Spectrum Analysis'. It combines elements of classical time series decomposition, statistics, multivariate geometry, dynamical systems and signal processing. SSA decomposes time series into a sum of components (ETs), with each component representing a lower smoothing, using several SVD (Singular Value Decompositions). It is a powerful filtering process used in many fields of research (climatology, biomedical, aerospace, etc), where high quality forecasting and smoothin
TenFold
Jean Francois Le Bas
4 (1)
9 out of 10 copies left at $100 after that price will double ($200) ! so hurry This indicator is a mean-reversal type of indicator. Meaning it will not follow a trend but rather make profit from a change in price direction, when the price extends from it mean, but to come back to it later on. This indicator is 100% NON REPAINT and will not redraw its arrows once they appear. Each arrow is drawn at the close of the candle, not during the life of the candle. No parameters, only alert parameters.
Focus
Jean Francois Le Bas
This indicator is profitable on 28/28 forex pairs on H1 timeframe WITHOUT SPREAD. You need to substract the spread to the profit amounts shown The code is robust with a high chance to continue being profitable no matter how the price action evolves.  But profitable on 28 pairs doesn't mean you should trade all the pairs all the time:  On less popular ones, liquidity is low, so spread will usually be high and will eat all the profits. You have to be careful and trade only when the spread is low
TrueRSI
Jean Francois Le Bas
Built-in RSI indicator has an error in the algorithm. I spotted the error while working on a modified RSI where i needed the original algorithm with special input I started with the official formula and were having different curves from the built-in indicator. after thinking I had made a mistake in the algorithm, I realized the orginal indicator is wrong by looking at the code. So here is the real RSI, computed from the original formula, so you know it's the real indicator.
Early Trends finds trends early, when price is still squeezed inside price action, which is the best time to spot a trend. When the price action makes higher highs or lower lows within the first bars back, while no HH or LL has been triggered on higher period bars back, then a trend is potentially beginning You can also take signals only in the direction of the trend, with the trend filter. Many parameters : Number of Bars Displayed Number of Bars Back HHLL Number of Bars Back Multiplier Perio
"TOP G ARROWS"    shows price reversal points designed for scalping and intraday trading. Contains internal reversal filters (ATR, HHLL, RSI). Can be used on all time frames and trading instruments. Can be used on M1, M5, M15 time frames for scalping or M30, H1, H4 for intraday trading, Recommended for M30 and H1. The arrows are built on candle close (appears on previous bar at the open of the new candle)
TruRange
Jean Francois Le Bas
TruRange is a Next-Level trend and range detection created from algorithms based on   price action. No other indicator apart from ATR is used in the computing of the main line indicator It separates Trending and Ranging market conditions without any lag. It's good to separate mean reverting strategies from trending/breakout strategies. Settings : Bars : number of bars to compute Sensitivity : a lower value will have longer range periods while a higer value will have more smaller ranging peri
This indicator cuts right through the price, in a straight line 100% non repaint, you get a new value at the opening of each new bar It is perfect for mean reversal strategies : open far from the line and close when the price touches the line It works really well for mean reverting pairs specially (CHF, NZD). It has absolutely no lag when there is a sudden move up or down and follows trend exactly ! This indicator should be a must have tool in the toolbox of every trader
LLAMA stands for Lag-Less Adaptive Moving Average it is a state of the art moving average that is very close to the price, specially those sudden moves that put every typical moving average away from the price. This finding comes from the latest research in adaptive moving averages, with a lag close to 0 This MA keeps a very high smoothing ability while keeping a lag almost null.
LLAMA Macd
Jean Francois Le Bas
LLAMA MACD has been made from the same formula that creates regular MACD. The only difference is that both smoothing alogrithms has been replaced by the LLAMA (LagLess Adaptive Moving Average) Main parameters are the same : 2) LLAMA Period (Fast) 1) LLAMA Period (Slow) 3) LLAMA Signal   Period and the LLAMA Parameters are the same as with the single AMA: 1) ActiveBar : computes last bar as well in Realtime (higher CPU usage) 2) ATRPeriod 3) ATRDistMul =: Multiplier1 (Detect) 4) ATRDistMul2 :
LLAMA BB has been made from the same formula that creates regular BB.  The only difference is that the smoothing alogrithms have been replaced by the LLAMA (LagLess Adaptive Moving Average) Main parameters are the same : 2) LLAMA Period 1) STDDEV Period 3) STDDEV Multiplier and the LLAMA Parameters are the same as with the single AMA: 1) ActiveBar : computes last bar as well in Realtime (higher CPU usage) 2) ATRPeriod 3) ATRDistMul =: Multiplier1 (Detect) 4) ATRDistMul
Фильтр:
Нет отзывов
Ответ на отзыв