 MetaTrader 5
 Эксперты
 Индикаторы
 Библиотеки
 Утилиты
 Виджеты
 Правила
Смотри обучающее видео по маркету на YouTube
Как купить торгового робота или индикатор
Запусти робота на
виртуальном хостинге
виртуальном хостинге
Протестируй индикатор/робота перед покупкой
Хочешь зарабатывать в Маркете?
Как подать продукт, чтобы его покупали
Новые торговые роботы и индикаторы для MetaTrader 5 - 526
 Используйте торговые роботы и индикаторы, чтобы увеличить доходность от торговли на форексе. С помощью торговых роботов вы сможете автоматизировать процесс открытия и закрытия сделок, а индикаторы помогут более точно предсказывать поведение рынка в будущем.
На странице собран каталог приложений для MetaTrader 5.
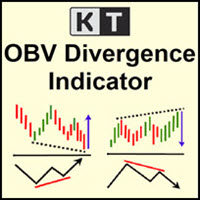
KT OBV Divergence показывает регулярные и скрытые дивергенции, возникающие между ценой и индикатором OBV (On Balance Volume).
Особенности
Несимметричные дивергенции отфильтрованы для повышения точности и снижения визуального шума. Поддерживает стратегии как на разворот тренда, так и на его продолжение. Полностью совместим и готов для встраивания в советник (Expert Advisor). Может использоваться как для входа, так и для выхода из позиции. Доступны все типы оповещений MetaTrader.
Что такое дивер
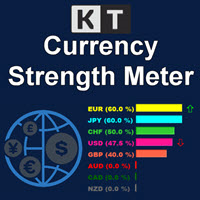
KT Currency Strength Meter измеряет силу и слабость отдельных валют с помощью агрегированной математической формулы, применяемой к основным валютным парам. Сила рассчитывается на основе бычьих и медвежьих свечей за фиксированный период. После заполнения данных об активности валют, алгоритм сортирует самые сильные и слабые валюты и обновляет порядок их расположения в режиме реального времени на основе поступающих данных.
Преимущества
Улучшите свою торговую стратегию, исключив сигналы, которые пр
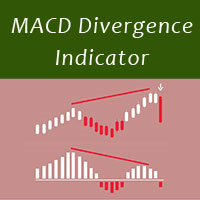
MACD divergence indicator finds divergences between price chart and MACD indicator and informs you with alerts (popup, mobile notification or email) . Its main use is to find trend reversals in the chart. Always use the divergence indicators with other technical assets like support resistance zones, candlestick patterns and price action to have a higher possibility to find trend reversals. Three confirmation type for MACD divergences: MACD line cross zero level Price returns to previous H/L Crea
FREE

Stargogs Spike Catcher EA V3 !!!PLEASE MESSAGE ME AFTER PURCHASING THE EA I WILL HELP AND SET IT UP FOR YOU OR I'LL SEND YOU THE RIGHT SETFILES!!! !!! IMPORTANT THIS ROBOT WON'T WORK OR MAKE PROFIT WITH DEFAULT SETTINGS!!! With The Right Settings so that you can make your daily or monthly Income. This Is the best version so far. With the right Parameters you won't fail. I will also show you the results. In Version 3.0 you can Switch on/off to Choose on which indices to catch spikes on Boom and
Key Features: Multi-Target Volatility: Configure multiple Take Profit and Stop Loss levels based on real-time market volatility. Fully Customizable: Set specific volatility multipliers (e.g., 4x for Stop, 10x for Take) using any look-back period (e.g., previous 20 bars on a 2-minute chart). Clear Visuals: Assign unique names to each level to be displayed directly on your symbol's chart for easy monitoring. Consistency: Every level calculated is synchronized with the volatility of your chosen per
FREE

Volume profile indicator that tells you which levels price is likely to reach today. Daily profiles with POC, VAH and VAL, naked POCs and a drag box for any range, and every level labelled with how often price reached a level at that distance on your own chart. What you see on the chart A profile for every day on M1 to H1 charts, with the value area in a stronger colour. Yesterday's POC, VAH and VAL across today, each with its odds for today, or "reached" once price gets there. Naked POCs: earli

The market eagle - it is a Secure Automated Software for trade Forex market and indices.This EA takes perspective of the market looking like an eagle. From a distance, observe the entire market amphitheater detecting the entry points and the best points to implement the algorithm based on the set that we indicate in the input.This system allows us to use the key points of the market to adapt them to our algorithms, trend and countertrend. The system uses multiple lot depending on the algorithm
MACD Divergence Scanner is a multi-timeframe and multi-symbol dashboard and alert that checks all timeframes and symbols to find regular and hidden divergences between price chart and MACD indicator. This divergence scanner is integrated with support and resistance zones so you can check the MACD divergences in the most important areas of the chart to find trend reversals in the price chart. Download demo version (works on M4,M6,M12,M20,H3,H8 timeframes of 20 symbols of Market Watch window)
Tick Chart Monitor with countdown tick volume and easy to change tick size without going back to main chart. This work with Tick Chart Generator , which are available for download from the MQL5 Market: Tick chart generator: https://www.mql5.com/en/market/product/79763 NOTE: Custom symbols on MT5 are not directly tradable. This is by Metatrader5 design. If you want to place trades directly on the custom symbol generated by this product, you will either need a trade panel that offers this functi
FREE
EA create custom Tick bar charts and provide real-time updates for MT5. This is an MT4 "offline" chart equivalent which is very simple to use. Generated Tick bar Chart compatible to MT5 indicator or template and perform your technical analysis with Multi timeframe analysis. The generator uses tick data to plot the historical tick chart for a particular setting and live ticks for plotting live charts. This method of calculation gives very accurate charts as no approximation is used. This EA creat
Tick imbalance bars (TIB), described in the book Advances in Financial Machine Learning (2018) by Marcos López de Prado. Indicator that show candlestick bars with an different sampling method than time fixed. Real time data is sourced to the indicator and it may be used as substitute of the default graph. Each bar is formed when a predefined tick balance is exceeded, showing in the graph the OHLC of this cluster of ticks. The input variable is the amount of ticks of each bar. The indicator may
FREE

Assistant for Reopen - советник, помогающий переустанавливать отложенные ордера. Многие брокеры принудительно устанавливают дату и время экспирации ордера на конец торговой сессии или на конец торгового дня. Поэтому трейдеру приходится каждый раз в начале новой торговой сессии восстанавливать все отложенные ордера в ручную. Assistant _ for _ Reopen освобождает трейдера от этой рутинной работы. Он контролирует экспирацию по времени истечения ордера и переустанавливает его, если трейдер сделал о
FREE
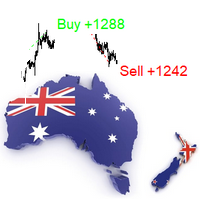
Индикатор является торговой системой для валютных пар AUDUSD или NZDUSD.
Индикатор разрабатывался для временных периодов: M15, M30.
При этом, возможно использовать его на других инструментах и временных периодах, после проведения тестирования.
"Kangaroo Forex" помогает определить направление сделки, показывает точки входа и имеет систему оповещений.
При движении цены в направлении сделки, отображается максимальная длина движения в пунктах.
Индикатор не перерисовывается, все действия происхо

Market Momentum Alerter Market Momentum Alerter will inform you about danger to operate in the market.
Imagine you see a very nice setup (Forex, Stocks, Indices) and you decide to place your trade...
And you finally lose your trade and don't understand what happened.
This can happen due to big operations in the market carried out by banks and big institutions.
These operations are invisible for most people.
Now with the Market Momentum Alerter you will be able to detect those operations...

show live chart spot All symbol binance If you want to get this product with a 99% discount, send a message to my Telegram admin and rent this product for 1 $ per month or 10 $ per year. Even if you do not like the way the chart is displayed, you can tell the admin in Telegram how to display it so that your own expert is ready. https://t.me/Bella_ciao1997 https://t.me/Binance_to_mql5

Only 5 copies of the EA at $30! Next price --> $45 This robot works on the basis of bowling band and has stepped entrances at safe points.
benefits:
Works on all instruments and time series,
It has excellent inputs for position management that can avoid a lot of risk.
Input settings:
Volume: Selects a fixed volume for the trade that uses its own risk management if it is zero.
Risk for all positions: The amount of risk for all positions in one direction, for exam

BEHOLDD!!!!!!!
Investogenie is now in the Market. The Profound Algorithm designed in investogenie helps in scalping in the quiet time at night with a Stop Loss. The Markets conditions help the EA to decide taking the entries and exits at the proper time. Backtests and results are evident of the strength of the product.
Live results will be updated soon.
RECOMMENDATION
PAIRS: All Currency pairs
TIMEFRAME: This is Designed on M5 only
Use the set file in comment 3 or DM me
LIVE MONITORING
Be sure to consult with me before buying.
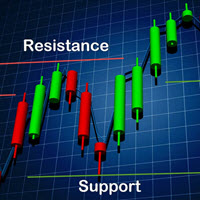
The robot trades based on support and resistance levels. You can use weekly and monthly times for less risk. More risk in daily and 4-hour times. Be sure to disable the robot at news times.Works on all currency pairs, indices, commodities and metals. Only observing the trade at the time of news will make this robot profitable. Automatic news management will be added in future versions.
benefits:
Works on all instruments and time series,
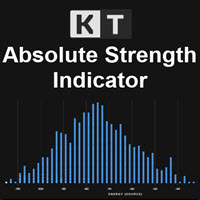
KT Absolute Strength measures and plots the absolute strength of the instrument's price action in a histogram form. It combines the moving average and histogram for a meaningful illustration. It supports two modes for the histogram calculation, i.e., it can be calculated using RSI and Stochastic both. However, for more dynamic analysis, RSI mode is always preferred.
Buy Entry
When the Absolute Strength histogram turns green and also it's higher than the previous red column.
Sell Entry
When th
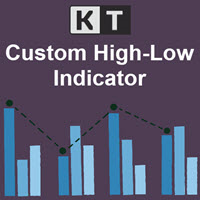
KT Custom High Low shows the most recent highs/lows by fetching the data points from multi-timeframes and then projecting them on a single chart. If two or more highs/lows are found at the same price, they are merged into a single level to declutter the charts.
Features
It is built with a sorting algorithm that declutters the charts by merging the duplicate values into a single value. Get Highs/Lows from multiple timeframes on a single chart without any fuss. Provide alerts when the current pri
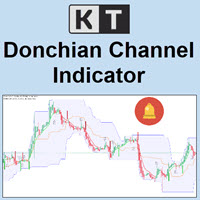
KT Donchian Channel is an advanced version of the famous Donchian channel first developed by Richard Donchian. It consists of three bands based on the moving average of last high and low prices. Upper Band: Highest price over last n period. Lower Band: Lowest price over last n period. Middle Band: The average of upper and lower band (Upper Band + Lower Band) / 2. Where n is 20 or a custom period value is chosen by the trader.
Features
A straightforward implementation of the Donchian channel ble
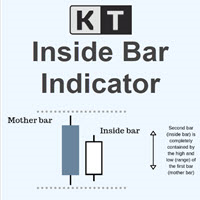
KT Inside Bar plots the famous inside bar pattern in which the bar carries a lower high and higher low compared to the previous bar. The last bar is also known as the mother bar. On smaller time-frames, the inside bar sometimes appears similar to a triangle pattern.
Features
Also plots entry, stop-loss, and take-profit levels with the inside bar pattern. No complex inputs and settings. Erase unwanted levels when the price reaches the entry line in either direction. All Metatrader alerts include
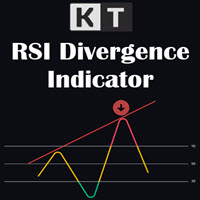
KT RSI Divergence shows the regular and hidden divergences built between the price and Relative Strength Index (RSI) oscillator. Divergence can depict the upcoming price reversal, but manually spotting the divergence between price and oscillator is not an easy task.
Features
Ability to choose the alerts only for the divergences that occur within an overbought/oversold level. Unsymmetrical divergences are discarded for better accuracy and lesser clutter. Support trading strategies for trend reve

• Please test the product in the Strategy Tester before purchasing to understand how it works.
• If you face any issues, contact me via private message—I’m always available to help.
• After purchase, send me a screenshot of your order to receive a FREE EA as a gift.
Minimum deposit is 1000$ , or 1000 Cent = 10$. (Recommended 1500$) Every 1000$ = 0.01 Lot. Please stick to the rules, as we want you to win, win and win! (Trading is risky, and there are no guarantees for winning)

Best indicator for MT5 providing accurate and sniper signals to enter a trade without repainting!
It can be applied to any financial assets: forex, synthetic, cryptocurrencies, metals, stocks, indices . It will provide pretty accurate trading signals and tell you when it's best to open a trade and close it. Most traders improve their trading results during the first trading week with the help of the Power Indicator Pro.
Benefits of the Power Indicator Pro
Entry signals without repaint

• Please test the product in the Strategy Tester before purchasing to understand how it works.
• If you face any issues, contact me via private message—I’m always available to help.
• After purchase, send me a screenshot of your order to receive a FREE EA as a gift.
Minimum deposit is 1000$ , or 1000 Cent = 10$. (Recommended 1500$) Every 1000$ = 0.01 Lot. Please stick to the rules, as we want you to win, win and win! (Trading is risky, and there are no guarantees for winning)

KT Average Daily Range(ADR) shows the upper and lower levels using the average daily range covered by the currency pair or the instrument. The average daily range is calculated using the chosen period in the input settings. ADR High: ADR upper level is found by adding the average daily range value to the current day's low.
ADR Low: ADR lower level is found by subtracting the ADR value from the current day's high.
Features
It shows the ADR levels with several other helpful information benefici

• Please test the product in the Strategy Tester before purchasing to understand how it works.
• If you face any issues, contact me via private message—I’m always available to help.
• After purchase, send me a screenshot of your order to receive a FREE EA as a gift.
Time frame: M1
Leverage : Higher the better
Spread: Lower the better
Account type : All types
(EA may enter hedge positions, if you want to

KT Fisher Transform is an advanced version of the original Fisher Transform oscillator equipped with divergence detection, crossover alerts, and many more features. Originally it was developed by John F. Ehlers. It converts the asset's price into a Gaussian normal distribution to find the local extremes in a price wave.
Features
A light-weighted oscillator that efficiently identifies the upward and downward crossovers and marks them using vertical lines. It also finds regular and hidden diverg

PriceRunner MT5 The PriceRunner indicator is based on pure relative power. It gives promising results even in M1 timeframes in currency pairs and M2 in commodities and cryptos. The indicator is designed with user-friendly and simple settings. It is very suitable even for beginners who are interested in indicators and strategies. I am ready to make improvements on the indicator in line with the needs of those who buy or rent. However, even in its current state, you can see very promising results

• Please test the product in the Strategy Tester before purchasing to understand how it works.
• If you face any issues, contact me via private message—I’m always available to help.
• After purchase, send me a screenshot of your order to receive a FREE EA as a gift.
Time frame: M1
Leverage : Higher the better
Spread: Lower the better
Account type : All types
(EA may enter hedge positions, if you want to
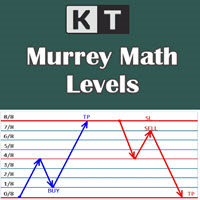
It shows the Murrey Math levels on chart and also provides an alert when price touch a particular level. T. Henning Murrey, in 1995, presented a trading system called Murrey Math Trading System, which is based on the observations made by W.D Gann.
Applications
For Murrey Math lovers, this is a must-have indicator in their arsenal. There is no need to be present on the screen all the time. Whenever the price touches a level, it will send an alert. Spot upcoming reversals in advance by speculatin

Only 1 copies left at a price of $99. Next price $199!
actual .set files (click me)
interactive panel manual (click me) Version for MT4: Smart Start MT4 Smart Start
is a smart trading system, the indicators of which allow it to be used both for trading with small deposits (fast acceleration) and for conservative trading. is a modernized trading indicator system that uses the MACD indicator to analyze the market. To analyze entry points, smart start takes into account the historical in

Утилита TemplateSwitcher позволяет автоматически переключать набор используемых на графике индикаторов и объектов в зависимости от текущего таймфрейма графика и/или символа. Часто бывает так, что на графике старшего таймфрейма используется индикатор с одним периодом расчета, а для младшего таймфрейма этот же индикатор необходим с увеличенным периодом расчета. Можно, конечно же, открыть два графика разных таймфреймов с нужными периодами индикатора. Но что, если мы не можем позволить себе дублиров
KT Candle Timer shows the remaining time in the closing of the current bar. You can use the bar closing time for multiple purposes, including time and trade management during the trading hours.
Features
It also shows the Symbol spreads along with the remaining time. It offers two convenient timer display positions, i.e., chart corner or next to the current bar. From colors to text size, it offers full customization according to user preferences. It is optimized to work without using extensive c

• Please test the product in the Strategy Tester before purchasing to understand how it works.
• If you face any issues, contact me via private message—I’m always available to help.
• After purchase, send me a screenshot of your order to receive a FREE EA as a gift.
In this EA you will have two sources of income:
1- Direct trades
2- Rebates from your broker.
Thus insure to register under an IB that shares with you their revenues
Scalping! What a thrill!
Forex trading had been a source of
KT Bullish Bearish shows the bullish/bearish regime of the market in the form of a colored histogram representing both of the market states alternately. Bull Market (Blue Histogram): A bull market indicates an uptrend when an instrument price rises over a continued period like days, months, or years. Bear Market (Red Histogram): A bear market indicates a downtrend when an instrument price rises over a continued period like days, months, or years.
Applications
It prevents trading against the big

Some disadvantages of Rollover Scalper: Currently the markets aren't that favorable for night scalping because of the fundamentals, so the next few months the EA might show 0% or even negative return. However, it happened in the past too and it was still profitable over all ~20 years. It's a scalper, so you'll need a broker with low spread and good execution time, preferably an ECN broker. ICMarkets would be a good choice. It's susceptible to slippage (which can't be backtested or limited on ECN

EA PRO is a 100% adaptive expert advisor based on price action, indicators and chart patterns. It has a built-in unique Smart Recovery algorithm which insures that your win rate is higher and that you recover your losses. Number of trades and lot size is decided by EA so that you get the most rewards from each trade. Every trade can be set with Stop loss and Take profit, the EA has an active trailing stop which is automatically activated once your trade is in profit. The EA can scalp the spikes
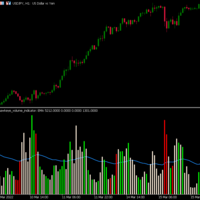
Hawkeye Volume Indicator contains a complex algorithm which executes over 300 calculations per bar in order to analyze the price action and associated volume, giving traders a tremendous advantage. Now Available in MT5 for U nlimited Use !
Volume is the only leading indicator which: .signals a price movement prior to it happening
.provides the fuel that drives the market Hawkeye Volume works in all markets and can be used in all timeframes for both tick and time charts – from longer term swing a
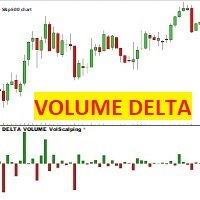
ДЕЛЬТА ОБЪЕМА Volscalping Этот индикатор для каждой ценовой свечи рисует дельта-свечу, которая представляет собой разницу между купленными и проданными контрактами. Свеча будет красной и отрицательной, если контракты, торгуемые по цене бид (проданы), превышают контракты по аску, и наоборот, свеча будет зеленой и положительной, если контракты, торгуемые по аск (покупаются), превышают контракты по ставке.
ВНИМАНИЕ: Индикатор работает только с брокерами, которые обеспечивают реальный поток рыноч

LT Easy Trend — Сила конфлюэнции в одном индикаторе Вы когда-нибудь чувствовали неуверенность, когда один индикатор сигнализирует о покупке, а другой — о продаже? LT Easy Trend был разработан, чтобы устранить эту неопределенность, предоставляя сигналы высокой вероятности, основанные на математическом консенсусе 9 самых уважаемых технических индикаторов в мире . Вместо того чтобы загромождать график десятками окон, Easy Trend обрабатывает всё в режиме реального времени и выводит четкий визу
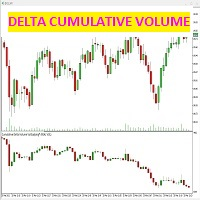
этот индикатор определяет разницу между контрактами, заключенными при покупке и продаже (агрессия) для каждой отдельной свечи.
индикатор показывает в специальном окне под ценовым графиком свечи, точно определяемые разницей между проданными и купленными контрактами, которые генерируют объемную силу рынка.
можно (см. на скриншотах) как выбрать только кумулятивный график дельты свечи, или даже с линией тренда самих свечей: при выборе второго поля u "НЕТ" линия тренда не будет нарисована, а при в
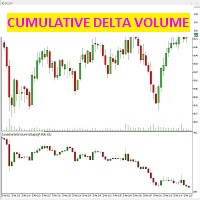
этот индикатор определяет разницу между контрактами, заключенными при покупке и продаже (агрессия) для каждой отдельной свечи.
индикатор показывает в специальном окне под ценовым графиком свечи, точно определяемые разницей между проданными и купленными контрактами, которые генерируют объемную силу рынка.
можно (см. на скриншотах) как выбрать только кумулятивный график дельты свечи, или даже с линией тренда самих свечей: при выборе второго поля u "НЕТ" линия тренда не будет нарисована, а при в

Определяйте направление тренда прямо на графике KT Trend Magic объединяет импульс и волатильность в цветной линии, которая следует за ценой. Линия непрерывно показывает текущее состояние тренда и меняет цвет при смене расчетного направления. Зеленая линия: показывает бычье состояние тренда. Красная линия: показывает медвежье состояние тренда. Смена цвета: отмечает новый переход направления на графике. Во время устойчивого движения линия также может служить динамическим ориентиром для откатов и п

Traders Toolbox Overwatch — это утилита мониторинга для всех запущенных экземпляров Traders Toolbox .
Это простая утилита переключения графиков и обзор рынка для всех бегущих графиков Traders Toolbox .
Функции:
1. Настраиваемые цвета кнопок, строки и столбцы.
2. Три типа сигналов (удерживать — желтый / продавать — красный / покупать — зеленый)
3. Динамически обновляет список кнопок в зависимости от новых или закрытых экземпляров Traders Toolbox .
4. Кнопки с одним нажатием выводят с
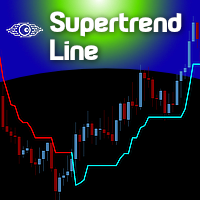
The Supertrend indicator was originally created by a french fellow named Olivier Seban , and its goal is to identify the Primary Trend of prices . Its calculation is easy and based on the average of Highs and Lows and then we add the volatility of a custom period, plus a multiplier. This way we get the Supertrend Line. You can find in the web several approaches and trading strategies using this very useful indicator.
HOW TO "READ" THIS INDICATOR
If the closing prices are above Supertrend Line,
FREE

An equity protection EA for MetaTrader that enforces your loss limits and profit target for you: when your account reaches a rule you set, it closes your trades on every symbol, before one bad day turns into a lost account. It suits prop firm challenges and personal accounts alike. Attach it to one chart, answer a few questions in the on-chart setup wizard, and it watches your whole account in the background while you trade by hand or with other EAs. What it protects Daily loss limit: a percenta

Индикатор тренда Analytical cover - революционное решение для торговли по трендам и фильтрации со всеми важными функциями инструмента тренда, встроенными в один инструмент! Индикатор Analytical cover хорош для любого трейдера, подойдет любому трейдеру как для форекс так и для бинарных опционов. Ничего настраивать не нужно все отточено времинем и опытом, отлично работает на во время флета та и в тренде.
Индикатор тренда Analytical cover это инструмент технического анализа финансовых рынков, отр
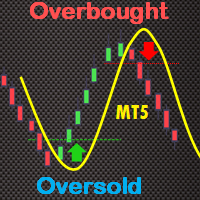
The True Oversold Overbought indicator provides you with ability to swiftly check whether the asset is oversold or overbought. Other than complementing your trading with True Oversold Overbought, you can use the indicator as your only trading system. It works with all forex instruments and will save you the headache of estimating when the market is due for a reversal or retracement. When the "Super Charge" feature is enabled, the areas where the price is in oversold/overbought status are ampli

According to Sir Isaac Newton's 3rd law, every action has its reaction and every movement must be compensated by an opposite movement of equal magnitude. The market cannot be oblivious to this physical principle, so when the force of gravity in the market of the big sharks hides like the sun behind the horizon, the night session allows us to see this law in all its splendor. This EA takes advantage of this movement to trade in the night session . Newton´s third law is designed to operate in the
Smart Moving Averages Indicator Smart Moving Averages is an exclusive indicator for Metatrader platform.
Instead of calculating moving averages for the selected chart time frame, the Smart Moving Averages indicator gives you the opportunity to calculate moving averages independently from the chart time frame.
For instance you can display a 200 days moving average in a H1 chart.
Inputs of the indicator are:
Timeframe : timeframe to be used for the calculation of the moving average Period : m

Bar Strength Divergence Indicator BarStrength Indicator is an exclusive indicator to trade Forex, Stocks, Indices, Futures, Commodities and Cryptos.
BarStrength Indicator shows the strength of each candle.
The indicator shows in a separate windows candles relatively to 2 price levels representing resistance and support in the market.
Once candle is near resistance it is highly probable that price movement will change direction and will go down in the next candles.
Once candle is near support

OBOS indicator
OBOS Indicator is an exclusive indicator to spot entries based on price action.
The OBOS Indicator is both effective and user friendly.
Indicator uses simple color codes and levels to indicate Overbought and Oversold conditions. No more headache.
The OBOS Indicator will only gives you indication when there are possible entries. Means you only get useful information.
Inputs of the indicator are:
MaxBars : number of bars to display in your chart Smoothing period : number of b

HighLow Arrow Indicator HighLow Arrow is a simple indicator to be used to signal major lows and major highs in your chart.
This indicator is not intended to be used to trade alone but more as an alert that a turning point might be forming.
In this case the HighLow Arrow indicator signals that a new high or a new low is forming and that traders can prepare for seeking new signals.
The formation of the High or the Low is confirmed after 2 bars have been closed. In the meantime, the alert can b

Добрый день, уважаемые трейдеры! Рад представить Вам свою новую торговую систему - Cat Scalper MT5! Лаунч стоимость советника сейчас снижена! Последняя неделя сниженной цены! Стратегия советника - вечерняя торговля с использованием динамического канала. Советник торгует одной сделкой с использованием стоплосса и тейк профита. Советник мультивалютный. Вы можете тестировать свои символы, вписав их названия в параметрах. Я рекомендую использовать настройки по умолчанию. Рабочий таймфрейм (и для т
Daily Pivots Multi Indicator Daily Pivots Multi is an exclusive indicator to draw your pivots levels and much more.
Most indicators draw daily pivots for the day. Daily Pivots Multi is able to draw levels for different days.
The indicator can do the calculation for unlimited number of days backward. It means that you can draw the levels for today but also for the past days.
This is very useful if you want to study a strategy with Pivots levels over a period of time.
Another problem is that e
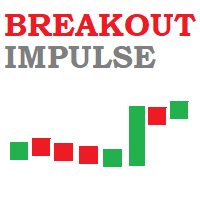
Breakout Impulse Indicator Breakout Impulse Indicator is a pattern recognition indicator for Forex, Stocks, Indices, Futures, Commodities and Cryptos.
The Breakout Impulse is a multi-bar pattern.
The purpose of the pattern is to identify a fast change in momentum.
This type of change can announce the start of a big directional move.
Inputs of the indicator are:
Distance : distance in pixel relative to top or bottom of candle to display the arrow symbol MaxBars : number of bars back used to
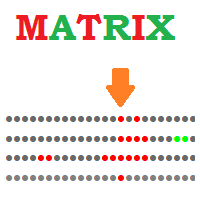
Matrix Indicator Matrix Indicator is a simple but effective indicator.
Matrix indicator displays usual oscillators indicators in a user friendly color coded indicator.
This makes it easy to identify when all indicators are aligned and spot high probability entries.
Inputs of indicator are:
Indicator: RSI, Stochastic, CCI, Bollinger Bands Param1/Param2/Param3: usual settings for the indicator ValueMin: Oversold level for oscillator ValueMax: Overbought level for oscillator The indicator can

This EA allows you to manage support and resistance zones on MetaTrader 5…but not only: To your buying and selling zones (you can configure 2 sellings zones and 2 buyings zones),
you can add 3 options (2 with multiframes) to enter a position:
Option 1: this is the option that enters a position without a signal: as soon as the price reaches the zone, the robot sends a trade.
Option 2: here the robot will wait for a break in the selected timeframe. Example: you put your zones on an H4 graph (fo

Профессиональный робот Move reliably , в котором реализована классическая стратегия торговли по MACD. Сигнал от пересечения сигнальной с основной линией MACD. Когда сигнальная линия пересекает основную линию сверху вниз - это будет сигналом для покупки, если сигнальная линия пересекает основную снизу вверх - это будет сигналом для продажи. В остальных случаях будет фиксироваться отсутствие сигнала. Также сигнал можно инвертировать. Принцип работы очень прост и надежен. Дает маленький, но наде
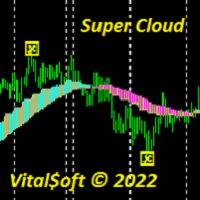
Индикатор Super Cloud помогает определить направление тренда при торговле. Отображает на графике сигналы о возможной предстоящей смене тренда. Индикатор предоставляет возможность обнаружить различные особенности и закономерности в динамике цен, которые невидимы невооруженным глазом. Основываясь на этой информации, трейдеры могут предполагать дальнейшее движение цены и соответствующим образом корректировать свою стратегию. Работает на всех таймфреймах, кроме MN .
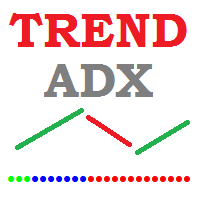
Trend Direction ADX indicator Trend Direction ADX is part of a serie of indicators used to characterize market conditions.
Almost any strategy only work under certain market conditions.
Therefore it is important to be able to characterize market conditions at any time: trend direction, trend strength, volatility, etc..
Trend Direction ADX is an indicator to be used to characterize trend direction:
trending up trending down ranging Trend Direction ADX is based on ADX standard indicator.
Tre

Trend Strength MA indicator Trend Strength MA is a part of a series of indicators used to characterize market conditions.
Almost any strategy only works under certain market conditions.
Therefore, it is important to be able to characterize market conditions at any time: trend direction, trend strength, volatility, etc.
Trend Strength MA is an indicator to be used to characterize trend strength:
Up extremely strong Up very strong Up strong No trend Down strong Down very strong Down extremely

Trend Direction Up Down Indicator Trend Direction Up Down is part of a series of indicators used to characterize market conditions.
Almost any strategy only works under certain market conditions.
Therefore it is important to be able to characterize market conditions at any time: trend direction, trend strength, volatility.
Trend Direction Up Down is an indicator to be used to characterize trend direction (medium term trend):
trending up trending down ranging Trend Direction Up Down is based
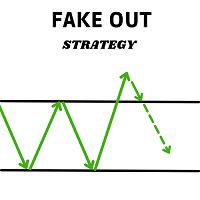
This expert advisor finds and operates the Fake out pattern, the search algorithm and its management can be adjusted from the Bot's configuration parameters.
Features: - Designed to operate with any type of asset.
- It is possible to set the time range in which the expert advisor will operate.
- Trailing stop managed internally by the algorithm.
- Partial position closing (partial profit taking), when the price has moved in favour of the position.
- Take profit automatically adjusted by t
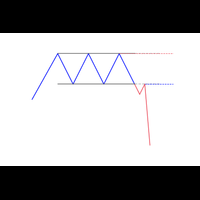
A new box will be added, if the closing price is higher than the maximum (lower than the minimum) of the current box series no less than for the specified value. Reversal will be made, if the closing price is higher (lower) than the last box on a value no less than the specified.
T his is a trend indicator and it can be used as an alternative for the trend definition instruments which use averaging.

KT Risk Reward shows the risk-reward ratio by comparing the distance between the stop-loss/take-profit level to the entry-level. The risk-reward ratio, also known as the R/R ratio, is a measure that compares the potential trade profit with loss and depicts as a ratio. It assesses the reward (take-profit) of a trade by comparing the risk (stop loss) involved in it. The relationship between the risk-reward values yields another value that determines if it is worth taking a trade or not.
Features

Hunt markets with Hunttern ZigZag . Easy to use with one parameter
You can use it for the following: -Classic patterns -Heads and shoulders -Harmonic patterns -Elliott Wave -Support and resistance -Supply and Demand
Single parameter: -Period (1-120)
Features: -Candle time -Single parameter -Light mode template
This is version 1 of Hunttern ZigZag. We are very happy to receive feedback from you.
FREE

主要城市的时间。北京时间、东京时间、悉尼时间、惠灵顿时间、纽约时间、法兰克福时间、伦敦时间、迪拜时间。 城市时间可选择开启或者关闭。 点差变色提醒。设置点差提醒点数,例如,设置100点,点差大于100点,文字会变红色。 Time in major cities. Beijing time, Tokyo time, Sydney time, Wellington time, New York time, Frankfurt time, London time, Dubai time. City time can be turned on or off. Dot difference color change reminder. Set the point difference reminder points. For example, set 100 points. If the point difference is greater than 100 points, the text will turn red.
FREE
MetaTrader Маркет - единственный магазин, где можно скачать демоверсию торгового робота и подвергнуть его проверке и даже оптимизации на исторических данных.
Прочитайте описание и отзывы других покупателей на заинтересовавший вас продукт, скачайте его прямо в терминал и узнайте, как протестировать торгового робота перед покупкой. Только у нас вы можете получить представление о программе, не заплатив за неё.

Вы упускаете торговые возможности:
- Бесплатные приложения для трейдинга
- 8 000+ сигналов для копирования
- Экономические новости для анализа финансовых рынков
Регистрация
Вход
Вы принимаете политику сайта и условия использования
Если у вас нет учетной записи, зарегистрируйтесь