Смотри обучающее видео по маркету на YouTube
Как купить торгового робота или индикатор
Запусти робота на
виртуальном хостинге
виртуальном хостинге
Протестируй индикатор/робота перед покупкой
Хочешь зарабатывать в Маркете?
Как подать продукт, чтобы его покупали
Платные технические индикаторы для MetaTrader 5 - 58
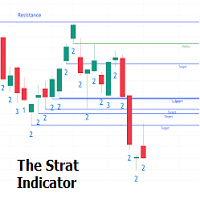
The Strat indicator is a full toolkit regarding most of the concepts within "The Strat" methodology with features such as candle numbering, pivot machine gun (PMG) highlighting, custom combo highlighting, and various statistics included.
Alerts are also included for the detection of specific candle numbers, custom combos, and PMGs.
SETTINGS
Show Numbers on Chart: Shows candle numbering on the chart.
Style Candles: Style candles based on the detected number. Only effective on no

Indicator shows "Support" and "Resistance" lines (these lines are drawn using the DRAW_LINE drawing style - that is, they are not graphic objects). A search for new minimums and maximums is performed to the left and right of the "signal bar" - the "signal bar" is the conventional middle of each new construction. Why is the word Flexible in the name of the indicator? Because we have the possibility to specify different number of bars to the left ('Left Bars') and to the right ('Right Bars'

Привет, коллеги! Представляю вам уникальное решение - Мультивалютный сканер волатильности в реальном времени. Этот индикатор является одним из результатов моего личного наблюдения за рынком на протяжении многих лет. Он решает несколько ключевых проблем, с которыми сталкиваются трейдеры: Отслеживание волатильности в реальном времени: Устраняет необходимость постоянного обновления или переключения графиков, чтобы видеть, где происходят значительные движения. Понимание международных корреляций:

Graphic Shapes -используя историю,проецирует в текущий момент четыре вида графических фигур, позволяющих определить основные диапазоны движения цены в будущем,а так же даёт понимание основных разворотов рынка ,при этом давая точки входа по приоритету!В панели расположены три вида величины фигур выраженные таймфреймами. Позволяют проводить полный анализ рынка,не используя дополнительные инструменты! Индикатор является мощным инструментом прогноза движения цены на рынке форекс!

Trend Shift - это очень интересный трендовый индикатор. Индикатор Trend Shift помогает определить либо новую, либо существующую тенденцию. Один из плюсов индикатора в том, что он довольно быстро перестраивается и реагирует на различные изменения графика. Безусловно, это зависит от настроек. Чем он больше, тем более плавной волной будет идти трендовая линия. Чем период мельче, тем больше рыночного шума будет учитываться при формировании индикатора. Целью, которая преследовалась при его создании,

To get access to MT4 version please click here . This is the exact conversion from TradingView: "Schaff Trend Cycle" by "everget". This is a light-load processing indicator. This is a non-repaint indicator. Buffers are available for processing in EAs. All input fields are available except fillings(due to graphical aesthetics). You can message in private chat for further changes you need. Thanks for downloading
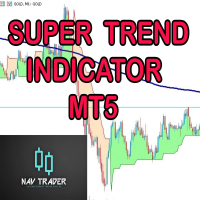
SUPERTREND; It is a trend following indicator based on the SuperTrend ATR created by Nav. It can be used to detect changes in trend direction and locate stops. When the price falls below the indicator curve, it turns red and indicates a downtrend. Conversely, when the price moves above the curve, the indicator turns green, indicating an uptrend.
BUY/SELL Signals; Method 1; A standard strategy using a single SuperTrend is While ST Period 1=10, ST Multiplier 1=3, - SELL signal when the bars
OVERVIEW
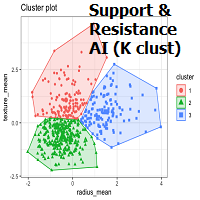
K-means is a clustering algorithm commonly used in machine learning to group data points into distinct clusters based on their similarities. While K-means is not typically used directly for identifying support and resistance levels in financial markets, it can serve as a tool in a broader analysis approach.
Support and resistance levels are price levels in financial markets where the price tends to react or reverse. Support is a level where the price tends to stop falling
Примечание. Вам необходимо скрыть существующий тип диаграммы. Вы можете сделать это, изменив цвета диаграммы. Если вы не знаете, как это сделать, посмотрите это видео - https://youtu.be/-4H6Z5Z4fKo или свяжитесь со мной по адресу priceaction9@outlook.com.
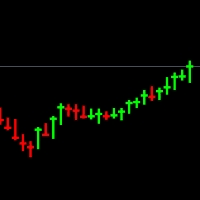
Это тип графика, который будет отображаться вместо вашего графика, и он показывает только максимум, минимум и закрытие, а также имеет толстые фитили. Это помогает вам лучше понять каждую свечу, уменьшая шум, вносимый ценами открытия каждой

This indicator, named Edyx_Candle_Size, is designed to be used with the MetaTrader 5 trading platform. It displays the size of the candlestick body for the current timeframe as a histogram. The indicator does not provide any specific trading signals or recommendations
Measures the size of of the candlestick. That is the difference between the open and close as the case may be for either a bullish or a bearish candle. This can be use to filter out entry position as to maximise profit and minimi

Order Blocks are supply or demand zones in which big traders can find the comfort of placing large buy and sell orders and completing a big, very big transaction. Order blocks are a unique trading strategy that helps traders find a direction in the market. Usually, it allows traders to find out what financial institutions are planning to do in a particular market and better indicate the next price movement.

Индикатор Trend Approximator - это мощный трендовый индикатор, который помогает трейдерам определять точки разворота на рынке Форекс. Вот основные характеристики и параметры этого индикатора:
Основные характеристики: Трендовый индикатор: Trend Approximator является трендовым индикатором, который помогает определять направление текущего тренда и выявлять потенциальные точки разворота. Поиск точек разворота: Он ищет и отображает на графике цены точки разворота, что позволяет трейдерам реагирова

Brief Description: Introducing the B4S BidLine CandleTimer – an insightful indicator. This innovative tool combines real-time bid line visualization with a dynamic countdown timer. Gain a competitive edge in your trading as you stay informed about the time remaining until the next candle starts, all displayed seamlessly on your chart. Why B4S BidLine CandleTimer? Unleash the potential of your trading strategy with the B4S BidLine CandleTimer. Here's why this indicator stands out: Real-Time Bid L

Brief Description: An advanced navigation and news display indicator designed to revolutionize your chart analysis experience. Seamlessly navigate through timeframes, dates, and times with an intuitive control panel, and stay informed with visually represented detailed news events. Key Features: 1. User-Friendly Control Panel: · Easily navigate through timeframes, dates, and times. · Enable or disable the display of news events with a simple checkbox control. 2.

Limited time offer, 30 usd only!!!
Discover the unparalleled capabilities of MentFX's structural rules , now optimized for MT5 ! Our state-of-the-art algorithm is engineered to commence calculations from a robust dataset spanning 1500 bars from the current position . This meticulous approach ensures unparalleled accuracy and dependability in your trading endeavors. Experience the seamless integration of MentFX with MT5 , empowering you to analyze markets with precision and confidence. With Me

The dashboard scans the readings of two indicators: 'MACD' and 'Stochastic'. Displays signals in three columns: for MACD, for Stochastic, and the resulting column (if the signal is the same for both indicators). Scanning can be selected on one or more timeframes. If you disable all timeframes, the dashboard will still load, but with settings specifically for such cases. Signals are always checked for the zero bar (zero bar is the rightmost bar on the chart) of the indicator. Description of para

Хорошо всем знакомый индикатор ZigZag который рисует лучи на основании заданного параметром pips " значимого движения" в пунктах инструмента. Причем если появился луч, не будет такого что он исчезнет (то есть индикатор не перерисовывается), будет обновляться только его экстремум, до тех пор пока не появиться противоположный луч. Есть возможность вывести на каждый луч текстовые метки с описанием ширины луча в барах и длины луча в пунктах.
The set of most common indicators for day trading and long-term trading.
MAs Cross (Global Trend) ADX Based Candle Color (Local Trend) Pivot Points (Entry Levels) Kijun-Sen You can use this indicator in different ways, one of it is opening positions in trend direction on pivot points levels. Contact
If you have some questions or if you need help, contact me via Private Message.
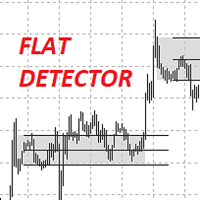
Представляю вам индикатор IndFlatDetector . Он относится к уровневым индикаторам и показывает Уровни проторговки.
В данном индикаторе сочетается простота интуитивность настроек и точность отрисовки уровней. Up count - количество свечек вверх для определения верхнего диапазона Down count - количество свечек вниз для определения нижнего диапазона Borders on the body or shadow - вести расчет диапазона по теням или по телу Change the borders or not - менять границы изначального диапазона или нет

The market structure indicator helps traders easily read market trends, this indicator shows trend continuity and trend reversals, this tool will be very useful for beginners who are just getting to know market structure, the indicator will provide visualization of the patterns that occur
Key Features: 1. BOS pattern: The indicator will provide an overview of the Break Of Structure pattern, where the pattern will indicate the continuation of the trend 2. CHOCH Pattern: The indicator will prov

The ZigZag Wave Entry Alert** indicator, created by Azad Gorgis in 2024, is designed for MetaTrader 5 and aims to provide traders with entry signals based on ZigZag patterns. Here's a brief overview of its functionality and key features:
Functionality:
- Detection of ZigZag Patterns: The indicator identifies significant price movements and outlines potential ZigZag patterns on the chart. It detects new highs and lows based on user-defined parameters such as Depth, Deviation, and Backstep. -
Индикатор " Session Control " предназначен для отображения торговых сессий на графике цены. Это позволяет трейдеру увидеть, в какие моменты активности происходят наиболее важные торговые сессии: Тихоокеанскую, Европейскую, Американскую и Азиатскую. Каждая из этих сессий характеризуется определенной волатильностью и активностью на рынке, что важно для принятия торговых решений.
Особенности: Отображение сессий : Индикатор показывает на графике цены временные промежутки, соответствующие различны

"GoldenSwing" is a comprehensive MetaTrader 5 indicator meticulously crafted by Southern Star Trading, designed to enhance your trading strategies with precision swing high and swing low identification. Harnessing the power of swing analysis, this indicator provides traders with invaluable insights into market reversals and trend continuations, enabling them to make informed trading decisions.
With its advanced algorithm, GoldenSwing detects significant swing highs and swing lows in real-time

Description:
Heikin-Ashi-like swing oscillator candles. It can be used in the same way as RSI or Stochastic.
For example: Zero crossing. Above the zero line is bullish, below the zero line is bearish.
Overbought or oversold. 100 line is the extreme bought level, -100 line is the extreme sold level.
Divergences.
Time frame: Any time frame.
Instrument: Any instrument.

Индикатор " Vertical Levels " для рынка Форекс представляет собой инструмент для отображения вертикальных уровней на графике цены. Эти уровни могут быть полезными для трейдера, так как они помогают определить значимые точки в ценовом движении и потенциальные зоны разворота или продолжения тренда.
Особенности: Вертикальные уровни: Индикатор "Vertical Levels" позволяет отобразить вертикальные линии на графике, обозначающие определенные уровни. Эти уровни могут быть настроены с помощью входных п

Данный индикатор основан на математике великого трейдера W.D.Ganna. С помощью его мы с легкостью найдете сильные уровни анализируя свинг для поиска оптимальной точки входа. Индикатор работает на всех инструментах и всех тайм фреймах. Индикатор полностью ручной и оснащен кнопками управления. Все что вам нужно это нажать на кнопку NEW, появится отрезок, данный отрезок вы размещаете на любое движение, свинг или даже 1 свечу, которую хотите проанализировать. Разместив отрезок нажимаете кнопку ОК. П

Данный индикатор предназначен для работы на любом ТФ. Программа на основе авторских алгоритмов и математике W.D.Ganna позволяет рассчитать целевые уровни движения цены по трем точкам с высочайшей степенью достоверности. Является прекрасным инструментом для биржевой торговли. Индикатор оснащен тремя кнопками NEW - вызвать треугольник для расчета. DEL - удалить выбранный треугольник. DELS - полностью удалить все построения. Вероятность достижения целей более 80%. Так же индикатор оснащен сигналом

Данный индикатор находит и отрисовывает зоны , так сказать места силы, где цена будет разворачиваться. Индикатор может работать на любом графике, любом инструменте, любом таймфрейме. Индикатор имеет два режима. Индикатор оснащен панелью управления с кнопками для удобства и разбит на два режима. Ручной и авто. Ручной режим: Для работы с ручным режимом необходимо нажать кнопку NEW, появится отрезок. Данный отрезок натягиваете на движение и нажимаете кнопку LVL. Отрисовывается уровень. Авто режим:
Этот индикатор представляет собой закрепленный осциллятор полулогарифмического масштаба. Логарифмическая шкала широко используется профессиональными специалистами по анализу данных для более точного отображения информации, собранной за определенный период времени, точно так же, как MT5 отображает данные о ценах. Фактически, основная логика этого индикатора была бесплатно получена от зарубежного ученого-биотехнолога.
Логарифмическая диаграмма отображает логарифмические значения по осям X (гори

Brief Description B4S Economic News Radar is designed to keep traders informed about upcoming and past news events directly on your trading chart. This indicator provides a comprehensive news dashboard, vertical lines marking news events, customizable reminders for upcoming news events and a unique persistence feature for your preferred settings. Why News Events Matter: Economic indicators, central bank decisions, and geopolitical events can trigger market volatility, influencing currency values

Brief Description: A powerful tool designed to display historical Open, High, Low, and Close (OHLC) price points for various essential time periods. Gain valuable insights into market behavior with a focus on yesterday, the day before yesterday, the previous week, and the previous month. The indicator not only provides a retrospective view of market dynamics but also serves as a powerful tool for recognizing liquidity zones. Features: 1. Comprehensive Timeframe Insights: · Visua
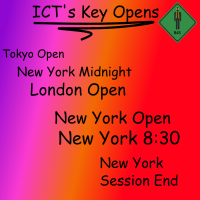
Brief Description The indicator is a powerful tool based on Inner Circle Trader's trading theory. It strategically plots lines at key prices relative to time, highlighting crucial market moments such as Tokyo Open, New York Midnight, London Open, New York Open, New York 8:30 AM, and New York Session End. The indicator is built on the foundation of Inner Circle Trader's trading theory, emphasizing the significance of key open times as liquidity and reference zones. These zones act as magnets for
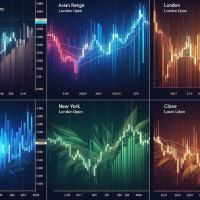
Brief Description The B4S_ICT_Killzones indicator is designed to enhance your trading strategy by highlighting key market times based on the Inner Circle Trader's (ICT) proven trading model. This indicator intelligently plots colored boxes around critical "killzone" periods, providing valuable insights into market behavior influenced by different geographical and time zone locations and time variations. Features / Indicator Settings 1. Killzone Identification Asian Range: Target the Asian trad

Brief Description: The B4S_Institutional_Round_Number_Prices indicator identifies and marks key price levels, known as round number prices or institutional price levels, renowned for their psychological significance. These levels often influence institutional activity, attracting attention and triggering significant market moves. Features: Round Number Price Identification: The indicator excels at identifying round number prices, providing you with crucial insights into potential market moveme

Brief Description The B4S PriceLevel Watcher is a useful indicator designed to empower traders with precise price level notifications. It allows users to set customizable notifications based on specific price types, such as close, high, low, ask, bid, or either ask or bid of the current candle. Problem being solved In the ever-evolving world of trading, staying attuned to price movements is paramount. Traders need to remain vigilant, ready to act swiftly as market conditions change. However, t

This indicator informs the user when the ATR is above a certain value defined by the user, as well as when the ATR prints a percentage increase or percentage decrease in its value, in order to offer the user information about the occurrence of spikes or drops in volatility which can be widely used within volatility-based trading systems or, especially, in Recovery Zone or Grid Hedge systems. Furthermore, as the volatility aspect is extremely determining for the success rate of any system based o

Introducing the Consecutive Green/Red Candle Alert Indicator for MT5 - Your Trend Spotting Companion!
Are you ready to take your trading to the next level? We present the Consecutive Green/Red Candle Alert Indicator, a powerful tool designed to help you spot trends and potential reversals with ease. Whether you're a new trader looking for clarity in the market or an experienced pro seeking additional confirmation, this indicator is your trusted companion.
Key Features of the Consecutive Gre

Индикатор Chapon Channel - это классический канальный индикатор, который позволяет трейдеру реагировать на выход цены за границы установленного канала. Этот канал формируется на основе анализа нескольких свечей, начиная с последней, чтобы определить экстремумы в рассматриваемом промежутке. Эти экстремумы затем используются для построения линий канала.
Торговля в канале является одной из наиболее популярных стратегий на рынке Форекс, благодаря её простоте даже новички могут использовать этот м
Buy DEMA 3 Scalp Indicator, Signaling and Trend Finder for Forex DEMA 3 indicator is a professional indicator for finding trends as well as finding entry and exit points for a symbol. This indicator is designed based on the DEMA indicator, which can tell you the signals accurately and quickly. The DEMA 3 indicator can give you accurate and early entry points for swings. Features of the DEMA indicator 3
Receive signals as notifications on the Metatrader mobile application. Receive signals by em

About:
Introducing the "Median Proximity Percentile" developed by AlgoAlpha, a sophisticated trading indicator engineered to augment market analysis. This tool adeptly monitors the proximity of median prices over a designated historical period and delineates its percentile position amidst dynamically evolving standard deviation bands. It furnishes traders with invaluable insights essential for well-informed decision-making.
Features: Color-Coded Visuals: Facilitate intuitive comprehension o
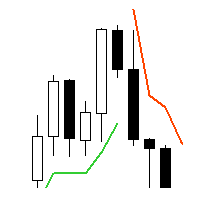
Supertrend - невероятно мощный и универсальный индикатор, предназначенный для помощи трейдерам в определении текущего тренда на конкретном торговом инструменте. С помощью двух встроенных индикаторов, Average True Range и Standard Deviation, трейдеры могут выбрать наиболее подходящий индикатор для своей стратегии торговли. Пользователи также могут настроить период этих индикаторов и выбрать цену (Close, High, Low, Open, Weighted), к которой он должен быть применен, с Typical price в качестве опци

Heikin Ashi Heikin Ashi is a charting technique that can be used to predict future price movements. It is similar to traditional candlestick charts. However, unlike a regular candlestick chart, the Heikin Ashi chart attempts to filter out some of the market noise by smoothing out strong price swings to better identify trend movements in the market.
To create Heiken Ashi, a formula is used in which price data is entered, while ordinary candles are built only on bare numbers, without using any

An invention that will turn your working principles upside down.
Especially in horizontal and stagnant markets, annoying losses can occur.
Besides, following trend lines, support and resistance can be tiring.
To put an end to all this, I decided to create a professional "moving average" indicator.
All you have to do is follow the colors.
If you need additional support, I recommend the "Heiken-Ashi" candle indicator in my profile.
I wish you lots of profit..

The RSI Advanced tool will help traders capture trends and optimal entry points by:
- Enter a Buy order when the green line crosses the yellow line. Provided that the yellow line is near line 32 or 20 - Enter a Sell order when the green line crosses the yellow line. Provided that the yellow line is near line 68 or 80
Additionally, you can combine it with the convergence divergence that occurs at the green line.
**When you purchase the Mastering the RSI MT4 or Mastering the RSI MT5 indicat

Description: Dimatis Watchtower is a powerful backtesting tool designed for traders seeking for an efficient way to test and optimize their trading strategies on the MetaTrader 5 platform. With a minimalist interface and advanced features, this tool provides an outstanding solution for evaluating the performance of your strategies in various market conditions. Key Features: Backtesting: Perform precise and reliable backtests of your strategies using historical data from your broker directly on M

Индикатор Source Trend : Мощное Средство для Анализа Рынка!
Преимущества: Обнаружение Тенденций: Индикатор Source Trend поможет вам незамедлительно выявить направление движения цены и понять взаимодействие между покупателями и продавцами. Универсальность: Работает на всех таймфреймах и с любыми валютными парами, обеспечивая гибкость и адаптацию к различным рыночным условиям. Точные Сигналы: Предоставляет достоверные сигналы как на трендовых, так и на флетовых рынках, помогая принимать информи

PricePulse Pro - Индикатор простых решений! Использование этого индикатора очень просто - просто следуйте за цветными стрелками на графике. Алгоритм индикатора учитывает дневные колебания цены и фокусируется на измерении "свечной" доли в тренде.
Этот индикатор использует алгоритм, который учитывает изменения цен, основанные на различных параметрах, таких как H/C (высшая цена/закрытие), H/O (высшая цена/открытие), LC (низшая цена/закрытие), LO (низшая цена/открытие). Это позволяет получить бол

Представляем вам индикатор PriceStream Channel - классический канальный индикатор, который позволяет трейдерам своевременно реагировать на движения цены за пределами установленных границ канала. Этот коридор строится на основе анализа нескольких свечей, начиная с последней, что помогает определить экстремумы за исследуемый период. Именно эти экстремумы затем создают линии канала.
Торговля внутри канала является одной из самых популярных стратегий на форексе, и ее простота делает ее подходящей

Индикатор Spread Pulse - это эффективный инструмент, который предоставляет трейдерам информацию о текущем спреде на графике. Спред - это разница между ценой покупки и ценой продажи инструмента.Индикатор представлен в виде текста, который отображается на графике. Это позволяет трейдеру легко отслеживать текущий спред. Один из главных преимуществ индикатора Spread Pulse заключается в его цветной визуализации. В зависимости от размера спреда, цвет текста изменяется. По умолчанию, при маленьком
Supertrend is a trend following indicator based on the Average True Range (ATR) . Calculating the odd line combines trend detection and volatility. It can be used to detect changes in trend direction and position stops.
Basic knowledge Supertrend is a trend following indicator. It takes up space on the main chart and its plots show the current trend. A Supertrend can be used for varying durations (daily, weekly, intraday, etc.) and varying instruments (stocks, futures or forex). Super
Introducing the Reversal and Breakout Signals
This innovative tool is crafted to enhance your chart analysis by identifying potential reversal and breakout opportunities directly on your charts. It's designed with both novice and experienced traders in mind, providing intuitive visual cues for better decision-making. Let's dive into the key features and how it operates:
### Key Features:
Dynamic Period Settings: Customize the sensitivity of the indicator with use

Индикатор Price Pivot - это эффективный инструмент для выявления тренда на рынке Форекс. Он представляет собой надежного помощника для трейдеров, помогающего определить зоны тренда и флета. Ниже перечислены характеристики и преимущества данного индикатора:
Особенности индикатора Price Pivot:
Надежность и стабильность: Индикатор не перерисовывает предыдущие значения, обеспечивая стабильность сигналов.
Быстрая реакция на изменение тренда:
Алгоритм индикатора позволяет быстро реагировать

Paladin - это фундаментальный технический индикатор, специально разработанный для трейдеров на рынке Форекс. Он основан на уникальном алгоритме, который позволяет прогнозировать будущие цены на основе анализа исторических данных котировок за определенный временной период, заданный пользователем в настройках индикатора.
Этот индикатор предоставляет трейдеру ценную информацию о возможных изменениях в направлении движения цены. С использованием специальной формулы, лежащей в основе работы Paladi

Индикатор PriceActionOracle значительно упрощает процесс принятия торговых решений, предоставляя точные сигналы о разворотах на рынке. Своей основой он использует встроенный алгоритм, который не только распознает возможные развороты, но и подтверждает их на уровнях поддержки и сопротивления. Этот индикатор воплощает в себе концепцию цикличности рынка в разновидности технического анализа.
PriceActionOracle отслеживает рыночный тренд с высокой степенью надежности, игнорируя краткосрочные флукту

Индикатор VolatilityVanguard основан на анализе длинной и короткой волатильности цены. Он помогает определить точки входа на рынок, отображая стрелками благоприятные моменты входа. Этот индикатор можно использовать как фильтр в торговле или как инструмент, показывающий точное направление тренда. Он подходит как для скальпинга на малых временных интервалах, так и для долгосрочной торговли. Важно помнить, что успешная торговля требует комплексного подхода, и для входа на рынок необходима дополнит

Индикатор Pivot Point Pioneer основан на уникальных индикаторах, способных обнаруживать экстремумы. Он идеально подходит для выявления разворотов или резких движений цены в одном направлении. Благодаря этому индикатору вы будете проинформированы о предстоящих событиях: синяя точка появится при сигнале на покупку, а красная - на продажу.
Этот технический индикатор позволяет оценить текущее состояние рынка и принять решение о входе в трендовое движение с минимальным риском. Он использует процес

Certainly! Let’s discuss the RSI Rush , an aggressive momentum indicator that combines weighted moving averages (WMAs) at lows, mid-price, and tight highs. Here are the key components: Weighted Moving Averages (WMAs) : The RSI Rush employs three WMAs: WMA at Lows : Calculated based on the lowest prices during a specific period. WMA at Mid-Price : Considers the average price (midway between highs and lows) during the same period. WMA at Tight Highs : Based on the highest prices during the speci

** NOTE: This indicator uses realtime data. Thus DO NOT download Demo version. If you still need demo version, please refer to free version .
Symbol Chart Changer is an indicator/utility that offers you the option to switch between symbols and timeframes.
You can choose any symbol and timeframe on the same chart with just a few clicks. In addition, this indicator also shows the profit of the symbol through the color of the buttons.
Features: Click buttons on the chart to monitor all your
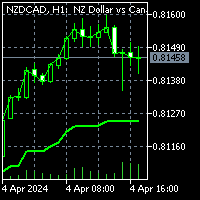
To get access to MT4 version please click here . This is the exact conversion from TradingView: "G-Channel Trend Detection" by "jaggedsoft". This is a light-load processing and non-repaint indicator. You can message in private chat for further changes you need. All input options are available. Buffers are available for processing within EAs. Highlight option is omitted as does not show good in Metatrader.
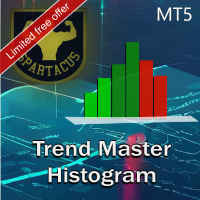
Trend Chart Histogram — индикатор, основанный на алгоритме с использованием двух скользящих средних и нескольких осцилляторов. Благодаря цветовому коду он позволяет быстро определить тенденцию и воспользоваться крупнейшими рыночными импульсами. Светлые цвета указывают на тренд, темные цвета определяют импульсы, а серый указывает на то, что вам не следует входить в рынок.
Версия для МТ4 здесь.
Входные параметры: - Период 1 (быстрый период) - Период 2 (медленный период) - Период осциллятора

indicator seems to be a sophisticated tool for trend analysis in financial trading. It utilizes Bollinger Bands with an exponential method and color-coding to indicate the current trend direction—whether it's with the trend (bullish) or against it (bearish), as well as using the intermediate color, blue, to suggest a potential trend reversal.
Additionally, the indicator uses a total of six tracks—upper band, upper band EMA, middle band, middle band EMA, lower band, and lower band EMA—to asses

Higher Timeframe Chart Overlay will display higher timeframe candles, including the number of candles high/low you specify.
You no longer need to switch timeframes to check the candles. Everything can be shown in one chart. MT4 Version : https://www.mql5.com/en/market/product/115680 Almost everything can be change as you want. You can change/set:
- Choose different colors for the body and top/bottom wicks.
- Panel's height and width.
- The width of the body and wicks
- Change backgrou

1. CONSTITUTION Goby Momentum it consists of two oscillator and three dynamic bands (upper, middler, lower). The inputs can be used to adjust the oscillators, the dynamic bands and the alert signals. 2. UTILITY This indicator detects the exhaustion of correction movements within a trend, thus giving entry points for new trades. Entry signals can be generated for both smaller timeframes (>M5) and larger ones (<H1). 3. OPERATION CONDITIONS Buy signal: When the Waterfall [thick line] is above the u

Tired of information overload when analyzing forex currency strength? Introducing "All Currency Strength Live", the ultimate dashboard indicator for MetaTrader 5 that simplifies your trading life. This innovative tool provides a clear, concise overview of the strength of all major currencies, empowering you to make informed trading decisions with ease. With "All Currency Strength Live," you gain access to real-time insights into both price and volume strength across all major currencies. No mor

Представляем Volatility Doctor RSI, новаторский инструмент, созданный на основе надежного индикатора RSI, призванный улучшить ваш опыт торговли как никогда прежде.
Наш индикатор не только предоставляет текущие показатели RSI в реальном времени, но также точно прогнозирует, где будет находиться показатель RSI через 10 шагов в будущем на выбранном вами интервале времени и любом предпочтительном символе для торговли.
Адаптивный Интеллект: Этот инструмент учится и настраивается под любой рынок

Откройте для себя силу анализа объема с помощью нашего индикатора профиля объема для Metatrader! / Версия для MT4
Basic Volume Profile - это индикатор, специально разработанный для ручных трейдеров, желающих оптимизировать свою торговлю. Индикатор Volume Profile - это незаменимый инструмент для любого серьезного трейдера, желающего лучше понять поведение рынка. С помощью нашего инновационного решения вы можете четко и ясно представить, как распределяется объем торгов по ценам. Это позволи

BS Time Band是一个很好的波段交易指示器,这个指标可以单独使用,但是最好是配合 StartPoint 一起使用效果更好,适用于任何时间框架,非常适合喜欢做波段交易的朋友。它能很好的体现出一个波段的完整信息,你可以很快的从这个指示器上寻找到最佳的预警区域,然后配合 StartPoint 找到最佳的buy位置和最佳的sell位置,也能很好根据指示器去坚守自己的持仓定订单。指标不含有未来函数,不会重新绘制,不仅能够应用到自己的手动交易过程中,还能完全可以写入到自己的EA中。(如果你感觉到这个指标能够帮助你进行更准确的交易,请帮忙给个好评,希望我的作品能够帮助更多有需要的人) =================参考使用方法=================== 此指标可以适用于任何交易品种。 做波段建议参数 timeFame:M5 如果配合 StartPoint 建议 StartPoint 的参数为(240,60)
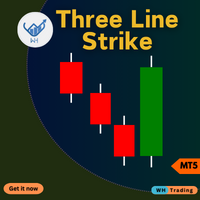
Индикатор ThreeLine Strike для MetaTrader 5 (MT5). Этот продвинутый инструмент разработан, чтобы помочь вам точно и легко определить потенциальные развороты рынка.
Независимо от того, являетесь ли вы новичком или опытным трейдером, этот индикатор может улучшить ваши торговые решения и максимизировать вашу прибыль. Contact me after purchase for guidance Ключевая особенность: Точные сигналы разворота . Обнаруживайте потенциальные развороты тренда на основе трехлинейной модели страйка, провер

Описание работы
Индикатор 'MA7 Clover' основан на свечных формах. Показывает свечной паттерн 'Пин-бар'. Подробная информация о индикаторе 'MA7 Clover' .
Настройки индикатора
General settings – общие настройки: Min body size – минимальный размер тела, проценты; Max body size – максимальный размер тела, проценты; Min nose size – минимальный размер носа, проценты; Max nose size – максимальный размер носа, проценты.
Message settings – настройки сообщений: Send message to the terminal (Alert) –
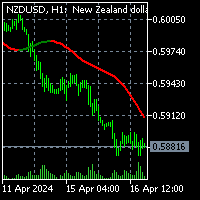
To download MT4 version please click here. - This is the exact conversion from TradingView: "Sentiment Range Ma" By "ChartPrime". - This is a non-repaint and light processing load indicator - You can message in private chat for further changes you need. - All input options are available. - Buffers are available for processing within EAs. - Highlight option is omitted as does not show good in Metatrader.
MetaTrader Маркет - уникальная площадка по продаже роботов и технических индикаторов, не имеющая аналогов.
Памятка пользователя MQL5.community расскажет вам и о других возможностях, доступных трейдерам только у нас: копирование торговых сигналов, заказ программ для фрилансеров, автоматические расчеты через платежную систему, аренда вычислительных мощностей в MQL5 Cloud Network.
Вы упускаете торговые возможности:
- Бесплатные приложения для трейдинга
- 8 000+ сигналов для копирования
- Экономические новости для анализа финансовых рынков
Регистрация
Вход
Если у вас нет учетной записи, зарегистрируйтесь
Для авторизации и пользования сайтом MQL5.com необходимо разрешить использование файлов Сookie.
Пожалуйста, включите в вашем браузере данную настройку, иначе вы не сможете авторизоваться.