Смотри обучающее видео по маркету на YouTube
Как купить торгового робота или индикатор
Запусти робота на
виртуальном хостинге
виртуальном хостинге
Протестируй индикатор/робота перед покупкой
Хочешь зарабатывать в Маркете?
Как подать продукт, чтобы его покупали
Технические индикаторы для MetaTrader 5 - 23

九转序列,源自于TD序列,是因TD序列的9天收盘价研判标准而得名。 汤姆·德马克(Tom DeMark)技术分析界的着名大师级人物,创建了以其名字首字母命名的TD系列的很多指标,价格反转的这个指标就是其中重要的一个,即TD序列。 德马克原版TD序列指标要复杂一些,想研究就自行看关于德马克的资料吧。这里只说简单的TD序列(九转序列)。 九转序列分为两种结构,低九买入结构和高九卖出结构。 TD高九卖出结构:连续出现的九根K线,这些K线的收盘价都比各自前面的第四根K线的收盘价高, 如果满足条件,就在各K线上方标记相应的数字,最后1根就标记为9,如果条件不满足,则K线计数中断,原计数作废重新来数K线。如出现高9,则股价大概率会出现转折。 TD低九买入结构:连续出现的九根K线,这些K线的收盘价都比各自前面的第四根K线的收盘价低,如果满足条件,就在各K线下方标记相应的数字,最后1根就标记为9,如果条件不满足,则K线计数中断,原计数作废重新来数K线。如出现低9,则股价大概率会出现转折。
结构的本质是时间和空间的组合,时间是横轴,空间是纵轴,不同的时间周期和空间大小的组合,形成不同的结构形态,不同
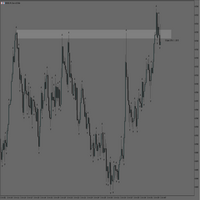
MT5 Rectangle Extender Indicator is a simple and easy tool that automatically extends any box/rectangle drawn on the chart to the right edge of the screen. This tool can be used for easy drawing of zones and can help with determining future areas of interest on the chart once price trades back to those levels. Very suitable for supply and demand, order blocks, POI's (Points of Interest) mapping on charts. Sometimes its better to have a zone than a single price level as price can shoot above or

it depends on ATR period to get swing points to help make better trading decisions blue dot and red dot is the default color scheme of course you can change it later if you'd like you can change the following : ATR PERIOD sending notifications number of times to send notifications sending notifications to your smart phone that's it very simple to use just drag and drop and follow the trend

it depends on channels and moving average in sketching the chart in two colors the default colors are gold and light blue to highlight the area of downtrend and the area of uptrend TO ADJUST THE INDICATOR YOU CAN CHNGE THE FOLLOWING: 1- the look back period which affects the length of the moving average 2- the multiplier which affects the point of swing in the trend 3- the channel shift which affects how close the line is moving to the price the default settings are the best for the indicator B

There are many linear regression indicators out there, most of them draw lines or channels, but this one actually draws a chart. The beauty of the indicator like Heiken Ashi is it removes a lot of market noise. 4 (OHLC) arrays are filled with Linear Regression(LR) values of each price for the LR period (default=14). The period of the Linear Regression is adjustable dependant on the market conditions. The SMA (default=14) also has period adjustment. Candles are generated with Green for 'Up' cand
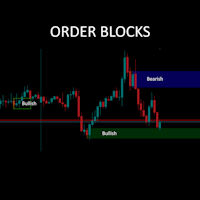
Straight forward keep is simple style Order Block finder. Now with optional higher timeframe overlay, watermark and candle timer all in one! No fancy algorithms but tends to be quite accurate for some symbols to predict bounce, return-to and break-through channels. It is a retrospective indicator (as they all are) and there to help you with better guesses as to where a movement is going towards. For me it works well in 5 and 15 minute periods. Use with out trade manager/visualiser/bracketing uti

In the ever-evolving world of Forex trading, understanding the different trading sessions is paramount to making informed trading decisions. Each trading session brings its own unique characteristics, opportunities, and challenges, and recognizing these can greatly enhance your trading strategies. Whether you're a novice or a seasoned trader, the Forex market's three main trading sessions – Asian, London, and New York – are crucial milestones that dictate market behavior and potential trade set

Previous Period High Low . This indicator shows the previous Day, Week, Month and Years High and Low. It's great for price action strategies. : Provides clear and visible breaks in structure. : Easy to see breakout levels. : Easy to see gaps between previous high, low levels after breakouts have occurred. The indicator works on every time frame. Multiple periods can be selected and be seen on the same chart. Every line can be customized to Your liking. Color, style and thickness. Enjoy!
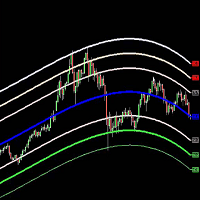
The Belkhayate center of gravity indicator is best used to confirm major turning points, and distinguish price extremes. Generally if price reaches the upper or lower levels one should expect a turn around coming soon, or at least a pull back towards the centre line if there is a strong trend. The upper and lower levels are red and green lines.
Our indicator use the same parameters as the well known trader M.Mostafa Belkhayate the inventor of the indicator, allow the use of buffers for your EA
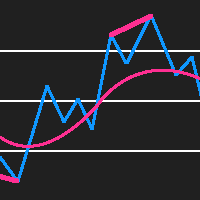
RSI Divergence Detector is an RSI indicator which also detects divergences and plots arrows and trend lines on the chart where you should buy and sell. Please note that this indicator provides 5 buffers and doesn't repaint making it an exceptional indicator for Expert Advisors. The indicator also provides alerts. Buffer 0 = RSI Buffer 1 = Buy Buffer 2 = Sell Buffer 3 = RSIGradient Buffer 4 = PriceGradient
NON REPAINTING
DIVERGENCE DETECTION

Inventory Retracement Trade it is designed based on one of the most popular tradingview indicator. This is mostly combined with other popurlar trend indicator to confirm the strength of the movement. Definition Inventory Retracement Trade is quickly becoming one of the most popular ways to identify where short-term counter trend institutional inventory has subsided and when it’s time to re-enter into a trade’s original trend direction.

A pivot point is an intraday technical indicator used to identify trends and reversals mainly in equities, commodities, and forex markets . Pivot points are calculated to determine levels in which the sentiment of the market could change from bullish to bearish, and vice-versa.
the swing daily is an advanced pivot points indicator that grants the user control over many aspects of the trading levels that you'll get familiar with in the controls section it's used mainly to locate intraday
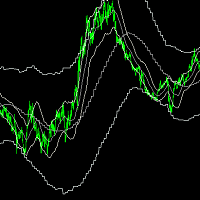
inp_timeframe: Set Timeframe of indicator MA Parameters: (Same as standard moving average indicator) inp_MA_period, inp_MA_shift, inp_MA_method, inp_MA_price: Moving Average Period, Moving Average Shift, Moving Average Method, Moving Average Price Please take note that using a MA_shift of 0 will result in a different result when the indicator is reloaded for higher time frame This indicator only accepts shift>0 This is due to the indicator showing the current time moving average and atr at the c

A indicator to show saturation in buying or selling With fast and complex mathematical calculations Easily find saturation points for buying or selling Can be used in all symbols and time frames with many signals Can be combined with different indicators and different time frames With simple settings and simple working methods
Features: Can be used on all symbols Can be used in all time frames Can be used in all markets (Forex, stock, etc.) Large number of signals Same performance on all t

HiLo Trend Matrix is an advanced multi-timeframe trend indicator that scans and analyzes multiple timeframes to determine the overall trend direction, allowing you to effortlessly ride the trend waves as they emerge. By scanning the four higher timeframes, starting from your current timeframe or a selected one from the input parameters, you'll always have a comprehensive view of the market's movements. And when the trend aligns, the HiLo Trend Matrix delivers an alert, so you can seize the oppo

IBB Candles is a tool that is based on the concept of Inverse Bollinger Bands. It compares price relative to state of the bands and plots candles with different colors defining the current state of the market i.e range | trend | strong trend. As the name suggests IBB(Inverse Bollinger Bands) is a technique which is completely different from the traditional Bollinger Bands and proves to be much more effective in analyzing market. This personal implementation makes this tool a more reliable optio
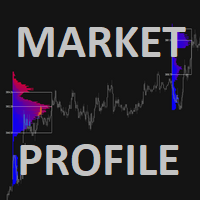
Concept of Market Profile was created at Chicago Board of Trade (CBOT) by trader Peter Steidlmayer and first published during the 1980s as CBOT product. Market profile by itself is not a stand-alone strategy, but a different way how you can view the market and make better trading decisions.
They have seen a market as an auction process which is affected by supply and demand the same way as every other auction, for example, development of prices of food, gas etc.
The price goes up as long th

Introducing the Kangaroo Hunter - Your Ultimate Edge in Forex Trading ATTENTION Forex Traders! Are you in constant pursuit of high-probability trade setups? Or maybe you're a novice trader struggling to pinpoint precise entry and exit points? Our solution, the Kangaroo Hunter, is about to revolutionize your trading journey. This meticulously designed indicator simplifies and refines the art of identifying the often elusive Kangaroo Tail patterns in the Forex market, pushing your trading strateg
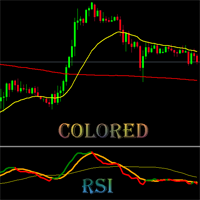
This is Colored RSI Scalper Free MT5 -is a professional indicator based on the popular Relative Strength Index (RSI) indicator with Moving Average and you can use it in Forex, Crypto, Traditional, Indices, Commodities. Colors are made to make trend, and changing trend more easily. Back test it, and find what works best for you. This product is an oscillator with dynamic overbought and oversold levels, while in the standard RSI, these levels are static and do not change.
This allows Colored RS
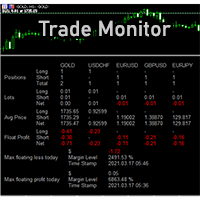
DSProFx Trade Monitor (iExposure) gives you detail information of all trades in your account including total positions, lot size, average price level (Breakeven Level), floating profit, and today's maximum profit/loss. The display is simple. Each data will be separated for every symbol/chart. This indicator will help you monitoring your trades especially if you are working with multiple symbols/charts and open many orders. Just attach DSProFx Trade Monitor in one chart, and it will show all deta

The Vortex Indicator was first presented by Douglas Siepman and Etienne Botes in January 2010 edition of Technical Analysis of Stocks & Commodities. Despite its based on a complex implosion phenomenon, the vortex is quite simple to interpret. A bullish signal is generated when +VI line cross above the -VI line and vice versa. The indicator is mostly used as a confirmation for trend trading strategies. The Vortex was inspired by the work of Viktor Schauberger, who studied the flow of water in tur

RISK TO REWARD TOOL for MT5 with UI on chart: (creates similar RR boxes like on tradingview) -creates and deletes draggable boxes on chart, ANY SYMBOL, ANY TF. Menu buttons:
NEW BUY, NEW SELL, DELETE ALL, ( and minimize) -draggable target TP level
-draggable SL limit level
-text labels with pips SL TP, RR ratio-there is no limit of boxes
-but program remembers first 100 boxes after changing input. there is parameter "delete_on_init" so false = every created box stays as it is,

Indicador Para Opções Binarias. Indicator for Binary Options Usa dois gales. Instalar em mt5 Esse indicador é para ser usado no tempo de vela de 5 minutos e em M5. Este também funciona em M1, porém é mais eficiente em M5. Só descompactar e copiar os arquivos na pasta de dados do seu MT5. Arquivos indicator na pasta MQL5 - Indicator. Baixe também a Media Movel totalmente gratis:
https://www.mql5.com/pt/market/product/50400
Esse Indicador é para a próxima vela. Apareceu a seta, só aguardar a pr

Color Levels - удобный инструмент для тех, кто использует технический анализ с использованием таких инструментов, как Трендовая линия и Прямоугольник. Имеется возможность настройки двух пустых прямоугольников, трех закрашенных и двух трендовых линий. Настройки индикатора крайне просты и делятся на пронумерованные блоки: С цифрами 1 и 2 вначале - настройки пустых прямоугольников (рамок); С цифрами 3, 4 и 5 - настройки закрашенных прямоугольников; С цифрами 6 и 7 - настройки трендовых линий. Объ

MetaCOT 2 - набор индикаторов и специализированных утилит для анализа отчетов американской комиссии по товарным рынкам CFTC (U.S. Commodity Futures Trading Commission). Благодаря отчетам, издаваемым комиссией, можно анализировать размер и направление позиций крупных участников рынка, что выводит точность долгосрочного прогнозирования цены на новый, более качественный уровень, недоступный большинству трейдеров. Данные индикаторы, относящиеся к фундаментальному анализу, также можно использовать ка

The Session Volume Profile indicator displays the distribution of trade volume across price levels for a specific trading session. It visualizes areas of high and low trading activity, helping traders identify support and resistance zones. The profile's peak, known as the Point of Control (POC), represents the price with the highest traded volume.
The inputs of the indicator:
volumeBars(Row Size) : Determines the number of price bins or rows for the volume profile. A larger number results in
This indicator measures the largest distance between a price (high or low) and a moving average. It also shows the average distance above and below the moving average. It may come in handy for strategies that open reverse positions as price moves away from a moving average within a certain range, awaiting it to return so the position can be closed. It just works on any symbol and timeframe. Parameters: Moving average period : Period for moving average calculation. Moving average method : You can

The double top bottom pattern is arguably one of the technical analysis's most popular chart patterns. These patterns are used to capitalize on recurring patterns and identify trend reversal patterns, thereby creating well-placed entry and exit levels. The KT Double Top Bottom is based on these patterns and fine-tunes the trade signal development process for traders.
Features
It's based on one of the most reliable trading patterns and brings some fine-tuning and automation to the process. A

What you can do with CandleStick CandleStick is a useful indicator for doing MTF analysis. This indicator displays the CandleStick of another time frame on the chart . By understanding the information in multiple time charts at the same time, it is easier to understand the overall market view. It is also a useful tool for validating and studying past quotes and trades. There are similar products made by others, but I designed and developed it so that it is easy for me to use.
Features of Candl

Многим современным трейдерам приходится открывать несколько позиций по одной и той же паре, потому что одна позиция обычно не является лучшей, при этом накапливается много сделок, иногда с различными размерами лота. В таких ситуациях непросто рассчитать цену безубытка для всех открытых позиций. Для решения этой проблемы был создан индикатор Breakeven Price. Breakeven Price - это индикатор для MetaTrader 5, который рассчитывает текущую цену безубытка для всех позиций на покупку и продажу, открыты

Introducing the revolutionary ICT Silver Bullet Strategy Indicator for MT5, a groundbreaking tool designed to usher in a new era of trading for beginners and experienced traders alike. This advanced indicator seamlessly translates the intricate ICT Silver Bullet strategy into a simplified visual representation on your charts, offering not just comprehension but a path to profitable trading. A Strategy Simplified: Navigating the complexities of the ICT Silver Bullet strategy has never been easie

The Double Stochastic RSI Indicator is a momentum indicator which is based on the Stochastic Oscillator and the Relative Strength Index (RSI). It is used help traders identify overbought and oversold markets as well as its potential reversal signals. This indicator is an oscillator type of technical indicator which plots a line that oscillates within the range of zero to 100. It also has markers at levels 20 and 80 represented by a dashed line. The area below 20 represents the oversold area, wh

Introducing our A.I Currency Strength Meter Forex Indicator, a state-of-the-art tool designed to provide forex traders with real-time insights into the strength of various currencies. Leveraging the latest advancements in artificial intelligence and machine learning, this innovative indicator analyzes market data in real-time, providing users with accurate and up-to-date information to inform their trading decisions. In addition to its cutting-edge algorithms, the Currency Strength Meter For

Description Very robust and powerful indicator, which allows through its 4 components, trade the market in trend or not trending conditions. it based on a very reliable trading strategy and gives you all you need to be succesful in trading. KEY LINKS: Indicator Manual – How to Install – Frequent Questions - All Products How is Clever Scalper Pro useful to you? A complete and reliable trading strategy. Easy to understand and trade Allow to identify trend, confirm it, look for retraceme

KT Heiken Ashi Smoothed is a smoothed version of the standard Heiken Ashi. Moreover, it also plots buy/sell arrows on a trend change. A buy arrow is plotted when it change to a bullish state from bearish state. A sell arrow is plotted when it change to a bearish state from bullish state. Mobile notifications, Email, Sound and Pop-up alerts included.
What exactly is Heiken Ashi Smoothed? It filters out the false signals and noise in the standard Heiken Ashi. It applies the set of two moving a
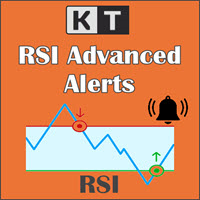
KT RSI Alerts is a personal implementation of the Relative Strength Index (RSI) oscillator that provide signals and alerts on four custom events: When RSI enter in an overbought zone. When RSI exit from an overbought zone. When RSI enter in an oversold zone. When RSI exit from an oversold zone.
Features A perfect choice for traders who speculate the RSI movements within an overbought/oversold zone. It's a lightly coded indicator without using extensive memory and resources. It implements all

KT Pip Counter is a simple and informative indicator that shows some essential data and numbers on a real-time basis. Such critical information and data can benefit a trader during an intense trading session.
Features
Shows the current profit/loss in currency, pips, and percentage. Shows the current spreads. Shows the remaining time in the closing of the current bar. The different color schemes for profit/loss scenario. The text position and layout can be fully customized. It uses minimum
В современных условиях рынка объективный метод торговли против тренда может стать ценным преимуществом трейдера. Большинству трейдеров, наверняка, знакомы названия "TD Sequential" и "Range Exhaustion". Sequential R - торговля против тренда с использованием системы распознания истощения трендов Simple Range Exhaustion. Система TD Sequential полезна при определении точек истощения тренда, позволяя оказаться впереди толпы трейдеров, следующих за трендом. Индикатор Sequential R предназначен для опре
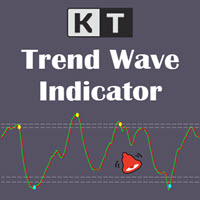
KT Trend Wave is an oscillator based on the combination of Price, Exponential, and Simple moving averages. It usually works great to catch the short term price reversals during the ongoing trending market. The bullish and bearish crossovers of the main and signal lines can be used as buy/sell signals (blue and yellow dot). It can also be used to find the overbought and oversold market. The buy and sell signals that appear within the overbought and oversold region are usually stronger.
Feature

KT SuperTrend is a modified version of the classic SuperTrend indicator with new useful features. Whether its Equities, Futures, and Forex, the beginners' traders widely use the Supertrend indicator. Buy Signal: When price close above the supertrend line.
Sell Signal: When price close below the supertrend line.
Features
A multi-featured SuperTrend coded from scratch. Equipped with a multi-timeframe scanner. The last signal direction and entry price showed on the chart. All kinds of MetaTra

KT Custom High Low shows the most recent highs/lows by fetching the data points from multi-timeframes and then projecting them on a single chart. If two or more highs/lows are found at the same price, they are merged into a single level to declutter the charts.
Features
It is built with a sorting algorithm that declutters the charts by merging the duplicate values into a single value. Get Highs/Lows from multiple timeframes on a single chart without any fuss. Provide alerts when the current
Advanced MA Crossover Alert System The FX AlgoTrader Advanced Moving Average Crossover Alert System is a highly configurable MT5 indicator which incorporates a fully automated alert system for monitoring two trader defined moving averages. The indicator is designed to alert traders when two moving averages crossover. The trader has a wide range of control over how the MA Crossover alerts are generated which is detailed below. Key Features Automatic display of trader defined fast and slow movin

KT Absolute Strength measures and plots the absolute strength of the instrument's price action in a histogram form. It combines the moving average and histogram for a meaningful illustration. It supports two modes for the histogram calculation, i.e., it can be calculated using RSI and Stochastic both. However, for more dynamic analysis, RSI mode is always preferred.
Buy Entry
When the Absolute Strength histogram turns green and also it's higher than the previous red column.
Sell Entry
W
Статистический индикатор спреда.
Незаменимый инструмент для каждого трейдера. Подходит как для ручной, так и для алгоритмической торговли.
Ключевые показатели:
maximum - максимальное значение спреда за указанный период medium - среднее значение спреда за указанный период minimum - минимальное значение спреда за указанный период current - текущее значение спреда Его можно использовать абсолютно на любом торговом инструменте. Данный индикатор показывает пределы спреда за установлен

Индикатор показывает, сколько времени осталось до открытия следующего бара или свечи. Примеры оставшегоя времени до появления нового бара: Пример для таймфрейма М1: 05 = 05 секунд. Пример для таймфрейма Н1: 56:05 = 56 минут, 05 секунд. Пример для таймфрейма D1: 12:56:05 = 12 часов, 56 минут, 05 секунд. Пример для таймфрейма W1: W1(06): 12:56:05 = 6 дней, 12 часов, 56 минут, 05 секунд. Версия для МetaТrader 4: https://www.mql5.com/ru/market/product/13564 Настройки color_time - Цвет текс

Переработка стандартного ADX для получения более понятных и эффективных торговых сигналов. Индикатор вычисляет ADX по стандартным формулам, но исключает операцию взятия модуля от значений ADX, которая по какой-то причине искусственно добавлена в ADX. Другими словами, индикатор сохраняет исходный знак значений ADX, что делает их более точными, простыми для использования и более ранними по сравнению со стандартным ADX. Строго говоря, любое преобразование вроде взятия модуля уничтожает часть информ

Setup 9.1 strategy created by the North American trader Larry Williams . SIMPLE setup, effective, with a good level of accuracy and excellent return. Attention : The Demo version only works on the tester, if you are interested in running it in real time, please contact me and I will provide another version. Buy Signal:
Exponential moving average of 9 (MME9) is falling, wait it to TURN UP (in closed candle). Place a buy stop order 1 tick above the HIGH of the candle that caused the turn to occur

KT Auto Fibo draws Fibonacci retracement levels based on the ongoing trend direction. The Highs and Lows are automatically selected using the Maximum and Minimum points available on the chart. You can zoom in/out and scroll to adjust the Fibonacci levels accordingly.
Modes
Auto: It draws the Fibonacci levels automatically based on the chart area. Manual: It draws the Fibonacci levels only one time. After that, you can change the anchor points manually.
Usage: Helps to predict the future p
Этот инновационный технический индикатор был создан для того, чтобы обнаруживать период затишья на рынке перед началом высокой волатильности рынка. Как и многие другие хорошие технические индикаторы, Market Activity Index является очень стабильным, и он широко применим ко многим финансовым и нефинансовым инструментам без особых ограничений. Market Activity Index лучше всего использовать для визуализации чередующейся формы низко и высоковолатильного рынка. Это очень полезный инструмент для взятия

Buy CTS scalping indicator, provide buying and selling signals, automatic channeling and sending signals to mobile phones
Using technical analysis and price action methods and modern methods, CTS indicator can draw price channels and recognize price trends with high accuracy and issue entry and exit signals according to them. Traders can easily fluctuate using this indicator in different time frames and in different markets. With the CTS indicator, you can signal in different ways. This indicat
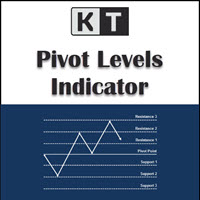
KT Pivot Points automatically plots the daily, weekly, and monthly pivot levels on a chart with the precise calculation based on the latest data. Pivot points is a widely used indicator in technical analysis, particularly in the Forex market.
Features
Send alerts when the price touches the pivot level. It offers complete customization for each kind of pivot level. Shows daily, weekly, and monthly pivot levels without any fuss. It uses minimum CPU resources for faster calculation. Compati

Super Trend Indicator for MetaTrader 5 - Elevate Your Trading Precision Experience the future of trading with the "Super Trend Indicator" designed for MetaTrader 5. This versatile tool is your key to precise market analysis, providing insights into potential trend directions that enhance your trading decisions. Basic Details : Indicator Type : Super Trend Indicator for MetaTrader 5 Key Metrics : Real-time analysis of market trends using a proprietary algorithm. Customization : Fully customizable

KT CCI Divergence shows the regular and hidden divergence created between the price and CCI oscillator. Divergence is one of the vital signals that depicts the upcoming price reversal in the market. Manually spotting the divergence between price and CCI can be a hectic and ambiguous task.
Limitations of KT CCI Divergence
Using the CCI divergence as a standalone entry signal can be risky. Every divergence can't be interpreted as a strong reversal signal. For better results, try to combine it

Highly configurable Average True Range (ATR) indicator.
Features: Highly customizable alert functions (at levels, crosses, direction changes via email, push, sound, popup) Multi timeframe ability Color customization (at levels, crosses, direction changes) Linear interpolation and histogram mode options Works on strategy tester in multi timeframe mode (at weekend without ticks also) Adjustable Levels Parameters:
ATR Timeframe: You can set the lower/higher timeframes for ATR. ATR Bar Shift: y
FREE

Indicator basic idea is buy strong currency and sell weak currency. If A/B currency pair is in an uptrend, it shows if it is due to A strength or B weakness.On these signals one can choose the most optimal pair to trade. You can use Currency Power System for pattern trading as well, among basic patterns which can be used are: cross trend break divergencies So much for theory. I searched for a ready-made indicator (Currency Strength) to support my trade but did not find one. Well. I have to wr

40% off. Original price: $50 (Ends in May 15th) Advanced Bollinger Bands Scanner is a multi symbol multi timeframe Bollinger bands dashboard that monitors and analyzes the Bollinger Bands indicator from one chart. This panel scans the Bollinger bands indicator in up to 28 configurable instruments and 9 timeframes for price overbought/oversold, price consolidation (Bollinger bands squeeze), and consolidation breakout (squeeze break) with a deep scan feature to scan all market watch symbols (up

This indicator was developed to support multiple timeframe analysis. In the indicator settings, the user can set the color, width, and style of the horizontal lines for each timeframe. This way, when the horizontal lines are inserted into the chart, they will be plotted with the timeframe settings.
MTF Lines also allows visibility control of another objets like rectangles, trend lines and texts.
This is a product developed by Renato Fiche Junior and available to all MetaTrader 4 and 5 users!

Индикатор RealCryptoLevels скачивая стаканы ордеров криптобирж с максимальной глубиной показывает горизонтальные объёмы популярных криптовалют выводя их на график, благодаря чему можно видеть не только сами объёмы, но и уровни и что не мало важно силу отображаемых уровней (смотрите скриншоты), что очень важно для успешной торговли по всем стратегиям от скальпинга до среднесрочной торговли, ведь можно видеть предпочтения покупателей и продавцов в настоящий момент и их настроения на будущее. Ин

Индикатор-предсказатель. Весьма удобен в качестве помощника, служит ориентиром будущего характера движения цены. Прогноз рассчитывается методом поиска в истории наиболее похожего участка (далее паттерн). Индикатор рисуется в виде линии, показывающей исторический исход изменения закрытий баров. Глубину истории, прогнозируемое количество баров, размер паттерна, а также качество поиска можно регулировать в настройках индикатора.
Описание параметров: PATTERN_Accuracy_ - качество поиска. PATTERN_Si
FREE

Индикатор Trail Stops Point показывает отклонение от текущей цены на определенное расстояние. Написан как дополнительный индикатор к продукту Trail Stops by Custom Indicator , для простого трейлинг стоп-лосса позиции на заданном расстоянии в пунктах.
Параметры индикатора Distance - дистанция трейлинг-стопа в пунктах. Номера буферов: 0 - Support, 1 - Resistance.
FREE

Swiss Holy Grail Indicator Motivation and functioning The HolyGrail indicator serves to optimize an entry. At that very moment I caught myself, that I went short in an uptrend, so I got into a trade in an anti-cyclical way. Or I have entered into a much too mature trend. This indicator should prevent such errors: One should always be aware of whether it is pro- or anticyclic entry, and one must always know about the maturity of the trend. Don't enter an old trend. Linda Raschke advises to buy th
FREE

The underlying strategy of this indicator is based on identifying momentum in the market and attempting to capture the direction of the trend through transitions between bullish and bearish moments. Utilizing bands around the RWMA allows for identifying potential overbought and oversold situations in the market.
1. Calculation of the Range Momentum Index (RMI): The RMI is based on a combination of the Relative Strength Index (RSI) and the Money Flow Index (MFI), both of which are momentum ind

The Martinware Closing Time Alarm indicator serves to warn traders that the current period (bar, candle) is about to end.
Input parameters: Time offset: with how many seconds before the ending of the current period the alarm must trigger
Alert with sound: informs if the alert should include playing a sound
Sound selection: a list of sounds available
Custom sound: name of the custom sound file to be used in case "custom sound" was selected. It must be inside a folder named "Sounds", this o
FREE

Track the historical outcome of your options operations on your favorite asset. It works for any asset in the spot market that has authorized option series on B3 (Brazilian stock exchange). Associate the robot with the asset you want to record and monitor its operation history and results. How to use the robot: 1. Enter historical data for your operations: Purchases and sales of the asset Purchases and sales of options on the asset Received dividends Cash inflows and outflows 2. Monitor the rea
FREE

Индикатор по параметрам Bollinger Bands определяет положение бара и выводит значение в окно индикатора.
При закрытии бара ниже нижней линии Bollinger Bands, значение индикатора становится отрицательным.
В таком случае можно ожидать скорого разворота рынка и двидения вверх.
При закрытии бара выше верхней линии Bollinger Bands, значение индикатора становится больше 1.
В таком случае можно ожидать скорого разворота рынка и двидения вниз.
Желательно использовать другие индикаторы для подтве
FREE

Самый чувствительный индикатор, который вы когда-либо видели. . .
POscillator — это чувствительный индикатор, обнаруживающий каждое изменение направления тренда на каждом таймфрейме. Он показывает колебания цен и выявляет восходящие или нисходящие тренды. POscillator строит кривую цены на основе частотных фильтров. Процедура создает две ценовые функции, используя по отдельности высокочастотный и низкочастотный фильтры. Затем он складывает их вместе, чтобы создать сглаженную кривую цены. Н
FREE

This indicator is based on the MACD indicator
Also, some candlestick patterns are used in it to identify better signals
Can be used in all symbols
Can be used in all time frames
Easy to use method
Adequate settings
Settings: period: The number of candles used to calculate signals. pFast: Like the MACD indicator settings pSlow: Like the MACD indicator settings
alarmShow: If you want to receive an alert in Metatrader after receiving the signal, enable this setting alarmShowNoti: If you
FREE

Analyze potential Covered Call structures in the Brazilian market. Define where you want the break-even of your structure and see what structure to use.
It works for any asset that has authorized series of options on B3 (Brazilian Stock Exchange). Associate the indicator to the asset you want to set up the Covered Call. *** ATENTION *** For the robot to work, the service that consults the authorized series of B3 options must be running on your terminal. Download the utility for free from
FREE

Corretora recomendada para usar esse indicador: https://tinyurl.com/5ftaha7c Indicador que pinta o candle de amarelo em pontos de muita agressão no mercado. Sempre que o mercado for se movimentar o candle irá ficar amarelo. Valido para todos ativos e todos timeframes. SEE OUR RESULTS ON INSTAGRAM: https://www.instagram.com/diogo.cansi/ TELEGRAM GROUP = https://t.me/robosdsc More information by email dscinvestimentos@gmail.com or by Whatsapp 55-991372299
FREE

The Volume Heatmap indicator visually shows the INTENSITY of the volume taking into account the concept of standard deviation. Purpose of the Indicator: High volumes are common where there is a strong consensus that prices will increase. An increase in volume often occurs at the beginning of a new upward trend in the price of an asset. Some technical analysts do not rely on trend confirmations without a significant increase in volume. Low volumes usually occur when an asset is heading for a down
FREE
MetaTrader Маркет - единственный магазин, где можно скачать демоверсию торгового робота и подвергнуть его проверке и даже оптимизации на исторических данных.
Прочитайте описание и отзывы других покупателей на заинтересовавший вас продукт, скачайте его прямо в терминал и узнайте, как протестировать торгового робота перед покупкой. Только у нас вы можете получить представление о программе, не заплатив за неё.
Вы упускаете торговые возможности:
- Бесплатные приложения для трейдинга
- 8 000+ сигналов для копирования
- Экономические новости для анализа финансовых рынков
Регистрация
Вход
Если у вас нет учетной записи, зарегистрируйтесь
Для авторизации и пользования сайтом MQL5.com необходимо разрешить использование файлов Сookie.
Пожалуйста, включите в вашем браузере данную настройку, иначе вы не сможете авторизоваться.