Смотри обучающее видео по маркету на YouTube
Как купить торгового робота или индикатор
Запусти робота на
виртуальном хостинге
виртуальном хостинге
Протестируй индикатор/робота перед покупкой
Хочешь зарабатывать в Маркете?
Как подать продукт, чтобы его покупали
Новые технические индикаторы для MetaTrader 5 - 23

KT Stochastic Alerts is a personal implementation of the Stochastic oscillator that provide signals and alerts based on six custom events: Bullish Crossover: When Stochastic main line cross above the signal line. Bearish Crossover: When Stochastic main line cross below the signal line. When Stochastic enter in an overbought zone. When Stochastic exit from an overbought zone. When Stochastic enter in an oversold zone. When Stochastic exit from an oversold zone.
Features
A perfect choice for
The Indicator assists in decision making along with the user's market reading. By drawing the trend, this indicator becomes very useful on days of high volatility in the market, that is, it offers strategic insights on days of economic data, news or pronouncements. On flat market days it becomes usual to identify possible market reversals. Follow Youtube to understand the most suitable scenarios for its use.

Данный индикатор показывает объем каждого бара (видимый диапазон) в пунктах. Гибкие настройки отображения значений. Возможна настройка параметров показа. Индикатор создавался для личного пользования, анализа графиков. Параметры: Color - цвет текстовых меток; Position - позиция метки: 0 - снизу, 1 - сверху; FontSize - размер шрифта; Angle - угол наклона текста; GapPoints - отступ по вертикальной оси.
FREE

KT Forex Trend Rider uses a trend following algorithm developed specifically for the Forex market to provide reliable buy & sell signals across the major currency pairs. It works best on major FX pairs and all time-frames.
Features
It comes with a Multi-Timeframe scanner that can search for upcoming signals across all the time-frames. It comes with four preset profiles to facilitate trading for scalpers, tick-trend, swing, and trend traders. It marks the potential reversal points in the mark

KT XMaster Formula is a buy & sell signal indicator that works magically on most of the timeframes and currency pairs when used correctly.
The indicator uses calculations based on moving averages, RSI, and MACD. It is usually appropriate for scalping and trend trading - whether you are a novice or an experienced trader, the signals generated by this indicator are simple to understand and implement.
Overview The indicator comprises green and red dots arranged in wavy lines. These dots corre
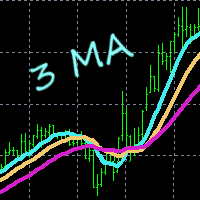
This indicator gives you a modified version of three Moving Averages. Great for scalping. Does not feature any alerts, and is best used manually after confirming multi line displays. Settings: Period1 Period2 Period3 Period4 How to use: Simply attach to any chart with default settings. Buy when the 4 lines converge below the price. Sell when the 4 lines converge above the price. Take note of the slope of Period4. See example pictures below. Best results when looking at three or more time frames
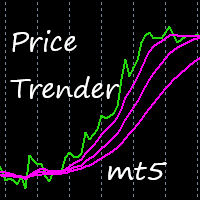
This indicator uses a special algorithm to plot the 4 lines for trading. Great for scalping. Features alerts. Settings for trend filters. How to use: Simply attach to any chart with default settings. Buy when the three pink lines converge below the green line. Sell when the three pink lines converge above the green line. Best results when looking at three or more time frames, and the three blue lines have just converged below or above the green line.
Use as you see fit for your strategy. Best r
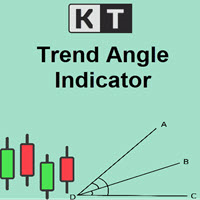
The KT Trend Angle helps to identify ranging and trending markets. The idea is to only enter a trade following the market trend if the slope is steep enough.
An angle is the ratio of the number of bars to the number of points: The bars mean the time offered by standard (M1, M5, etc.) and non-standard time frames. Points represent the unit of price measurement with an accuracy of 4 or 5 decimal places.
Input Parameters Period: An integer value to define the intensity of angled trendlines. A

KT Forex Blau Balance combines elements of momentum and volatility. It helps you identify entry and exit points.
Blau Balance consists of two moving averages (a slow-moving average and a fast-moving average) intersecting key transition points in market price. The indicator turns green or red when one is above or below the other, signaling to buy or sell trade signals.
It can be used in currency pairs and other markets that your MT4 or MT5 platform supports. Both short-term and long-term tra

The KT De Munyuk is a trend-based indicator that uses Parabolic SAR to identify the market direction. The indicator shows the PSAR in the form of green/red dots using a separate window. Buy Signal: When a green dot appears after a series of at least three red dots. Buy Exit: When a red dot appears on the current or next higher time frame. Sell Signal: When a red dot appears after a series of at least three green dots. Sell Exit: When a green dot appears on the current or next higher

In MetaTrader, plotting multiple horizontal lines and then tracking their respective price levels can be a hassle. This indicator automatically plots multiple horizontal lines at equal intervals for setting price alerts, plotting support and resistance levels, and other manual purposes. This indicator is suitable for Forex traders who are new and looking for chances to make quick profits from buying and selling. Horizontal lines can help traders find possible areas to start trading when the
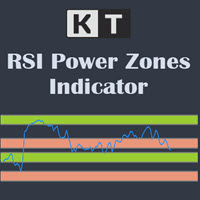
The KT RSI Power Zones divides and shows the movement of RSI into four different power zones to identify the potential support and resistance zones using the RSI.
Bull Support The bull support ranges from 40 to 50. The price is expected to reverse to the upside from this zone.
Bull Resistance The bull resistance ranges from 80 to 90. The price is expected to reverse to the downsize from this zone.
Bear Support The bear support ranges from 20 to 30. The price is expected to reverse to the

KT Price Border creates a three-band price envelope that identifies potential swing high and low areas in the market. These levels can also be used as dynamic market support and resistance. The mid-band can also be used to identify the trend direction. As a result, it also functions as a trend-following indicator. In addition, its ease of use and more straightforward conveyance of trade signals significantly benefit new traders.
Features
It works well on most of the Forex currency pairs. It

The BSI stands for Bar Strength Index. It evaluates price data using a unique calculation. It displays readings in a separate window. Many financial investors mistake this indicator for the Relative Strength Index (RSI), which is incorrect because the BSI can provide an advantage through its calculation method that the RSI indicator does not. The Bar Strength Index (BSI) is derived from the Internal Bar Strength (IBS), which has been successfully applied to many financial assets such as commodit

The KT Tether Line is a trend-following tool consisting of three indicators that work together to generate trading signals. It can correctly identify market trends while signaling trade entries. It was first introduced by Bryan Strain in the Stock & Commodities magazine in 2000 in "How to get with the trend and out at the end."
The Concept
When a market trend is confirmed, the most challenging part is determining the timing of the entries. This indicator alerts you to potential trend reversal
Current strength of the 8 major currencies My #1 Utility: includes 65+ functions, including this indicator | Contact me if you have any questions The indicator is displayed in a separate window, it can be moved to any place on the chart. In the input settings you can adjust: Interface theme : dark / white; Prefix and Suffix, if the currency pairs on your broker have it:
(e.g. if Symbol is "EURUSD .pro ", please set " .pro " as a Suffix); Panel size Font size
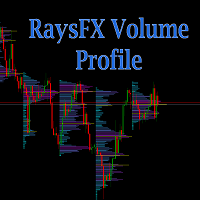
Calculation method The calculation method is summing the number of deals performed at a certain price. Alternatively, the volumes at a certain price can be summed if the real volume type is set in the parameters. The trade data is interpolated based on the most accurate terminal data available (М1 timeframe data). Each bar is divided into several trades based on the estimated price movement inside the bar. This is a distinguishing feature of the product setting it apart from other ones that hav

Ichimoku Aiko MTF is a collection of technical indicators that show support and resistance levels, as well as momentum and trend direction. It is a multi-timeframe indicator so you don't need to change the chart timeframe when you want to see the ichimoku clouds on a higher timeframe. eg. The chart timeframe is M15 and you want to see on the M15 timeframe chart the H1 ichimoku indicators (the ichimoku in Metatrader can't do that) that's why you need to use Ichimoku Aiko MTF.

Анализатор волатильности — это индикатор импульса, который извлекает выгоду из тенденции к сильному прорыву цены после консолидации в узком торговом диапазоне. Индикатор также использует осциллятор импульса, чтобы показать ожидаемое направление движения, когда происходит сжатие. Эта гистограмма колеблется вокруг нулевой линии, увеличение импульса выше нулевой линии указывает на возможность покупки длинной позиции, а падение импульса ниже нулевой линии может указывать на возможность продажи.

Об индикаторе: DALA Forecast - универсальный инструмент предсказания динамики временных рядов любой природы. Для предсказания используется модифицированные методы анализа нелинейной динамики, на основе которых строится предсказательная модель с применением методов машинного обучения. Для получения ознакомительной версии индикатора вы можете связаться со мной в личных сообщениях.
Как пользоваться индикатором: Примените индикатор к выбранному вами финансовому интрументу или индикатору с нужным
FREE

Here’s the problem: the default zigzag indicator given in MT5 trading platform does not really capture the most of the highs and lows on chart do draw zigzags. On chart below, notice that some of ther high, low of price have been missed to draw zigzags by this default zigzag indicator (picture 1). It is not so apparent until you compare default zigzag indicator to this SwingZZ indicator. Have a look on picture 2 and 3. The swing zigzag indicator is best because it captures most of the swing high

Профессиональный инструмент для торговли - индикатор дивергенции между RSI и ценой, позволяющий своевременно получать сигнал о развороте тренда или ловить движения откатов цены (в зависимости от настроек). Настройки индикатора позволяют регулировать силу дивергенции за счет угла наклона пиков RSI и процентного изменения цены, что даёт возможность тонко настроить силу сигнала. Код индикатора оптимизирован и в составе советника очень быстро тестируется. Индикатор не перерисовывает, стрелки для н
FREE

Профессиональный инструмент для торговли - индикатор дивергенции между AO и ценой, позволяющий своевременно получать сигнал о развороте тренда или ловить движения откатов цены (в зависимости от настроек). Настройки индикатора позволяют регулировать силу дивергенции за счет угла наклона пиков AO и процентного изменения цены, что даёт возможность тонко настроить силу сигнала. Код индикатора оптимизирован и в составе советника очень быстро тестируется. Индикатор не перерисовывает, стрелки для на
FREE

Индикатор работает с объектами "Трендовая линия", "Прямоугольник", "Текст" и позволяет их создавать и копировать с одного графика на другой. Является более удобной альтернативой автоматическим копировщикам, т.к. позволяет более гибко выбирать что и куда должно быть скопировано. Горячие клавиши: '1,2,3,4,5,6' - создание тонких горизонтальных линий (цвет задается в настройках), тоже самое с SHIFT - толстая линия ' ~ ' - создание линии со случайным цветом ))) '7,8,9' - создание закрашенных прямо

Профессиональный инструмент для торговли - индикатор дивергенции между AO и ценой, позволяющий своевременно получать сигнал о развороте тренда или ловить движения откатов цены (в зависимости от настроек). Настройки индикатора позволяют регулировать силу дивергенции за счет угла наклона пиков AO и процентного изменения цены, что даёт возможность тонко настроить силу сигнала. Код индикатора оптимизирован и в составе советника очень быстро тестируется. Индикатор не перерисовывает, стрелки для нап
FREE
Профессиональный инструмент для торговли - индикатор дивергенции между AC и ценой, позволяющий своевременно получать сигнал о развороте тренда или ловить движения откатов цены (в зависимости от настроек). Настройки индикатора позволяют регулировать силу дивергенции за счет угла наклона пиков AC и процентного изменения цены, что даёт возможность тонко настроить силу сигнала. Код индикатора оптимизирован и в составе советника очень быстро тестируется. Индикатор не перерисовывает, стрелки для на
FREE

Профессиональный инструмент для торговли - индикатор дивергенции между AC и ценой, позволяющий своевременно получать сигнал о развороте тренда или ловить движения откатов цены (в зависимости от настроек). Настройки индикатора позволяют регулировать силу дивергенции за счет угла наклона пиков AC и процентного изменения цены, что даёт возможность тонко настроить силу сигнала. Код индикатора оптимизирован и в составе советника очень быстро тестируется. Индикатор не перерисовывает, стрелки для нап
FREE

Theoretical Foundation The Keltner Channels are channels ploted using volatility deviations above and bellow a moving average. The indicator is an excellent tool to help the trader build trend and mean-reversion strategies. Parameters The Orion Dynamic Keltner allows the user to select the Volatility Calculation Type, being ATR or Average Range (not considering price gaps). Also, the user can select the Calculation Period, Number of Deviations, Moving Average Mode and the Moving Average Ca

Theoretical Foundation Similar to the well-known Average True Range (ATR), the Average Range indicator is a volatility measure that is calculated using only the range of the bars (high – low), not considering the Gaps, as with the ATR. The Average Range can be very useful for day traders as it allows one to get the measure of the volatility of the last N bars. Parameters You can select the calculation period of the indicator.

Normal Parabolic SAR with label of long or short state. Tells also "Parabolic long" and "short". Can be used in multitimeframe layouts together with Swiss HolyGrail indicator or in different timeframes. So, if all the indicators show "long" or "short" you can be sure that the risk of a wrong direction is small. The standard values for Parabolic SAR are 0.02 for step and 0.2 for maximum. You may experiment with changing the maximum to get smother curves. Note that changes in parabolic SAR are la
FREE
Индикатор отображает изменение баланса В правом нижнем углу окна.
Отображаются следующие периоды Сегодня Вчера 3 дня Неделя 10 дней Месяц 3 месяца Полгода Год Все время Есть возможность выставить расчетное время. Удобно пользоваться для расчетов прибыли/убытков с определенного часа.
Будет полезен например ночным скальперам. Данные совпадают с расчетами отчета в терминалее.
FREE

Детектор пин-баров — это индикатор, который находит на графике паттерн ценового действия пин-баров. Пин-бары — это сокращение от «Пиноккио-бары», которые представляют собой классическую альтернативу японским свечам с высокими верхними или нижними тенями и очень маленькими телами, такими как Dragon Fly Doji, Grave Stone Doji, Hammer, Inverted-Hammer, Hanging Man и Shooting Star. .
ПРЕДЛОЖЕНИЕ ОГРАНИЧЕННОЕ ПО ВРЕМЕНИ: Индикатор доступен всего за 50 $ и пожизненно. ( Первоначальная цена 125$ )
FREE
DESCRIÇÃO O indicador EasyFollowerTrader-Bot2-DayTrade opera apenas a favor da tendência. Assim, o indicador, em primeiro momento, observar a tendência de três médias síncrona com o time-frame selecionado. Em seguida, o indicador observar a tendência do gráfico diário. Quando estes dois gráficos estiverem se movimentando na mesma direção, teremos a maior probabilidade de ganhos. Chamaremos esta região como região de alta probabilidade de ganho. Na região de alta probabilidade de ganho, o ind

Профессиональный инструмент для торговли - индикатор дивергенции между RSI и ценой, позволяющий своевременно получать сигнал о развороте тренда или ловить движения откатов цены (в зависимости от настроек). Настройки индикатора позволяют регулировать силу дивергенции за счет угла наклона пиков RSI и процентного изменения цены, что даёт возможность тонко настроить силу сигнала. Код индикатора оптимизирован и в составе советника очень быстро тестируется. Индикатор не перерисовывает, стрелки для н
FREE

This indicator paints any Inside Bar found on the attached chart in a Dark Gray Colour with Black Borders and Wicks. If there are multiple consecutive Inside Bars, then they would also be successively painted Dark Grey with Black Borders and Wicks as well. You may opt to change the colours set by default in order to better contrast with your chosen background and chart colours. I made this Indicator out of necessity as my trading required it. But I know there may be others out there who may need

Индикатор Simple ATR Modern используется в техническом анализе измеряет волатильность рынка и показывает ее более понятным глазу уровнем а не осциллятором. ATR Дневной - Синий
Про возможности использование ATR в торговле можно можно найти в свободном доступе. Так же его можно использовать в связке с другим авторским индикатором Volatility Vision
Индикатор Average True Range измеряет волатильность рынка. Волатильность может быть низкой, пока рынок растет (и наоборот). Обычно он выводи

Средний дневной диапазон (ADR) - это индикатор, который показывает, как далеко валютная пара может продвинуться за день. Автоматически отображает верхний и нижний уровни ADR. Автоматически рассчитывает процент и расстояние ADR, достигнутый валютной парой за день. Оповещает при достижении ценой уровня ADR. Меняет цвет и толщину линии ADR, при достижении его ценой. Устанавливает уровни открытия дня.

Всё просто. Обычный Информационный индикатор. Показывает на графике: Текущий спред, своп на покупку, своп на продажу, время до закрытия свечи, время брокера. Индикатор можно расположить справа вверху или справа внизу графика. Чаще всего спредом называют разницу между ценой продажи и покупки. Своп - это стоимость переноса позиции на следующие сутки.

The movement exhaustion is a color rule that helps indicate when the movement will revert its direction. The darker the color, the greater the probability to revert. The indicator is based on the price statistic. Works on every timeframe, every instrument. Five color options: 0. Natural movement. (Gray) 1 - 4. Movement exhaustion (Yellow to maroon) The trader can use it as reversal or exhaustion signal. In a trend following trade it can be used as an exhaustion signal, indicating the movement ca

In this indicator, Heiken Ashi candles are calculated with the most optimal method. You can also customize the results by adjusting the amount of period and method input. But the most important advantage of this indicator is the adjustment of the time frame value. You can use this to calculate the Heiken Ashi chandels to See in time frames with lottery in the lower time chart. In this case, you get the best signal to buy or sell using two or more Heiken Ashi indicators with different timeframes
FREE

This is a regression tree indicator for MT4/MT5.
This indicator classificate nodes on the time period so that the deviation becomes smaller,
and displays regression line and channel for each node.
It's free!
Attached CartDemo.ex4 and CartDemo.ex5 is a Demo version and has the following limitations:
Method is RandomForest only
Maximum number of bars is 200
Maximum number of trees is 2
Maximum tree depth is 2
Calculated waste lines are shown
Not display correlation coefficients
Fu
FREE
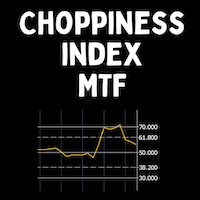
The Choppiness Index was created by Australian commodity trader E.W. Dreiss. It is designed to determine if the market is choppy (trading sideways) or not choppy (trading within a trend in either direction). A basic understanding of the indicator would be; higher values equal more choppiness, while lower values indicate directional trending. The values operate between 0 and 100. The closer the value is to 100, the higher the choppiness (sideways movement) levels. The closer the value is to 0,

Этот индикатор основан на стратегии, предложенной каналом YouTube "The Secret Mindset" в видео "Надежная стратегия скальпинга, которую я обнаружил после 1 месяца торговли ценовым действием". В видео представлено полное и подробное описание стратегии и условий фильтрации сигналов. * Создатель канала YouTube не имеет отношения к разработке этого индикатора Сигналы должны сочетаться с другими индикаторами и фильтроваться по мнению каждого трейдера
Индикатор
Бары, которые находятся внутри диапаз
FREE
DESCRIPTION
The EasyFollowerTrader-Bot3-DayTrade indicator only trades with the trend. Thus, the indicator will, at first, observe the trend of three averages synchronous with the selected time-frame. Then the indicator observes the trend of the daily chart. When these two charts are moving in the same direction, we have the highest probability of winnings. We will call this region the region of high probability of gain.
In the region of high probability of gain, the indicator will indicate

DESCRIPTION
The EasyFollowerTrader Bot4 DayTrade indicator always trades with the trend. Thus, the indicator, at first, observes the trend of the average of the highs and lows of the candles of the selected time-frame. Then see if this trend is in line with the trend of the daily chart to operate in favor of the major trend. When these two charts are moving in the same direction, we have the highest probability of winnings. We will call this region the region of high probability of gain.
In

Цвета генерируются в соответствии с параметрами высоты и глубины.
Анализ проводится в соответствии с направлением цены и объема торговли, если стоимость сделки превышает расчетную базу. система меняет цвет на зеленый, информируя вас о сильном направлении цены на покупку, если торгуемое значение меньше база расчета системы меняет цвет на красный, указывая на сильную цену на продажу.
FREE

Индикатор SuperTrend отлично подходит для торговли по тренду, определения ценовых уровней и паттернов, позволяет своевременно находить точку разворота тренда. Данный индикатор является аналогом индикатора платформы Tradingview языка Pine Script. Может быть использован как в качестве основного инструмента в составе стратегии, так и совместно с другими индикаторами.
Input-параметры: input int AtrPeriod = 10 ; input double Factor = 3.0 ;
FREE

This indicator uses a different approach from the previous version to get it's trendlines. This method is derived from Orchard Forex, and the process of making the indicator is demonstrated in there video https://www.youtube.com/watch?v=mEaiurw56wY&t=1425s .
The basic idea behind this indicator is it draws a tangent line on the highest levels and lowest levels of the bars used for calculation, while ensuring that the lines don't intersect with the bars in review (alittle confusing? I kno
FREE

TransitGhost Signal indicator, this is one of my best forex trading strategy. The strategy is based on the simple moving average cross, 5 SMA AND 200 SMA of which take a longer time to cross. Whenever the is a cross between the 5 SMA and 200 SMA a signal will be given, when the 5 SMA cross the 200 SMA to the upside ,a buying arrow will appear on chart, and push notification(alert) "Buy now, use proper risk management" will be sent on both the MT5 PC and mobile app, and when the 5 SMA cross the 2
FREE

MA Slope is a simple indicator that measures the slope of a specific Moving Average. We usually say that the price is in an uptrend when it is above the moving average, or it is in a downtrend when it is below the moving average. However, this information is inadequate since most of the time the market is in range. During range-bound markets, price moves back and forth around the Moving Average giving a lot of false signals. MA Slope helps identify and validate trends as it directly measures t

Double Correlation indicator (free) plots two windowed correlations in a separate window. the size of window is taken as input before the two symbols to correlate to. Two symbols are taken as an input parameters as well as period length. and the two correlations are computed with the currently shown symbol ex: input GBPJPY and AUDNZD. current symbol EURUSD then the following will be computed corr(EURUSD,GBPJPY) and corr(EURUSD,AUDNZD) The indicator can be useful to run a multi-symbol pair trad
FREE

Данный информационный индикатор будет полезен тем, кто всегда хочет быть в курсе текущей ситуации на счете.
- Больше полезных индикаторов Индикатор отображает такие данные, как прибыль в пунктах, процентах и валюте, а также спред по текущей паре и время до закрытия бара на текущем таймфрейме. Существует несколько вариантов расположения информационной строки на графике: Справа от цены (бегает за ценой); Как комментарий (в левом верхнем углу графика); В выбранном углу экрана. Так же имеется во
FREE

# 33% off - limited time only # ChartSync Pro MT5 is an indicator, designed for the MetaTrader 5 trading terminals. It enables the trader to perform better multi-timeframe technical analysis, by synchronizing symbols and objects into virtually unlimited charts. Built by traders for traders! Telegram Premium Support - Dd you purchase the Chart Sync indicator and need a bit of help? Send us a screenshot with your purchase and your Telegram ID so we can add you to our premium support Telegram g

Цвета генерируются в зависимости от объема торгов и направления рынка.
Анализ осуществляется по направлению цены и объема торгов, если объем торгов превышает расчетную базу система меняет цвет на зеленый, информируя вас о сильном направлении цены на покупку, если торгуемое значение меньше база расчета системы меняет цвет на красный, указывая на сильную цену на продажу.
FREE

Russo
Это индикатор, используемый для определения точек поддержки и сопротивления на ежедневном VWAP, и вы можете использовать его для проверки лучших точек входа и выхода.
Расчетное значение расстояния канала можно рассчитать несколькими способами:
- Руководство Определение проецируемого значения для расчета расстояния каналов.
- Автоматический Выберите таймфрейм, который будет использоваться. Независимо от времени отображения на экране, если параметр изменить на H1 (часовые

This indicators automatically draws the support and resistances levels (key levels) for you once you've dropped it on a chart. It reduces the hustle of drawing and redrawing these levels every time you analyse prices on a chart. With it, all you have to do is drop it on a chart, adjust the settings to your liking and let the indicator do the rest.
But wait, it gets better; the indicator is absolutely free! For more information: https://youtu.be/rTxbPOBu3nY For more free stuff visit: https
FREE

It makes it easier to see where there have been consolidation zones for previous prices and allows you to highlight the histogram where there is the biggest consolidation zone.
Input parameters Intervalo de preço Is the price between the histograms
Periodo Number of candle sticks to be analyzed
Porcentagem Highlights the histogram where there is minimal consolidation in relation to the analyzed period
FREE

The Danko Trend Color indicator is actually a candle coloring to bring practicality, ease and information to your charts.
Danko Trend Color combines PRICE AND VOLUME indicators to define the prevailing trend, so the colors are: Blue (indicates an uptrend)
Orange (indicates a downtrend)
White (indicates undefined trend)
I don't like to promise anything with my indicators, I ask you to download, test it for free (for use in backtesting) and see if the indicator can, in some way, help you

'Fibonacci Dimension' indicator allows display of preset or user-defined multi-timeframe Fibonacci levels. It automatically takes the previous high and low for two user-defined timeframes and calculates their Fibonacci retracement levels. It also considers the retraced level to draw the expansions on every change of price. A complete visual dimension in multiple timeframes allows deriving profitable strategies for execution. The functionalities included are: Provides an option to consider a pres
FREE

Theory VWAP is a volume-weighted moving average, bringing greater relevance to prices. The VWAP base calculation follows the classic formula described in Investopedia ( https://www.investopedia.com/terms/v/vwap.asp ). VWAP = sum(typical price[i]*volume[i]) / sum(volume[i])
Functionalities
Orion Intraday VWAP innovates by allowing the user to choose between the conventional Daily, Weekly and Monthly periods, also having the option of calculating the Intraday indicator, as used in other platfo

Boom and Crash Buy and Sell Trend. Non-repaint. Can be used on all timeframes 1 minute for scalpers. 5 minute to monthly timeframe for swing trading. works on all boom and crash pairs Crash300, Crash500, Crash1000. Boom300, Boom500, Boom1000. Green histogram colour means the trend is up(bullish) Buy signal. Dark orange histogram colour means the trend is down(bearish) Sell signal.

V Band is a technical analysis tool that helps smooth out price action by filtering out the “noise” from random price fluctuations. It is calculated by taking the average of a market’s price over a set period of time.
It can be applied to stocks equity indices, commodities and Forex . V Bands is used to identify trends or support and resistance levels.
They can also be used to generate buy and sell signals.
Choose a trading style and start trading!

Fundamentação teórica A VWAP é uma média móvel ajustada pelo volume, ou seja, o peso de cada preço corresponde ao volume de ações negociadas no período, dando mais importância ao período em que se tenha mais negociações. A Orion Vwap Bands permite que o usuário use plote 8 bandas que podem ser utilizadas como suportes e resistências para o preço. Cada banda é calculada a partir da Vwap Tradicional:
Ex.: Se escolhermos o valor 0.25 para a plotagem da Banda 1, pega-se o preço da Vwap e acrescen
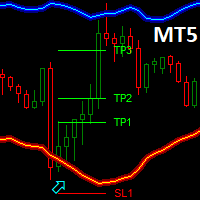
Dark Bands is an Indicator for intraday trading. This Indicator is based on Counter Trend strategy but use also Volatility. We can enter in good price with this Indicator, in order to follow the inversions on the current instrument.
Key benefits
Easily visible take profit/stop loss lines Reliable bands lines with futuristic colors, and Intuitive directional arrows Useful statistics , which indicate the win rate of the signals Plus Package available, leave a feedback to receive it for
FREE

DESCRIPTION The EasyFollowerTrader Bot1 DayTrade indicator operates only in favor of the majority trend. Thus, the indicator, at first, observe the trend of the daily chart to operate in its favor. Then the indicator watch the current chart trend. When these two charts are moving in the same direction, we have the highest probability of winnings. We will call this region the region of high probability of gain. In the region of high probability of gain, the indicator will indicate the best ent

ESS ПОДГОТОВКА СИГНАЛОВ СТРАТЕГИИ
Этот индикатор обнаруживает свечи конвертного типа, к которым применяется фильтр, этот фильтр состоит из 3-х стратегий вместе, с помощью которых можно выявить максимально возможную эффективность в пределах измеримых параметров.
Сигналы обозначаются стрелками вверх и вниз для каждого из направлений, и вы также можете активировать или деактивировать оповещения, электронные письма и push-сообщения на мобильный телефон.
Стоит отметить, что ни один индикатор н

** All Symbols x All Time frames scan just by pressing scanner button ** *** Contact me after the purchase to send you instructions and add you in "Harmonic Scanner group" for sharing or seeing experiences with other users. Introduction Harmonic Patterns are best used to predict turning point. Harmonic Patterns give you high win rate and high opportunities for trade in during one day. This indicator detects the best and successful patterns based on Harmonic Trading concepts . The Harmonic Patt

Индикатор Active Trend помогает анализировать рынок на выбранном временном интервале. Он определяет господствующую тенденцию. Используются в трейдинге. Можно использовать так основной для определения тренда. Индикатор работает хорошо как на коротких так и на более длинных трендовых участках. Во флете рекомендуется использовать фильры по вашему выбору. Может сопровождать позицию стопом, стоп рекомендуется выставлять на фиксированном расстоянии от точки формируемой индикатором. Самым простым вари

** All Symbols x All Time frames scan just by pressing scanner button ** *** Contact me after purchase to send you instructions and add you in "Divergence group" for sharing or seeing experiences with other users. Introduction MACD divergence is a main technique used to determine trend reversing when it’s time to sell or buy because prices are likely to drop or pick in the charts. The MACD Divergence indicator can help you locate the top and bottom of the market. This indicator finds Regular div

Фрактальный индикатор показывает последние уровни поддержки и сопротивления. Если цена пробивает уровень и закрепляется то индикатор рисует ромб желтого или малинового цвета сигнализирующий о возможном продолжении движения в сторону пробоя. Настройки индикатора: - BarCount: задает минимальное количество баров необходимых для построения фрактала. Индикатор лучше использовать в совокупности с другими индикаторами.
FREE
MetaTrader Маркет - единственный магазин, где можно скачать демоверсию торгового робота и подвергнуть его проверке и даже оптимизации на исторических данных.
Прочитайте описание и отзывы других покупателей на заинтересовавший вас продукт, скачайте его прямо в терминал и узнайте, как протестировать торгового робота перед покупкой. Только у нас вы можете получить представление о программе, не заплатив за неё.
Вы упускаете торговые возможности:
- Бесплатные приложения для трейдинга
- 8 000+ сигналов для копирования
- Экономические новости для анализа финансовых рынков
Регистрация
Вход
Если у вас нет учетной записи, зарегистрируйтесь
Для авторизации и пользования сайтом MQL5.com необходимо разрешить использование файлов Сookie.
Пожалуйста, включите в вашем браузере данную настройку, иначе вы не сможете авторизоваться.