 MetaTrader 5
 Эксперты
 Индикаторы
 Библиотеки
 Утилиты
 Виджеты
 Правила
Смотри обучающее видео по маркету на YouTube
Как купить торгового робота или индикатор
Запусти робота на
виртуальном хостинге
виртуальном хостинге
Протестируй индикатор/робота перед покупкой
Хочешь зарабатывать в Маркете?
Как подать продукт, чтобы его покупали
Новые технические индикаторы для MetaTrader 5 - 211
 На основании сигналов технических индикаторов принимаются решения относительно открытия или закрытия сделки на фондовом и форекс-рынках. Суть индикаторов заключается в математическом преобразовании цены и/или объемов финансового инструмента для прогнозирования изменений цен в будущем.
Протестируйте технические индикаторы, чтобы лучше предсказывать поведение рынка и зарабатывать на этом.
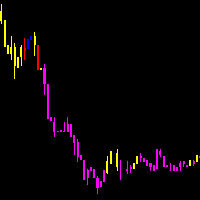
As médias coiote automatizam a leitura de analise de médias rápidas e lentas no saldo do volume e preço. Quando as médias estão em modo compra, a coloração do candle fica azul.
Quando as médias estão em modo venda, a coloração do candle fica magenta. Quando a coloração fica verde ou vermelho, temos a tomada das médias no volume mas não no preço, quando isso ocorre é um sinal de atenção.
A concepção do indicador é ser utilizado para operações em saída de consolidações na direção da tendencia do
FREE

ProFactor is an indicator generating signals based price on the famous profit factor formula. The calculation is simply defined as gross GREEN BARS divided by gross RED BARS.
That's it in a nutshell, but sometimes the simplest things hold the most value.
So let's imagine your trading system's gross profit for the past year was $40,000 and your gross losses were $20,000. Your Profit Factor would be 2. The ProFactor calculation works on the price of the asset instead of the strategy outco
FREE

An effective indicator that highlights candles with increasing volumes, overshadowing those with shrinking volumes. Also suitable for Forex because it uses tick_volume.
You can set the colors to your liking. It will be easier to spot trends and possible reversals. The increasing volumes indicate the presence of large investors and therefore determine the reliability of the candle under observation

GIVE A LOOK TO MY OTHER PRODUCTS ! 100 % PER MONTH PROFIT----CONTACT ME FOR MORE INFO !
The Parabolic SAR (PSAR) helps trader identifying direction of the stock movement and also provides them with the entry and exit. This indicator on the chart appears as a series of dots either above or below the price bars. When the Dots are below the price bar is then the price movement is considered to be bullish and when the Dots are above the price bar then the price movement is considered to be bearish
Daily Percentage Change (MetaTrader indicator) — calculates the change of currency rate related to the previous daily close and displays it in percentage points in the main chart window of the platform. Additionally, it can display the weekly and monthly percentage changes. Different colors can be set for positive or negative price increases. Also, a small customizable arrow helps to visualize the price change direction. If your broker uses an unconventional time zone, the indicator can use
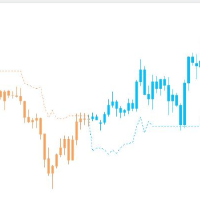
Stable trend index without clutter The index optimizes the moving average and removes the unstable clutter It can also be used in any other commodity It is best used in mainstream currencies such as EURUSD, USDJPY, GBPUSD and AUDUSD
The time period is 1 hour
I only know a little English, please forgive me if you don't understand I will always improve this indicator

Delta Aggression Volume показывает по каждой свече, кто торговал больше: агрессивные покупатели или агрессивные продавцы, на инструментах с реальными сделками, таких как B3 и фьючерсы CME. ЧТО ДЕЛАЕТ Рассчитывает дельту агрессии каждой свечи: объем агрессивных покупок минус объем агрессивных продаж. Отображает баланс каждой свечи в отдельном окне цветом победившей стороны. ТРЕБОВАНИЯ Биржевые инструменты с реальными сделками: фьючерсы и акции B3 (WIN, WDO, PETR4 …) и фьючерсы CME (ES, NQ, CL, GC
FREE
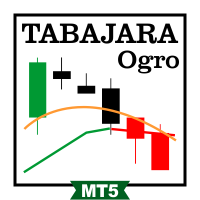
Бесплатный сетап Tabajara для B3. Торгуете WIN? Посмотрите нашего робота Trend WIN B3 . Сетап Tabajara создан бразильским трейдером, известным как «The OGRO of Wall Street». Он показывает текущий тренд и тип сделки, которую стоит искать на графике. Как это работает Индикатор сравнивает цену закрытия с 20-периодной простой скользящей средней и окрашивает свечи в 4 цвета: Зеленый: цена растет в восходящем тренде (ищите входы на покупку) Черный: цена корректируется в восходящем тренде (ищите входы
FREE
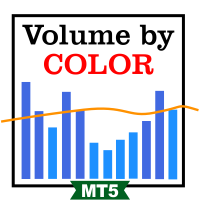
Volume By Color RSJ окрашивает бар объема в более темный цвет, когда торговый объем выше его собственной скользящей средней, поэтому свечи с необычной активностью выделяются на графике. Дополнительный четырехцветный режим показывает силу объема каждой свечи по ступеням. По умолчанию индикатор сравнивает каждый бар с 20-периодной простой средней объема. Тип и период средней можно изменить во входных параметрах. Как использовать Цветные бары позволяют легко замечать пробои, отбои и кульминационные
FREE
Описание
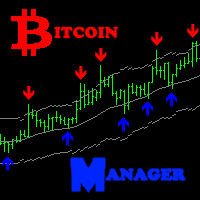
Bitcoin Manager - лучший индикатор для торговли на криптовалюте Биткоин. Он рассчитывается на базе отклонения цены от канала скользящих средних линий. Восходязие и нисходящие стрелки указывают потенциальные точки и уровни для открытия позиций на покупку и продажу.
Как использовать?
Настоятельно рекомендуем использовать этот индикатор на таймфрейме H1. Стрелка вверх указывает на уровень для покупки. Стрелка вниз - уровень для продажи.
Параметры
Maximum History Bars - максимальное к
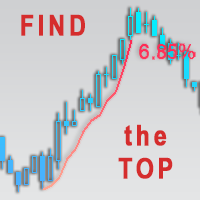
TrendMeasurer indicator manual / TMi manual Индикатор создан для помощи пользователю в нахождении точки окончания сильного трендового ценового движения. Важно - ОКОНЧАНИЕ. Не старт. Принципы работы индикатора Первый импульс цены и его последующий откат формируют некую "критическую массу", которая выступает "топливом" для дальнейшего ценового движения. Выработка этого топлива говорит о потенциальном окончании тренда. В качестве топлива может выступать как объем, так и рассчитанный определенным об
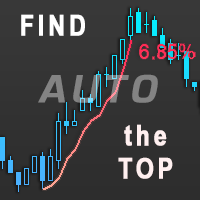
TrendMeasurer indicator / TMi Индикатор создан для помощи пользователю в нахождении точки окончания сильного трендового ценового движения. Важно - ОКОНЧАНИЕ. Не старт. Принципы работы индикатора Первый импульс цены и его последующий откат формируют некую "критическую массу", которая выступает "топливом" для дальнейшего ценового движения. Выработка этого топлива говорит о потенциальном окончании тренда. В качестве топлива может выступать как объем, так и рассчитанный определенным образом из ценов
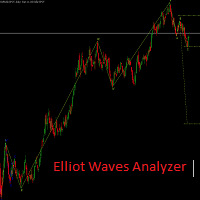
Elliot Waves Analyzer calculates Elliot Waves to Help Identify Trend direction and Entry Levels. Mainly for Swing Trading Strategies. Usually one would open a Position in trend direction for Wave 3 or a Correction for Wave C . This Indicator draws Target Levels for the current and next wave. Most important Rules for Elliot Wave Analysis are verified by the Indicator. This free version is limited for Analyzing one Timperiod Waves. Waves are Shown only in PERIOD_H4 and above. Not Useful for Intr
FREE

Индикатор рисует нормальный график, раскрашивая его в цвета, основанные на ценах, вычисленных по алгоритму индикатора Heiken Ashi. То есть, форма свечей не меняется. По сути, это тот же Heiken Ashi, который не искажает ценовой график.
Дальше будет рисунок кота, потому что больше об индикаторе писать нечего.
.
FREE

Индикатор выделяет цветом места на графике, где цена движется в одном направлении непрерывно от выбранного количества свечей. Можно указать количество пунктов от начала движения, чтобы выделять только движения от этого количества. Может быть полезно для поиска разворотов или резких импульсов.
Так же рекомендую приобрести эту утилиту, для определения локальных недельных/месячных трендов и линий поддержек и сопротивлений. https://www.mql5.com/ru/market/product/61401
FREE
For those who are fans of Bill William's strategy, here it is the Trade Zone indicator filled with alerts and a better coloring system and EA ready (BUY & SELL buffers). And for those who don't know Bill Williams work, search Amazon for the title " Trading Chaos: Maximize Profits with Proven Technical Techniques ". This indicator internally uses the widely known Awesome Oscillator along with the Accelerator indicator, and when both are aligned it lights up the candles signaling a probable strong
https://t.me/Xonxonxonxonxonxon
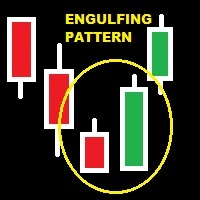
GIVE A LOOK TO MY OTHER PRODUCTS ! 100 % PER MONTH PROFIT----CONTACT ME FOR MORE INFO ! There are patterns that are more affidable then others.One of the most important is the engulfing pattern .It is very helpful to understand if there is a change of trend. This indicator find for you affidable engulfing patterns and send you an alert when a pattern is completely formed . To make this alert indicator more reliable,there is a parameter that you can change relat
FREE
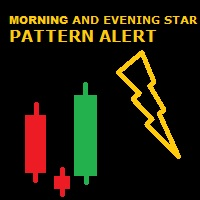
GIVE A LOOK TO MY OTHER PRODUCTS ! 100 % PER MONTH PROFIT----CONTACT ME FOR MORE INFO ! Morning and evening star are 2 famous and reliable candlestick patterns, very helpful to understand an imminent change of trend. This indicator finds for you this patterns on your chart and send you an alert just when a pattern is 100 % formed. To make this indicator more reliable,you can choose the body lenght in pips of the last bar closed ( so the reversing one ),and you can, by this ,making more or less
FREE
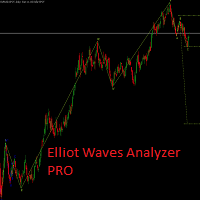
Elliot Waves Analyzer Pro calculates Elliot Waves to Help Identify Trend direction and Entry Levels. Mainly for Swing Trading Strategies. Usually one would open a Position in trend direction for Wave 3 or a Correction for Wave C . This Indicator draws Target Levels for the current and next wave. Most important Rules for Elliot Wave Analysis are verified by the Indicator. The Pro version analyzes Multiple Timeframes and shows the Subwaves and Target-Levels. For an Overview " Elliot Waves Anal

This indicator provides an original mix of WPR, VSA, and volume delta. It shows ratio of buy/sell volumes scaled on 100% range based on total volume change for a selected period. The convetional VSA (Volume Spread Analysis) studies interconnections of price action and volume change in absolute values, whereas WPR (Williams Percent Range) offers a convenient approach of price moves normalization into the fixed percentage metric: 0 - 100%. Hence overbough and oversold states are easily spotted. N
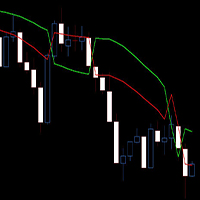
Here I present you this awesome indicator I made. This is a nique combination witch puts you in the same level as MM's. So you can surf a lot of waves and identify the rally time, breakouts, and the perfect time to get in the market. ----
The SSL Channel is a great all-rounder based on 2 Simple Moving Averages, one of recent Highs, one of recent Lows. The calculation prints a channel on the chart consisting of 2 lines. This strategy gives a Long signal when price closes above the top of thes
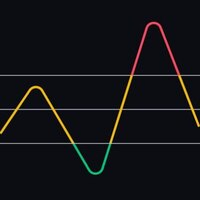
Sinal com base no indicador RSI, que indica compra marcando com uma seta verde quando o preco sai da região de sobrevendido, e sinaliza venda quando o preco sai da regiao de sobrecomprado. A sinalizacão é feita com uma seta verde para compra e seta rosa para venda. Permite configurar o nível de sobrecompra e de sobrevenda, além do período do RSI. Funciona em qualquer período gráfico.

Investment Castle Support & Resistance — автоматические уровни покупки/продажи
Перестаньте рисовать поддержку и сопротивление вручную. Этот индикатор автоматически отмечает ключевые уровни покупки и продажи и окрашивает свечи по направлению, чтобы сторона, которую предпочитает рынок, была видна с первого взгляда. Это тот же движок поддержки и сопротивления, что встроен в советник Investment Castle.
Что он делает для вас Автоматические уровни покупки/продажи: поддержка и сопротивление определяю
FREE

Инструмент для торговли бинарными опционами Отличный и надежный помощник в достижении ваших целей, этот инструмент не требует дополнительных фильтров, поскольку уже обладает всем необходимым для успеха на рынке. Отображается в виде свечей под графиком, предоставляя четкие сигналы для торговли бинарными опционами. Основная особенность: Сигнал изменения цвета свечи: Сигналы генерируются на основе изменения цвета свечи при ее открытии. Время экспирации: Экспирация в 2 минут или 2 свечей, в зависим
The indicator measures the accumulated balance of aggression.
The formula is as follows: Accumulated = Previous Candle Accumulated + Purchase Volume - Sales Volume. Know our products
*** Did you like the product? Then, help us doing review in the " Reviews " tab.
The indicator sends information to your email or cell phone when the accumulated balance changes direction. Example : Accumulated seller becomes a buyer.
Note : It is recommended to use the default configuration and VPS valu

нота: Рекомендуется использовать значения конфигурации и VPS по умолчанию. На Форексе не работает, так как использует флаги TICK_FLAG_BUY, TICK_FLAG_SELL и TICK_FLAG_LAST. Индикатор отображает объемы покупок и продаж на графике. Формируются две строки, соответствующие средним объемам покупки и продажи. Пересечение средних значений, увеличение их расстояния - хорошие индикаторы движения рынка. Параметры: Агрессия Количество дней до текущего для расчета; Разделитель объема e; Включает расчет текущ

Инструмент для определения потенциальных точек разворота и направления тренда Этот инструмент идеально подходит для выявления возможных точек разворота и направления тренда на рынке. Он прекрасно работает в сочетании с подтверждающими индикаторами, такими как MACD, Stochastic, RSI, которые являются стандартными на всех платформах MT5. Вместе с ними инструмент формирует надежную торговую стратегию. В настройках можно изменять расстояние и период канала. Рекомендуется открывать сделку, когда сигн

The indicator measures the balance of aggression.
The formula is as follows: Aggression = Purchase Volume - Sales Volume.
Note : It is rec ommended to use the default configuration and VPS values. It does not work in Forex.
Meet Our Products
Parameters : Numbers of days prior to the current one for calculation; Volume Divider e; Enables calculation of the current candle; Histogram Line style and; Size; Line Line style and; Size;
Follow us on our website to check the next news.

If You Are Discretionary Trader This Tool Is A Must Chart Switcher ------> Linking Multi-Time Frame Charts / Syncing Indicators And Drawings. Main USP Of This Indicator: Is Opening Multi-Time Frame Multiple Charts {Up To 10 Charts} Of A Symbol With Just 1 Click. You Do not Have To Save Any Template As It has Been Save Auto When You Click Same Symbol Or Move To Another Symbol. It Is Divided Into 2 Parts: 1} COMMON MODE and 2} SYMBOL MODE 1} COMMON MODE: Under This Mode, You Can Sync Commo
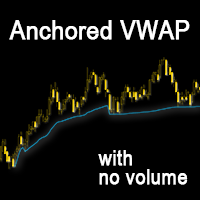
Anchored VWAP (with no Volume) Уникальное развитие одного из самых полезных индикаторов VWAP. Данный продукт позволяет уйти от использования основы VWAP, а именно от объема. Все рассчитывается без него. Дополнительно разработана удобная система выбора точек старта - перемещая "стартовое поле", Вы указываете скрипту область, в которой следует искать экстремум, от которого будет начинаться расчет. Основные преимущества данной разработки: удобная система выбора точки старта расчета VWAP с помощью и

Profit Loss Meter For the serious trader this fun easy to use indicator allows you to measure Profit and Loss of current, closed or future trades on your forex account chart. It measures Currency Pairs And Indices plus estimates margin levels at the trade close point. The Profit/Loss indicator is based on MT5 native Crosshair instrument. TO ACTIVATED USE "HOT KEYS" ctrl+f just as you would for activating the Crosshair. left click and hold then drag in the direction in which you would like to m
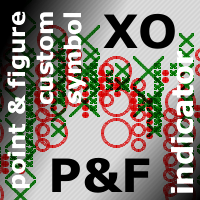
This is a bufferless indicator which can display classical X and O columns if applied on custom symbol charts built by Point-And-Figure-like generator PointFigureKagiCharts or its DEMO . The indicator will enforce a fixed price-scale on the chart to make sure the marks keep correct aspect ratio. The marks are shown only if the chart time-scale is large enough to hold them in the space allocated per bar (if the horizontal scale is one of 3 smallest ones, the indicator draws nothing and outputs a
FREE

Добрый день. Сегодня добавили вспомогательный индикатор тренда DveMashkiTompson, идея взята из аналога МТ4 и перенесена на МТ5, используется совместно с индикаторами Тренда ТМА и МА, рисует красные и зеленые области в зависимости от направления рынка. Тренд вверх -зеленые области, тренд вниз -красные.Области основываются на пересечении индикатора МА, таким образом данный индикатор дает информацию графического содержания для более быстрой оценки ситуации и принятия решения.
FREE

Automatic Fibonacci Tool Fibonacci retracements is a popular instrument used by technical analysts to determine potential Support and Resistance areas. In technical analysis, this tool is created by taking two extreme points (usually a peak and a minimum) on the chart and dividing the vertical distance by the key Fibonacci coefficients equal to 23.6%, 38.2%, 50%, 61.8%, and 100%. Our Automatic Fibonacci Tool is programmed to make thigs easier. Using this tool, there is no need to explicitly set
Advanced Support and Resistance Support and resistance levels are widely used in trading. They are important as they show some key price levels. Before applying any strategy, one may consider it necessary to draw support and resistance. However, this process can take much time especially if one is to analyse a lot of currency pairs, commodities or indices. This Advanced Support and Resistance tool was designed for traders at any level, amateur to professional. It plots key support and resistance
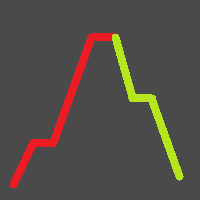
根据高开低收价格确定反转点位,画出的极点折线。 The pole polyline is drawn according to the high opening and low closing price to determine the reversal point.
参数(Args):
1.周期数(Period)。参与界限计算的K柱数量。 2.界限(Divide)。计算方式包括: t1,顺高低价 (Buy min H,Sell max L) t2,逆高低价 (Buy min L,Sell max H) t3,收盘价 (Buy min C,Sell max C) t4,开盘价 (Buy min O,Sell max O) t5,高开低收价的一半 (HOLC/2) t6,高开低收价的一半+1 (HOLC/2+1) t7,高开低收价的一半+2 (HOLC/2+2) 3.跨越界限使用的价格(Price)。包括收盘价(C)和高低价(HL) 4.偏移(Of

This indicator calculates Correlation among currency pairs (Selected by user) to find the least and/or most correlated symbols in real time. Correlation ranges from -100% to +100%, where -100% represents currencies moving in opposite directions (negative correlation) and +100% represents currencies moving in the same direction.
Note The Correlation more than 80 (Adjustable) between two currency pairs, Shows that they are quite similar in the kind of movement and side. The Correlation less than
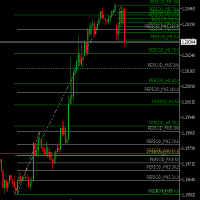
Sets and Updates Fibo-Retracemnet-Levels for Multi Timeframes. Helps to Find TradeZones combined over Multi-Timeframes. M1 M5 M15 H1 H4 D1 are analyzed and shown. Color Changes as soon 161 and 261 Retracements are reached to visualize possible Targets/ TakeProfit Zones . No Settings for Indicator available . Fibonacci retracements are set using a fixed Logic.

Hi-Lo - это индикатор, цель которого - более точно определять тенденции данного актива, указывая, таким образом, на возможное лучшее время для покупки или продажи.
Что такое хай-лоу?
Hi-Lo - это термин, полученный из английского языка, где Hi связано со словом High, а Lo - со словом Low. Это индикатор тренда, используемый для оценки торговли активами на финансовом рынке.
Следовательно, его использование дается для определения того, показывает ли конкретный актив восходящий или понижательный
FREE
Данный индикатор вычисляет формулу MACD для объемо-ориентированных индикаторов Accumulation/Distribution и OnBalance Volumes . Помимо тиковых объемов он поддерживает расчеты со специальными псевдо-реальными объемами, эмулируемыми для символов Форекс, где реальные объемы не известны. Подробности о данных "суррогатных" объемах можно узнать в описании других индикаторов - TrueVolumeSurrogate и OnBalanceVolumeSurrogate (алгоритм последнего используется внутри MACDAD для подготовки значений AD и OBV
TOPOS INDICATOR AND HISTORIC BACKGROUNDS The Indicator of historical tops and backgrounds is based on the monthly chart where sharks hide so it was developed to facilitate the identification of these regions. The available features are the Incoming Triggers alerts and notifications that are sent to the mobile phone. Parameters 1-) Tops and Bottoms: You can change the color of the lines and the period in years and the filter range between the top and bottom and the median and consider th
FREE

Plucking Machine
Plucking Machine is a trend indicator designed specifically for gold and can also be used on any financial instrument. The indicator does not redraw and does not lag. Recommended time frame H1. The current setting is applicable for all time periods. It shows the current direction of the market based on price movements. Corresponding products of indicators: https://www.mql5.com/zh/market/product/61388?source=Site+Market+Product+Page#description
The brother Indicator : http

GIVE A LOOK TO MY OTHER PRODUCTS ! LOOK AT THIS SIGNAL : Strategies Double MA Cross Alert,is a cool indicator that notificate you directly on your telephone or email when 2 Moving average ( you choose the parameters ) crosses. This is very important when you want to know a change of trend and you can't stay in front of your pc! The indicator give you the alert just when the next bar opens ,so give you a more accurate entry. Please ask me for more info...
Happy trading ! :)
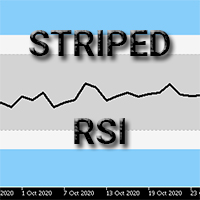
This indicator is a basic RSI but comes up with a useful feature.
You can set zones within the RSI and these zones can be displayed with different background colours. (You can see on the pictures below) You need to set the zone ranges and their colours at the input parameters. Six different zones can be set.
Should you have any questions or comments, feel free to contact me.
FREE
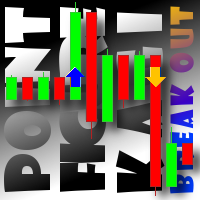
This indicator displays breakouts on Point-And-Figure-like or Kagi-like custom symbol charts, generated by special expert advisers, such as PointFigureKagiCharts . This indicator is applicable only for custom instruments generated in appropriate way (with time-invariant bars which are multiples of a predefined box size). It makes no sense to apply it to other charts. The breakouts in up or down direction are marked by arrows. The breakout price is found at crossing of one of imaginary lines of
FREE

PROMOTIONAL OFFER. NEXT PRICE WOULD BE 125 USD.
HAWA is pleased to introduce Price Action Setup indicator for all symbols with high success rate. It's advanced algorithm finds the spots for you where smart money is moving in or out of the market. Indicator will produce signals with pre-calculated entry and exit levels keeping money management in place. The system aims to achieve small, steady and consistent profits and reduce losses.
Unique Features: High Probability Success rate. Steady pro

Бесплатный MACD с пропорциями Фибоначчи для внутридневных трендов. Нужны оповещения и полный набор? MACD Intraday Trend PRO MACD Intraday Trend - это индикатор, разработанный на основе адаптации оригинального MACD, созданного Джеральдом Аппелем в 1960-х годах.
За годы торговли было замечено, что, изменяя параметры MACD с пропорциями Фибоначчи, мы достигаем лучшего представления непрерывности движений тренда, что позволяет более эффективно определять начало и конец ценового тренда.
Благодаря св
FREE

Индикатор работает по системе Черепах и классически предполагает временной интервал 20 и 55 свеч. На заданном временном интервале отслеживается тренд. Вход осуществляется в момент пробоя уровня поддержки или сопротивления. Сигнал выхода – пробой цены в обратном направлении тренда того же временного интервала. Преимущества:
Инструменты: Валютные пары, акции, сырьевые товары, индексы, криптовалюты Таймфрейм: Классически D1, также подходит для работы с любыми таймфреймами Время торговли: круглосу
FREE
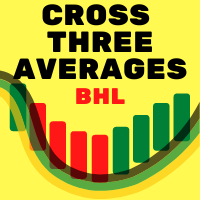
This indicator is based on the system of three moving averages where: First is the fast average (MA1); Second is the intermediate average (MA2) and; T hird is the slow average (MA3). The theory covered in the technical analysis books informs us that when the first average exceeds the second average it is an alert for the trader, however the movement occurs when the second average exceeds the third. The indicator will insert the check s Parameters : Averages : Period Fast Moving Average(FMA); Smo
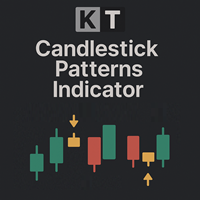
A candlestick pattern indicator for MetaTrader that shows you which patterns are worth trading on your symbol. It marks 24 Japanese candlestick patterns and writes on the chart how many pips price moved after every signal. A panel in the corner of the chart turns those results into a record: total signals, wins, success rate and average pips per signal, measured against the target you set. You see what each pattern did on your symbol and timeframe before you take the next one. What you get 24 ca
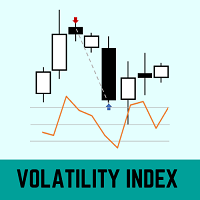
This indicator uses historical volatility and a 21-period moving average to define the price distortion in relation to the average.
The calculation of historical volatility was based on the book (Odds: The Key to 90% Winners) written by Don Fishback.
A Volatility Index with a value greater than 30 may indicate that the price is distorted from its fair price.
QUESTIONS ABOUT THE INSTALLATION OF PRODUCTS AT META TRADER You can also find some instructions on how to install a robot in the Me
FREE

FXC iMACD-DivergencE MT5 Indicator
This is an advanced MACD indicator that finds trend-turn divergences on the current symbol. The indicator detects divergence between the MACD and the price movements as a strong trend-turn pattern.
Main features: Advanced divergence settings
Price based on Close, Open or High/Low prices Give Buy/Sell open signals PUSH notifications
E-mail sending Pop-up alert Customizeable Information panel Input parameters: MACD Fast-EMA: The Fast-EMA variable of the MACD indi
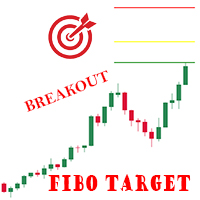
Indicator shows 3 Fibonacci expansion levels, based on the last pivot breakout. Pivots are calculated based on volatility (ATR), works on every Timeframe and Symbol. Lines are displayed only after the pivot breakout. A comment on the upper left side shows the minimum calculated value (in points) for pivots. Parameters: Variation: minimum variation for the pivot. ATR multiplication factor. (default 3) ATR Period: Period for ATR value calculations. (default 60)
Ex.: ATR on TimeFrame H1 = 100poi

Leave a review for this product, and receive another "Free" product that you choose. You can see my other products here: https://www.mql5.com/en/users/zakri/seller
Harmonic Patterns Detector indicator draws harmonic patterns on chart. Harmonic patterns have a high hit-rate of around 80% and are excellent for trade entries. They are used as price reversal points. Some of them have a long history of usage and were created by famous traders like H. M. Gartley. Many harmonic patterns are included
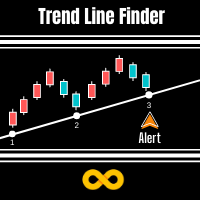
Trend Line Finder will project forward a support and resistance lines using 2 previous highs for resistance and 2 previous lows for support. It will then signal to the trader by alert making the trader more aware that a possible good move is about to happen. This is not a stand-alone trading system but is very useful in finding key areas of support resistance levels where price will usually either rebound from or breakthrough. Its down to the trader to decide what to do with use of other s
Мультивалютный индикатор в отдельном окне отображает движение валютных пар в пунктах с расхождением от начала дня. Во время работы, динамически возможно включать и отключать различные пары прямо на графике. При первом запуске, возможно, потребуется продолжительное время, пока загрузиться история для основных валютных пар. Для валют CAD, CHF, JPY - график перевернут.
При повторном открытии, все настройки индикатора восстанавливаются автоматически.
FREE
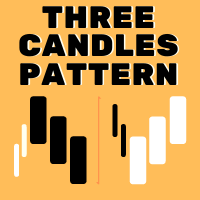
The patterns of 3 (three) Candles:
Three White Soldiers; Three Black Crows; These are reversal patterns widely used by traders, as they have a high probability of showing the inversion of the current market movement. For example, if in a bullish trend there are three black crows, there is a high probability of reversing the current bullish movement.
The Three White Soldiers have the following characteristics: There are 3 consecutive candles with a good body, that is, the difference between th

RSI ALARM - Индикатор RSI с динамическими уровнями и оповещениями RSI ALARM — это улучшенный индикатор относительной силы для MetaTrader, разработанный для трейдеров, стремящихся зафиксировать экстремумы перекупленности и перепроданности. В отличие от стандартных версий, он включает динамические и интерактивные линии уровней, которые можно свободно перетаскивать по графику для настройки зон активации в реальном времени, предлагая мгновенные оповещения на платформе и на мобильном устройстве вмес

При анализе финансовых временных рядов исследователи чаще всего делают предварительное допущение о том, что цены распределены по нормальному (гауссовскому) закону. Такой подход обусловлен тем, что с помощью нормального распределения можно моделировать большое число реальных процессов. Кроме того, вычисление параметров этого распределения не представляет больших трудностей. Однако в применении к финансовым рынкам нормальное распределение работает далеко не всегда. Доходности финансовых инструмен

Индикатор IndicateMe был специально создан, чтобы убирать как можно больше шума из сигналов, которые он подает.
Индикатор был объединен с несколькими другими хорошо известными индикаторами. Использованные индикаторы: «Скользящая средняя, стоастический индикатор, индекс относительной силы, скользящая».
Все используемые индикаторы можно настроить самостоятельно. По умолчанию установлены те значения, которые мне нравятся.
Легко настраивайте оповещения, чтобы всегда быть в курсе сигналов инди
Описание
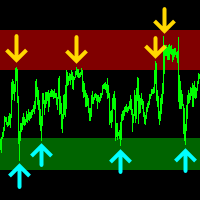
Money Zones - индикатор, определяющий зоны накопления/распределения на рынке. Зеленые зоны позволяют искать точки входа в покупку или точки выхода из продажи. Красные зоны, напротив, определяют возможность продажи или закрытия покупок. Индикатор имеет возможность определять денежные зоны для двух временных интервалов одновременно на одном графике.
Как использовать?
Используйте этот индикатор, чтобы определить рыночные зоны как зоны поддержки/сопротивления, чтобы определить наилучшие

CANDLESTICK_MT5
Очень интересный индикатор свечных паттернов, конвертированный из бесплатной версии индикатора CANDLESTICK для терминала MetaTrader4 в версию для терминала MetaTrader5. Помимо свечных паттернов, он рисует линии поддержки и сопротивления, которые отлично отрабатываются ценой на графике. Может работать на любом таймфрейме. Имеет простые настройки. При конвертировании были максимально сохранены логика работы и дизайн оригинального индикатора CANDLESTICK для терминала МТ4.
FREE
The Market Thermometer can be used to help traders identify sleepy or turbulent periods. It helps beginners to check when is the ideal time to enter operations, that is, when the value of the thermometer is below its average for several periods, identifying a peaceful market. When the market is heated, that is, the thermometer is above three times its average, it is time to make profits. The Thermometer measures the extent to which the end of a period, maximum or minimum price, projects out
FREE
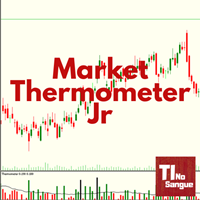
The Market Thermometer can be used to help traders identify sleepy or turbulent periods.
It helps beginners to check when is the ideal time to enter operations, that is, when the value of the thermometer is below its average for several periods, identifying a peaceful market. When the market is heated, that is, the thermometer is above three times its average, it is time to make profits. The Thermometer measures the extent to which the end of a period, maximum or minimum price, projects outsid
FREE
You probably won't see the power of the indicator in the backtest, because it uses 3 windows, something you can't do, in the DEMO version that the site offers. I trust 100% on my work and on my indicator, if you want a test version, send me a message, different from other sellers, who just want to "sell", I want whether you have a full version before renting and deciding. Christmas Discount 30% off until the 25th As you can imagine, it was a failure, I'm not saying that any indicator doesn't w
This indicator displays volume delta (of either tick volume or real volume) encoded in a custom symbol, generated by special expert advisers, such as RenkoFromRealTicks . MetaTrader does not allow negative values in the volumes, this is why we need to encode deltas in a special way, and then use CustomVolumeDelta indicator to decode and display the deltas. This indicator is applicable only for custom instruments generated in appropriate way (with signed volumes encoded). It makes no sense to ap
FREE

GIVE A LOOK TO MY OTHER PRODUCTS ! 100 % PER MONTH PROFIT----CONTACT ME FOR MORE INFO ! BROKEN TRENDLINE ALERT IS A SIMPLE TOOL INDICATOR. JUST DRAW IN YOUR CHART A DYNAMIC OR STATIC TRENDLINE,AND THE INDICATOR WILL SEND YOU ALERT WHENEVER THE PRICE CROSSES BELOW OR ABOVE YOUR DRAWN TRENDLINE. IT WORKS IN ANY TIMEFRAME AND ANY CHART YOU WANT.JUST GOT A VPS AND DON'T STRESS IN FRONT OF YOUR COMPUTER.
FOR ANY KIND OF QUESTION ,FEEL FREE TO CONTACT ME!
HAPPY TRADING :)

The Market Sessions Indicator for MT5 helps you predict market turnarounds by detecting major supply and demand areas. These pivot points tend to occur after a new session has started and the previous one is still open. It is also used to gauge how many points or pips the market moves on average during a session. This helps us to place better our take profits and stop losses. The indicator works on all forex pairs, gold, silver, commodities, stocks, indices and any other instrument that your

GIVE A LOOK TO MY OTHER PRODUCTS ! 100 % PER MONTH PROFIT----CONTACT ME FOR MORE INFO ! MACD Cross Alert is a tool indicator that notificate directly to your phone whenever the signal line crosses the base line. For more accurate signals,crosses are filtered like this : Buy Signal : SIGNAL LINE CROSSES ABOVE BASE LINE AND BOTH ARE ABOVE THE 0 VALUE Sell Signal : SIGNAL LINE CROSSES BELOW BASE LINE AND BOTH ARE BELOW THE 0 VALUE
The parameters of MACD are customizable to your pr

GIVE A LOOK TO MY OTHER PRODUCTS ! 100 % PER MONTH PROFIT----CONTACT ME FOR MORE INFO ! Breakout Wall is a very cool indicator. It paints a resistance and a support in the chart given by a " n " number of candles ( you can choose the parameter ),and give you an alert when a candle closes below a support or above a resistance.Very important tool if you trade daily candles for example..... Just close your pc and don't stress in front of the charts!You can attach the indicator in ever
MetaTrader Маркет - единственный магазин, где можно скачать демоверсию торгового робота и подвергнуть его проверке и даже оптимизации на исторических данных.
Прочитайте описание и отзывы других покупателей на заинтересовавший вас продукт, скачайте его прямо в терминал и узнайте, как протестировать торгового робота перед покупкой. Только у нас вы можете получить представление о программе, не заплатив за неё.

Вы упускаете торговые возможности:
- Бесплатные приложения для трейдинга
- 8 000+ сигналов для копирования
- Экономические новости для анализа финансовых рынков
Регистрация
Вход
Вы принимаете политику сайта и условия использования
Если у вас нет учетной записи, зарегистрируйтесь