Смотри обучающее видео по маркету на YouTube
Как купить торгового робота или индикатор
Запусти робота на
виртуальном хостинге
виртуальном хостинге
Протестируй индикатор/робота перед покупкой
Хочешь зарабатывать в Маркете?
Как подать продукт, чтобы его покупали
Новые технические индикаторы для MetaTrader 5 - 16
Extreme Price Meter На основе исторической рыночной информации индикатор рассчитывает, каким будет следующий ценовой экстремум с высокой вероятностью разворота. Он генерирует 2 ценовых диапазона, где высока вероятность покупки или продажи. Легко убедиться в высокой точности индикатора, учитывая стрелки, которые он выставляет, когда свеча закрывается за пределами полос вероятности. Уведомления для рабочего стола, телефона и электронной почты.

** All Symbols x All Timeframes scan just by pressing scanner button ** *** Contact me after the purchase to send you instructions and add you in "Wolfe Wave Scanner group" for sharing or seeing experiences with other users.
Introduction: A Wolfe Wave is created with five-wave patterns in price. It shows supply and demand and a fight towards a balance price. T hese waves of price actions can help traders identify the boundaries of the trend . Also It helps forecast how the price will mo

Добро пожаловать в индикатор распознавания Ultimate Harmonic Patterns Этот индикатор обнаруживает паттерн Гартли, паттерн Летучая мышь и паттерн Сайфер на основе HH и LL ценовой структуры и уровней Фибоначчи, и когда определенные уровни Фибоначчи встречаются, индикатор показывает паттерн на графике, Этот индикатор представляет собой комбинацию трех других моих индикаторов, которые обнаруживают сложные паттерны. Функции : Усовершенствованный алгоритм обнаружения паттерна с высокой точностью. Обна

T he most Flexible & Reliable Trend-Based Fibonacci indicator by Safe Trading. This indicator helps you calculate Trend-Based Fibonacci levels base on the main and retracement trends to predict future price . If you just looking for a simple Fibonacci Retracement indicator, please use this Free indicator .
### FEATURES ### Auto-calculate up to 7 Trend-Based Fibonacci levels on adjustable frame. Adjust Fibonacci levels as your need. Adjust the start and the end of calculated frame
FREE

TransitTrendlines this is a automatically trendline drawer, it draw both horizontal and diagonal trendlines. The horizontal trendlines are the pivot points of the day timeframe and the diagonal trendlines are based on the current time frames. You can adjust the diagonal trendlines by increasing the number of bars to draw the diagonal trendline and can also adjust the steepness. Note that the Horizontal trendlines are based on the day pivot points not currant time frame. Join mql5 transitbk98 cha
FREE

Media Band é um indicador que projeta 8 bandas paralelas a uma media movel de referencia. Podendo auxiliar na visualização da volatilidade do mercado financeiro. Este indicador foi inspirado na necessidade de avaliar melhor uma boa oportunidade de compra e venda dos ativos de acordo com o "seu" operacional. Não pode ser utilizado como recomendação e sim a fins de estudos do Mercado Financeiro.
FREE
This is MT5 version of StochScanner It scans Stochastic from Multi Symbols and Multi Timeframes and displayed on the dashboard on a single chart. . 4 scanning modes: 1. Mode OverBought/OverSold Indicator scans Overbought and OverSold . OverBought : current stochastic is above level 80 and OverSold : current stochastic is below level 20 2. Mode Signal It means if the previous stochastic is on OverBought or OverSold ( either Main Line and Signal Line ) and the current Main Line cross over the curr

The Advanced Pivot Point Indicator is a powerful tool designed to help traders identify key support and resistance levels in the market. This versatile indicator offers a customizable and user-friendly interface, allowing traders to select from five different pivot point calculation methods: Floor, Woodie, Camarilla, Tom DeMark, and Fibonacci. With its easy-to-read lines for pivot points (PP), support (S1, S2, S3, S4), and resistance (R1, R2, R3, R4) levels, the Advanced Pivot Point Indicator pr
FREE

OHLC Volume Histogram displays the difference between two streams of the OHLC Volume volume indicator as a colored histogram. There are no input parameters. Calculation: Histogram = StreamUP - StreamDN where: StreamUP = Volume * UP_Coeff / (UP_Coeff+DN_Coeff) StreamDN = Volume * DN_Coeff / (UP_Coeff+DN_Coeff) UP_Coeff = High-Open DN_Coeff = Close-Low Volume - tick volume

What Is Moving Average Convergence/Divergence (MACD)? Moving average convergence/divergence (MACD, or MAC-D) is a trend-following momentum indicator that shows the relationship between two exponential moving averages (EMAs) of a security’s price. The MACD line is calculated by subtracting the 26-period EMA from the 12-period EMA. The result of that calculation is the MACD line. A nine-day EMA of the MACD line is called the signal line, which is then plotted on top of the MACD line,

“Multi timeframe Slow Volume Strength Index” shows data of three SVSI indicators from different timeframes on the current chart. The indicator has nine adjustable parameters: EMA period – EMA SVSI calculation period Smoothing – SVSI smoothing period Overbought – overbought level Middle – middle line Oversold – oversold level Drawing mode – indicator drawing type Steps – as a ladder Slope – sloping lines First SVSI timeframe – the timeframe of the first SVSI Second SVSI timeframe – th
The Bounce strength indicator (BSI) for meta trader 5 illustrates the strength of the market bounce. The +10 and -10 extreme bounds are used by the indicator. The blue bars show a bullish bounce, while the pink bars show a bearish bounce. The indicator, in essence, depicts market volatility for both up and down moves. When utilized appropriately, the indicator performs equally well on all currency pairs and produces encouraging returns.

Se você está procurando uma maneira de melhorar seus resultados de negociação, então o indicador VWAPiEagleVision é o que você precisa! Este robô é programado para rastrear o VWAP em tempo real e usar essas informações para identificar tendências e oportunidades de negociação lucrativas.
O VWAP (Volume Weighted Average Price) é um indicador amplamente utilizado pelos traders para determinar o preço médio ponderado pelo volume negociado. Ele é comumente usado por traders institucionais e pode
FREE
Индикатор времени до конца свечи. Показывает время до конца свечи, а также время сервера. Текст может отображать тренд или направление свечи, встроены звуковые уведомления Особенности:
Отображает время до конца текущей свечи а также по другим таймфреймам, которые можно отрегулировать или отключить при необходимости AW Candle Time может отобрать направление текущей свечи или тренд с индикатору AW Super Trend Трендовая стратегия выделяется выбранным цветом Встроено звуковое уведомление и дополни
FREE

Анализ проскальзывания, предназначенный для высокоточной торговли и всего рынка Он работает как на реальных, так и на демо-счетах и позволяет анализировать все ваши позиции с тейк-профитом и стоп-лоссом, чтобы вы могли анализировать проскальзывание вашего брокера.
Что такое проскальзывание в торговле? Проскальзывание или скольжение — это разница в цене, которая может возникнуть между моментом размещения торгового ордера и его фактическим исполнением на рынке.
Это связано с тем, что с моме
FREE

The 'Supertrend MetaTrader 5' indicator is the basis of the simplest trend trading system. And yet it remains very effective. The indicator works on any timeframe (on the timeframe of the current chart). From the name you can see that this indicator follows the trend, and when the trend changes, the indicator accurately shows the point of the trend change. The basis of 'Supertrend MetaTrader 5' is comparing price and 'Average True Range indicator' values multiplied by a multiplier (there is als

Just another Auto Fibonacci Retracement indicator . However, this is the most Flexible & Reliable one you can find for FREE. If you use this indicator and you like it, please leave a review/comment. If you are looking for a more advanced Fibo indicator, check this Free Trend-Based Fibo indicator . ### FEATURES ### Auto-calculate up to 7 Fibonacci levels on your customized frame. Adjust levels as your need. Use High/Low price or Open/Close price to calculate. Freeze the levels and don
FREE

"AV Monitor MT5" is an indicator for MetaTrader 5, which alowes a history analysis of the closed orders. It helps to achieve a quick visual analysis of your own trading or different expert advisors among themselves. Compare and analyze your expert advisors: Which one is the best?
I use an "AV Monitor MT5" indicator per running expert advisor chart to track its performance split into long & short, as well as an index chart e.g. DOW with this indicator and the setting "Show Balance & Equity" to

Measures the average price and Maximum Stop Loss accepted, adjustable Measures too the projected average price (For Pending entrys), in case you have a open position and pending orders to scale in shows how much it will increase or decrease the average price after fullfilling that pending orders! It shows too the Stop Loss based on the projected average entry, how much it has to be stoped out to fullfill your risk management, after fullfilling that pending orders
FREE

Мультитаймфреймовый трендовый индикатор, на основе индикатора ADX / ADXWilder c уровнями Фибоначчи Индикатор показывает трендовые участки, используя данные индикатора ADX или ADXWilder с нескольких таймфреймов. Импульсный режим индикатора позволяет поймать начало тренда, а несколько "Экранов" с разными таймфреймами позволяют отфильтровать рыночный шум. На график цены добавляются уровни Фибоначчи, которые имеют гибкие настройки.
Принцип работы индикатора: если PDI больше NDI, то устанавливается
FREE

Finally a Metatrader version of the very popular (and expensive) Market Cipher B indicator, or the Vumanchu Cipher B + Divergences very popular on Tradingview platform.
This tool is very heavy on calculations, total are 31 plots using 97 buffers from several indicators. On my mid end computer, timeframes below M15 start getting a bit laggy, so it would require a powerful computer to run it properly at very low timeframes. It's still usable here, but somewhat sluggish response in Metatrader (l
FREE

This indicator is an automated version of the Fibonacci retracement (Fib) indicator. Deciding the best areas to use when drawing the fib can be tricky and this indicator was made with that in mind. When you drop it on the chart it will automatically choose the best points to draw the fib with, but in case you aren't satisfied with those regions, you can adjust it as you wish.
FREE

The fact that round number levels have a significant influence on the market cannot be denied and should not be overlooked. These psychological levels are used by both retail Forex traders and major banks that deal in Forex. Very simple and effective indicator and most importantly free. ////////////////////////////////////////////////////////////////////////////////////////////////////////////////////////////////////////////////////////////// The program does not work in the strategy tester.
FREE

Мультитаймфреймовый трендовый индикатор, на основе индикатора ADX / ADXWilder Индикатор показывает трендовые участки, используя данные индикатора ADX или ADXWilder с нескольких таймфреймов. Импульсный режим индикатора позволяет поймать начало тренда, а несколько "Экранов" с разными таймфреймами позволяют отфильтровать рыночный шум.
Принцип работы индикатора: если PDI больше NDI, то устанавливается бычье движение; если PDI меньше NDI, то устанавливается медвежье движение; для определения какого
FREE

The Advanced Momentum Trend indicator is an indicator used to determine trend directions. It determines the trends by considering many factors while calculating the trend. You can use this indicator as a trend indicator or in combination with other indicators that suit your strategy. You can also use it as a stand-alone trend filtering. Thanks to the alert feature, you can instantly learn about the new trends. To View Our Other Products Go to the link: Other Products

Price Stellar! is a bot that has the strategy of grabbing rebounds on the roofs or floors of the Yellow channel, accompanying an ema to hunt the bullish or bearish trend, It can be seen very clearly in the photo what the strategy is about works for all seasons to scalp and long works for all forex pairs and for the pairs of synthetic indices ! from now to enjoy good profit World Investor.

Trend Uranus! It is an indicator that works in line with support and resistance, giving entrances with the roofs and floors Red (Sale) Green (Buy) to catch a better trend ideal for scalping in the Volatility 75! works for all synthetic index pairs ! and for all forex pairs! ideal for the pair Eur/Usd, Usd/Jpy! from now to enjoy good profit!!!!! World Investor.

Arrow Venus! is an oscillator that uses the strategy of crosses capturing the entry whether for sale or purchase where it can be seen in the photo, when the line crosses the blue line with the red one, marking the red arrow it's sale, when the blue line crosses the red one upwards and marks the blue arrow, it is a buy signal very good for scalping and long! used at any time for forex markets and synthetic indices

Fibo expert! It is an automatic fibonacci indicator. adapting to any temporality, to catch those rebounds, or the path of that trend, special to make longs in H1 or H4 clear the trend, but it also works for scalp in m1 up to m15 works for all forex pairs and for all pairs of synthetic indices, ideal for volatility 75 in synthetics no more to enjoy good profit World Investor.

Stock Mantra It is an oscillator that is used to hunt long trends, as can be seen in the mantra, it gives input when the lines are crossed, the blue line above crossing the red line gives entry for sale, When it is the other way around, crossing the blue line, the red one up gives a buy entry signal. super simple and effective! works for all forex pairs and synthetic indices! used in all seasons good profit World Investor
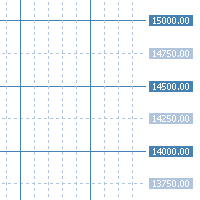
"AV Grid MT5" is an indicator for MetaTrader 5, which automatically displays round numbers as horizontal lines and a sensible period separation .
Round prices can be used as support and resistance in trading.
It is an improvement on the "Grid" setting, which also draws a grid on the chart.
Improvements :
- Round levels instead of arbitrary positioning of the horizontals
- Structure by highlighting all x lines (main lines, 2 or 5 makes sense)
- Vertical lines are each in two p

El indicador "Time Broker Deriv" está diseñado específicamente para su uso en los índices sintéticos Boom y Crash, así como en otros pares de trading disponibles en la plataforma MT5. Su función principal es proporcionar la hora del broker en comparación con nuestra hora local. Es importante destacar que el indicador "Time Broker Deriv" solo muestra la hora del broker.
FREE
Count on our trend tracker to carry out your operations!
Operational Green is BUY and Pink is SELL! Enter the operation after closing the first color block!
Developed and Tested on the 5 or 15 minute Chart for Mini Index and Mini Dollar!
Can be used on any chart!
Editable colors and period!
“All strategies and investments involve risk of loss. No information contained in this channel should be interpreted as a guarantee of results or investment recommendation!”

This creative simple indicator will provide a precise framework for market sentiment within technical analysis of different timeframes. For instance, for traders like me that uses "Mark Fisher" strategy regularly, this is a perfect indicator for having an insight to markets from short term to long term point of view, using Break points of candles' lows and highs and perfect to combine with "Price Action" . For more options and modifications you can also edit the low timeframe candles withi
FREE

Bollinger Bands based on Returns This indicator characterizes the price and volatility by providing a channel/band of standard deviations like the Bollinger Bands. In contrary to standard Bollinger Bands which uses price directly, this indicator uses returns due to normalization. The standard Bollinger Bands based on price directly, were one of the first quant or statistical methods for retail traders available. The issue with these bands, standard deviations can only be calculated, if the u

The indicator is getting the four most important trading sessions: New York London Sydney
Tokyo The indicator auto calculate the GMT time. The indicator has buffers that can be used to get the current session and the GMT.
You can use it as stand alone indicator and you can turn the draw off and call it from your EA. INPUTS Max Day: Max days back to get/draw. London Session On: Show/Hide London Session. New York Session On: Show/Hide New York Session. Sydney Session On: Show/Hide Sydney Sessi
FREE

HiLo Trend Matrix is an advanced multi-timeframe trend indicator that scans and analyzes multiple timeframes to determine the overall trend direction, allowing you to effortlessly ride the trend waves as they emerge. By scanning the four higher timeframes, starting from your current timeframe or a selected one from the input parameters, you'll always have a comprehensive view of the market's movements. And when the trend aligns, the HiLo Trend Matrix delivers an alert, so you can seize the oppo

(Перевод Google) Стандартное представление свечи Heikin Ashi имеет значение открытия, эквивалентное экспоненциальному показателю. Скользящее среднее (EMA) от Общей цены , из которых альфа значение EMA является фиксированным с периодом 0,5 (эквивалентно периоду EMA 3,0). В этой динамической версии период может быть изменен на любое значение, которое вы хотите использовать, что также позволяет приблизительный анализ нескольких таймфреймов или используйте минимальное или максимальное значение в кач
FREE

This Indicator is based on 4 Exponential Moving Averages ie. 3 EMA-32 (applied to prices close, high & low), and EMA-200 (indicating trend direction). The EMA32-200 produces quality buy and sell entries indicated by arrows and signal alert that appears whenever the price moves above the EMA-200 and returns below the EMA-32s and returns to break above the previous swing high triggering a high probability buy entry. The Sell conditions are the opposite of the buy conditions.
FREE

"Scalper Channel MT5" это современный канальный индикатор, показывающий трейдеру направление торговли. Для работы индикатор использует встроенные и собственные технические средства и новую секретную формулу. Загрузите его на график и индикатор цветом покажет вам направление входа: Если верхняя граница ценового канала индикатора синего цвета - открывайте позицию на покупку. Если нижняя граница ценового канала индикатора красного цвета - открывайте позицию на продажу. Если граница индикатора серог

Этот индикатор подходит для проведения торгов на паре и еще много других.Сам индикатор использует универсальные расчеты дополнительной точности, но пока они оптимизированы под некоторые валютные пары. Множество настроек можно настраивать на главном меню . Свои расчеты он отображает на графике в ввиде значков. Значки бывают двух видов.В тестере работает отлично по умолчанию в настройках. Можно указать цвет для его значков. Имееться панелька. Удачных торгов.

MACD (short for Moving Average Convergence/Divergence) is one of the most famous and oldest indicators ever created and is widely used among beginners . However, there is a newer version of the MACD that is named Impulse MACD which have less false signals than the standard MACD. Classic MACD helps us to identify potential trends by displaying crossovers between two lines. If MACD line crosses above the Signal line it shows us that the market is potentially up trending and that

Трендовый индикатор на основе индикатора ADX / ADXWilder
Индикатор показывает трендовые участки, используя данные индикатора ADX или ADXWilder.
Принцип работы индикатора: если PDI больше NDI, то устанавливается бычье движение; если PDI меньше NDI, то устанавливается медвежье движение; если ADX меньше либо равен значению фильтра, указанного в параметрах, то состояние движения отсутствует.
Входные параметры индикатора: Calculate Timeframe - таймфрейм для расчета; ADX Type - тип расчета ADX,
FREE

The 3 Candlestick Engulf indicator is a candlestick pattern indicator that considers the last 3 bearish candles for a Bullish Engulf candlestick pattern signal and last 3 bullish candlesticks followed by a Bearish Engulf candlestick pattern for a bearish signal. Engulfs are also presented in both trending and non-trending situations of the market though recommended to move with signals that are in line with the trend basing on the moving average. The indicator has multiple input features that yo
FREE

This is an indicator that shows total pips ,order counts and the total profit accumulated for the open orders of the pair attached. The colors change depending on if the total profit is positive , negative or zero. Contact:
If you have some questions or if you need help, kindly contact me via Private Message. Author: A.L.I, fintech software engineer and a passionate forex trader.
FREE

Shows min and max of last M5 Candle. Can be used to trade breakouts of last M5 candle. The M5 Candle Breakout Strategy avoids to stay too long in a sindways phase. See documentation on @swisstrader3713, where you can follow my live trading. The only parameters are the color of the lines defining the M5 stretch. Best use the indicator in M1 timeframe. The M5 Breakout Strategy has helped me to reduce overtrading.
FREE

Automatically detect bullish or bearish order blocks to optimize your trade entries with our powerful indicator. Ideal for traders following ICT (The Inner Circle Trader). Works with any asset type, including cryptocurrencies, stocks, and forex. Displays order blocks on multiple timeframes, from M2 to W1. Alerts you when an order block is detected, migrated, or a higher timeframe order block is created/migrated. Perfect for both scalping and swing trading. Enhanced by strong VSA (Volume Spread A
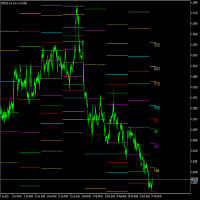
Fibonacci Pivots is a multi-timeframe indicator with custom alerts, designed to help traders easily identify key levels of support and resistance on any financial instrument. This advanced indicator uses the popular Fibonacci sequence to calculate pivot points based on the specified timeframe, depth, and backstep parameters. It also comes with customizable alerts. You can choose to be alerted when the price crosses any of the pivot points or when the price is within a specified frequency and pi

*Used by MeditionSeed EA. Meditation is a practice in which an individual uses a technique – such as mindfulness, or focusing the mind on a particular object, thought, or activity – to train attention and awareness, and achieve a mentally clear and emotionally calm and stable state.[1][2][3][4][web 1][web 2] Plant a Meditation Seed to have wonderful future.
FREE

The Intra Daily Range Projection indicator forecasts the current day’s price range on the basis of the previous day data. All calculations are based on the book “New Science of Technical Analysis” by Thomas R. DeMark.
When you're analyzing investments, the trading range is a valuable analytical tool. The average trading range is the average distance between the high and the low over a specified period of time. You can calculate the average high-low range on a piece of paper, a spreadsheet, o

Phase accumulation adaptive bandpass filter MT5 Indicator is a Metatrader 5 (MT5) indicator and the essence of this technical indicator is to transform the accumulated history data. Phase accumulation adaptive bandpass filter MT5 Indicator provides for an opportunity to detect various peculiarities and patterns in price dynamics which are invisible to the naked eye. Based on this information, traders can assume further price movement and adjust their strategy accordingly.

Correlation indicator is a trading indicator that compares price correlations on up to 8 different instruments simultaneously. This indicator is designed to be very versatile. It can be used to trade many different strategies from scalping to hedging to simple trend-following based on an average trend direction of multiple currency pairs or it can signal only when all the pairs correlate on the same side of a particular moving average. The indicator automatically applies the same moving average
Добро пожаловать в индикатор распознавания образов Advanced Gartley Этот индикатор обнаруживает паттерн Гартли на основе HH и LL ценовой структуры и уровней Фибоначчи, и при достижении определенных уровней Фибо индикатор отображает паттерн на графике. Версия MT4: WH Advanced Gartley Pattern MT4 **Этот индикатор является частью комбо Ultimate Harmonic Patterns MT5 , который включает в себя все функции распознавания образов.**
Функции : Расширенный алгоритм обнаружения паттерна Гартли с в
FREE

Индикатор TrendChangeZone отображает глобальные и локальные максимумы и минимумы цены на графике. Также индикатор показывает глобальный тренд на графике и коррекционные волны. Этот индикатор создан для определения направления и смены тренда. Самое главное, индикатор показывает зоны продолжения или разворота тренда. Незаменимый помощник в торговле. Индикатор не перерисовывается. Индикатор может работать на всех торговых инструментах.
Важно !!! Тренд верхний если 2 (два) и более синих отрезка по

Определите свой собственный свечной паттерн, и этот индикатор будет отображаться на экране при появлении этого паттерна Вы можете бесплатно протестировать его в тестере стратегий и посмотреть, сколько раз ваш свечной паттерн появляется на выбранном вами активе Вы также можете закрасить все свечи вашего узора или только одну Этот индикатор удобен для свечного анализа, его можно использовать в ценовом действии и в стратегиях открытой торговли. Это индикатор, показывающий выбранное вами движение

The indicator draws supply and demand zones. The zone timeframe can be set independently of the chart timeframe. For instance, it is possible to set M5 zones on an H4 chart. The importance of zones can be adjusted using the zone strength parameter. Demand zones are displayed if at least one candle in the range of the zone is entirely above the zone. Similarly, supply zones are displayed if at least one candle within the zone is entirely below the zone.

(перевод Google) Этот индикатор основан на оригинальном " Time Segmented Volume (TSV) ", разработанном Worden Brothers, Inc . Однако я добавил к этому несколько дополнительных функций. Можно выбрать цену, которая будет применяться, вместо того, чтобы использовать только цену закрытия по умолчанию, используемую оригиналом. Также можно выбрать, какое взвешивание по объему использовать, включая псевдообъемное взвешивание на основе истинного диапазона или вообще без взвешивания по объему. (Original
FREE

(Google Переводчик) Этот индикатор был вдохновлен средним истинным диапазоном (ATR) Джона Уэллса Уайлдера , но с некоторой дополнительной информацией. Точно так же он вычисляет экспоненциальное скользящее среднее истинного диапазона, но использует стандартный альфа-вес вместо Уайлдера . Он также вычисляет среднее отклонение от среднего диапазона и отображает его как смещение. Это помогает не только быстрее определить изменение, но и его влияние. (Original text) This indicator was inspired by Joh
FREE

SUPERTREND ; Это индикатор следования за трендом, основанный на SuperTrend ATR, созданном Оливье Себаном. Его можно использовать для обнаружения изменений в направлении тренда и обнаружения стопов. Когда цена падает ниже кривой индикатора, она становится красной и указывает на нисходящий тренд. И наоборот, когда цена движется выше кривой, индикатор становится зеленым, указывая на восходящий тренд. Как и другие индикаторы, он хорошо работает с SuperTrend в сочетании с другими индикаторами, такими
FREE

(Перевод Google) Этот индикатор основан на оригинальном индикаторе ZigZag , предоставленном в качестве примера исходного кода при установке MetaTrader . Я переписал его, добавив некоторые дополнительные функции для отображения канала «глубины» и соответствующих прорывов. Это также позволяет наблюдать предыдущие точки зигзага. При необходимости он может предупреждать пользователя о прорывах. Оповещения могут быть просто на терминале или в виде push-уведомлений на мобильном устройстве с вашим собс

ЭТО БЕСПЛАТНАЯ ВЕРСИЯ РАСШИРЕННЫХ УРОВНЕЙ PRICE ACTION
бесплатно на месяц, но на демо-счете.
полный продукт: https://www.mql5.com/en/market/product/94338 Точные горизонтальные уровни поддержки и сопротивления Точно для анализа ценового действия. Все рынки: форекс, акции, индексы, металлы, товары и криптовалюта Доступно для метатрейдера 5 Регулируемые параметры я думаю это все
Поговорите со мной в телеграмме: @ https://t.me/Userrrrrrrrrname
Прямые продажи находятся на уровне 19 долларов.
FREE

This indicator allows you to measure retracements of price between any two points in either direction. It displays the price points, percentages and also displays the extension levels.
User may Modify and Add addition levels and extensions." User may also Add multiple Fibonacci indicators on the chart and change their colors, style and sizes.
Can be used on any timeframe.
This is the only Fibonacci Tool you'll need to measure and trade on Structure.
MT4 Version Available as well.
ADDI
FREE
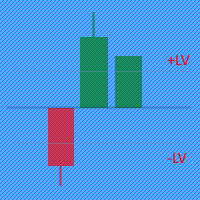
Индикатор Price Movement Strength отображает направление и силу изменения цены в виде свечи на каждом ценовом баре. Если индикатор показывает уровень закрытия свечи, равный нулю на текущем баре, то значит цена не изменилась. Если индикатор показывает зеленую свечу, то значит цена торгового инструмента растет и наоборот красная свеча сигнализирует о падении цены. Входные параметры: У индикатора есть два параметра для задания уровней покупки/продажи: BuyLevel и SellLevel. Значения этих параметро
Unlike many other indicators including the moving average indicator, Pivot Point can be a leading indicator. In these systems, the price levels of the previous period are used to determine the critical points instead of relying on the current price performance. Such an approach provides a clear framework for traders to plan their trades in the best possible way.
You can use this method and its combination with the methods you want to build and use a powerful trading setup. MT4 version
Let us k

Trend Fibonacci is a unique indicator that combines a power of Fibonacci sequences and ranges. Channel Group: Click Here
How to read:
- There are three zones --> red, gold and green
- Red candlestick = downtrend
- Green candlestick = uptrend
- Gold candlestick = no established trend
Inputs: Per = number of bars used for calculations FirstRatio = first Fibonacci ratio (Or use any ratio you want) SecondRatio = second Fibonacci ratio (Or use any ratio you want)
!! IF YOU PURCHASE TH
FREE

Máquina Trader Tendência Count on our trend tracker to carry out your operations on the Mini Index and the Mini Dollar!!! Operational Green is BUY and Pink is SELL!!! Enter the operation after closing the first color block!!! Developed and Tested on the 5 or 15 minute Chart for Mini Index and Mini Dollar!!! Can be used on any chart!!! Editable colors and period!!!

The CCI Trend Dashboard is an advanced technical analysis tool available that provides a dashboard interface for traders to analyze multiple symbols and timeframes at once. It uses the Commodity Channel Index (CCI) in combination with currency strength and volumes to analyze market trends. The tool is user-friendly and suitable for both beginner and advanced traders. Note: The values are derived from the CCI values of the respective symbol and timeframe using the specified period from the sett

This is a rate of change chart from the baseline. features. comparison of max 5 symbols. free baseline with drag. free timeframes of the sub window. reverse chart selectable if you need.
i.e. set symbols "-US100" notes In the sub window, you can't believe datetime on the chart, because the numbers of bars are different. You can check the baseline if you click symbol name. The dragged baseline is temporary. You must set it to indicator's parameter if you need.
FREE
MetaTrader Маркет - уникальная площадка по продаже роботов и технических индикаторов, не имеющая аналогов.
Памятка пользователя MQL5.community расскажет вам и о других возможностях, доступных трейдерам только у нас: копирование торговых сигналов, заказ программ для фрилансеров, автоматические расчеты через платежную систему, аренда вычислительных мощностей в MQL5 Cloud Network.
Вы упускаете торговые возможности:
- Бесплатные приложения для трейдинга
- 8 000+ сигналов для копирования
- Экономические новости для анализа финансовых рынков
Регистрация
Вход
Если у вас нет учетной записи, зарегистрируйтесь
Для авторизации и пользования сайтом MQL5.com необходимо разрешить использование файлов Сookie.
Пожалуйста, включите в вашем браузере данную настройку, иначе вы не сможете авторизоваться.