Все заказы
 Правила
Работа завершена

Техническое задание
I would like TMS-Osc cross status dashboard. TMS-Osc and TMS-Osc Histogram mq4 file were attached.
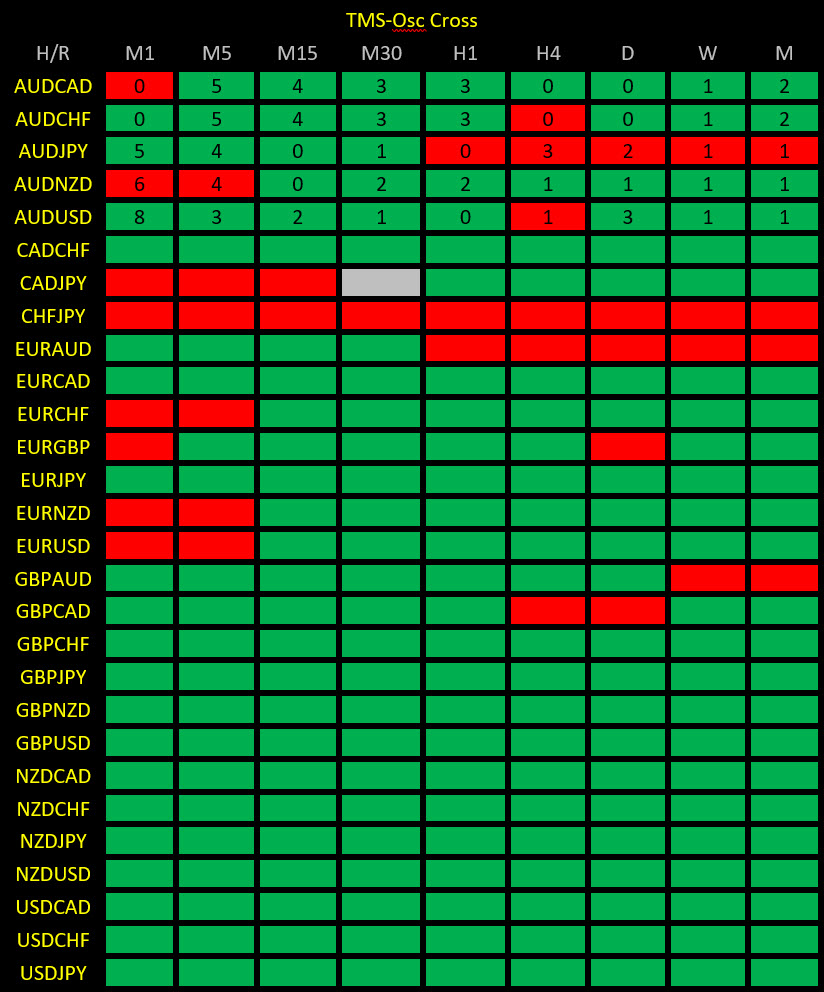
It should look like the one in attached dashboard picture.
1. Background color of upper row and left row is black. Color of border is black. Background color of cross-up cell is green. Background color of cross-down cell is red. Background color of other cells which is not met cross-up or cross-down conditions is grey (I have never seen this, but in case value of green line is exactly the same as red line). Font color of upper row is grey. Font color of left column is yellow. Font color of other cells is black. All colors can be changed and selected from inputs. Font position is adjusted to be at center of cells.
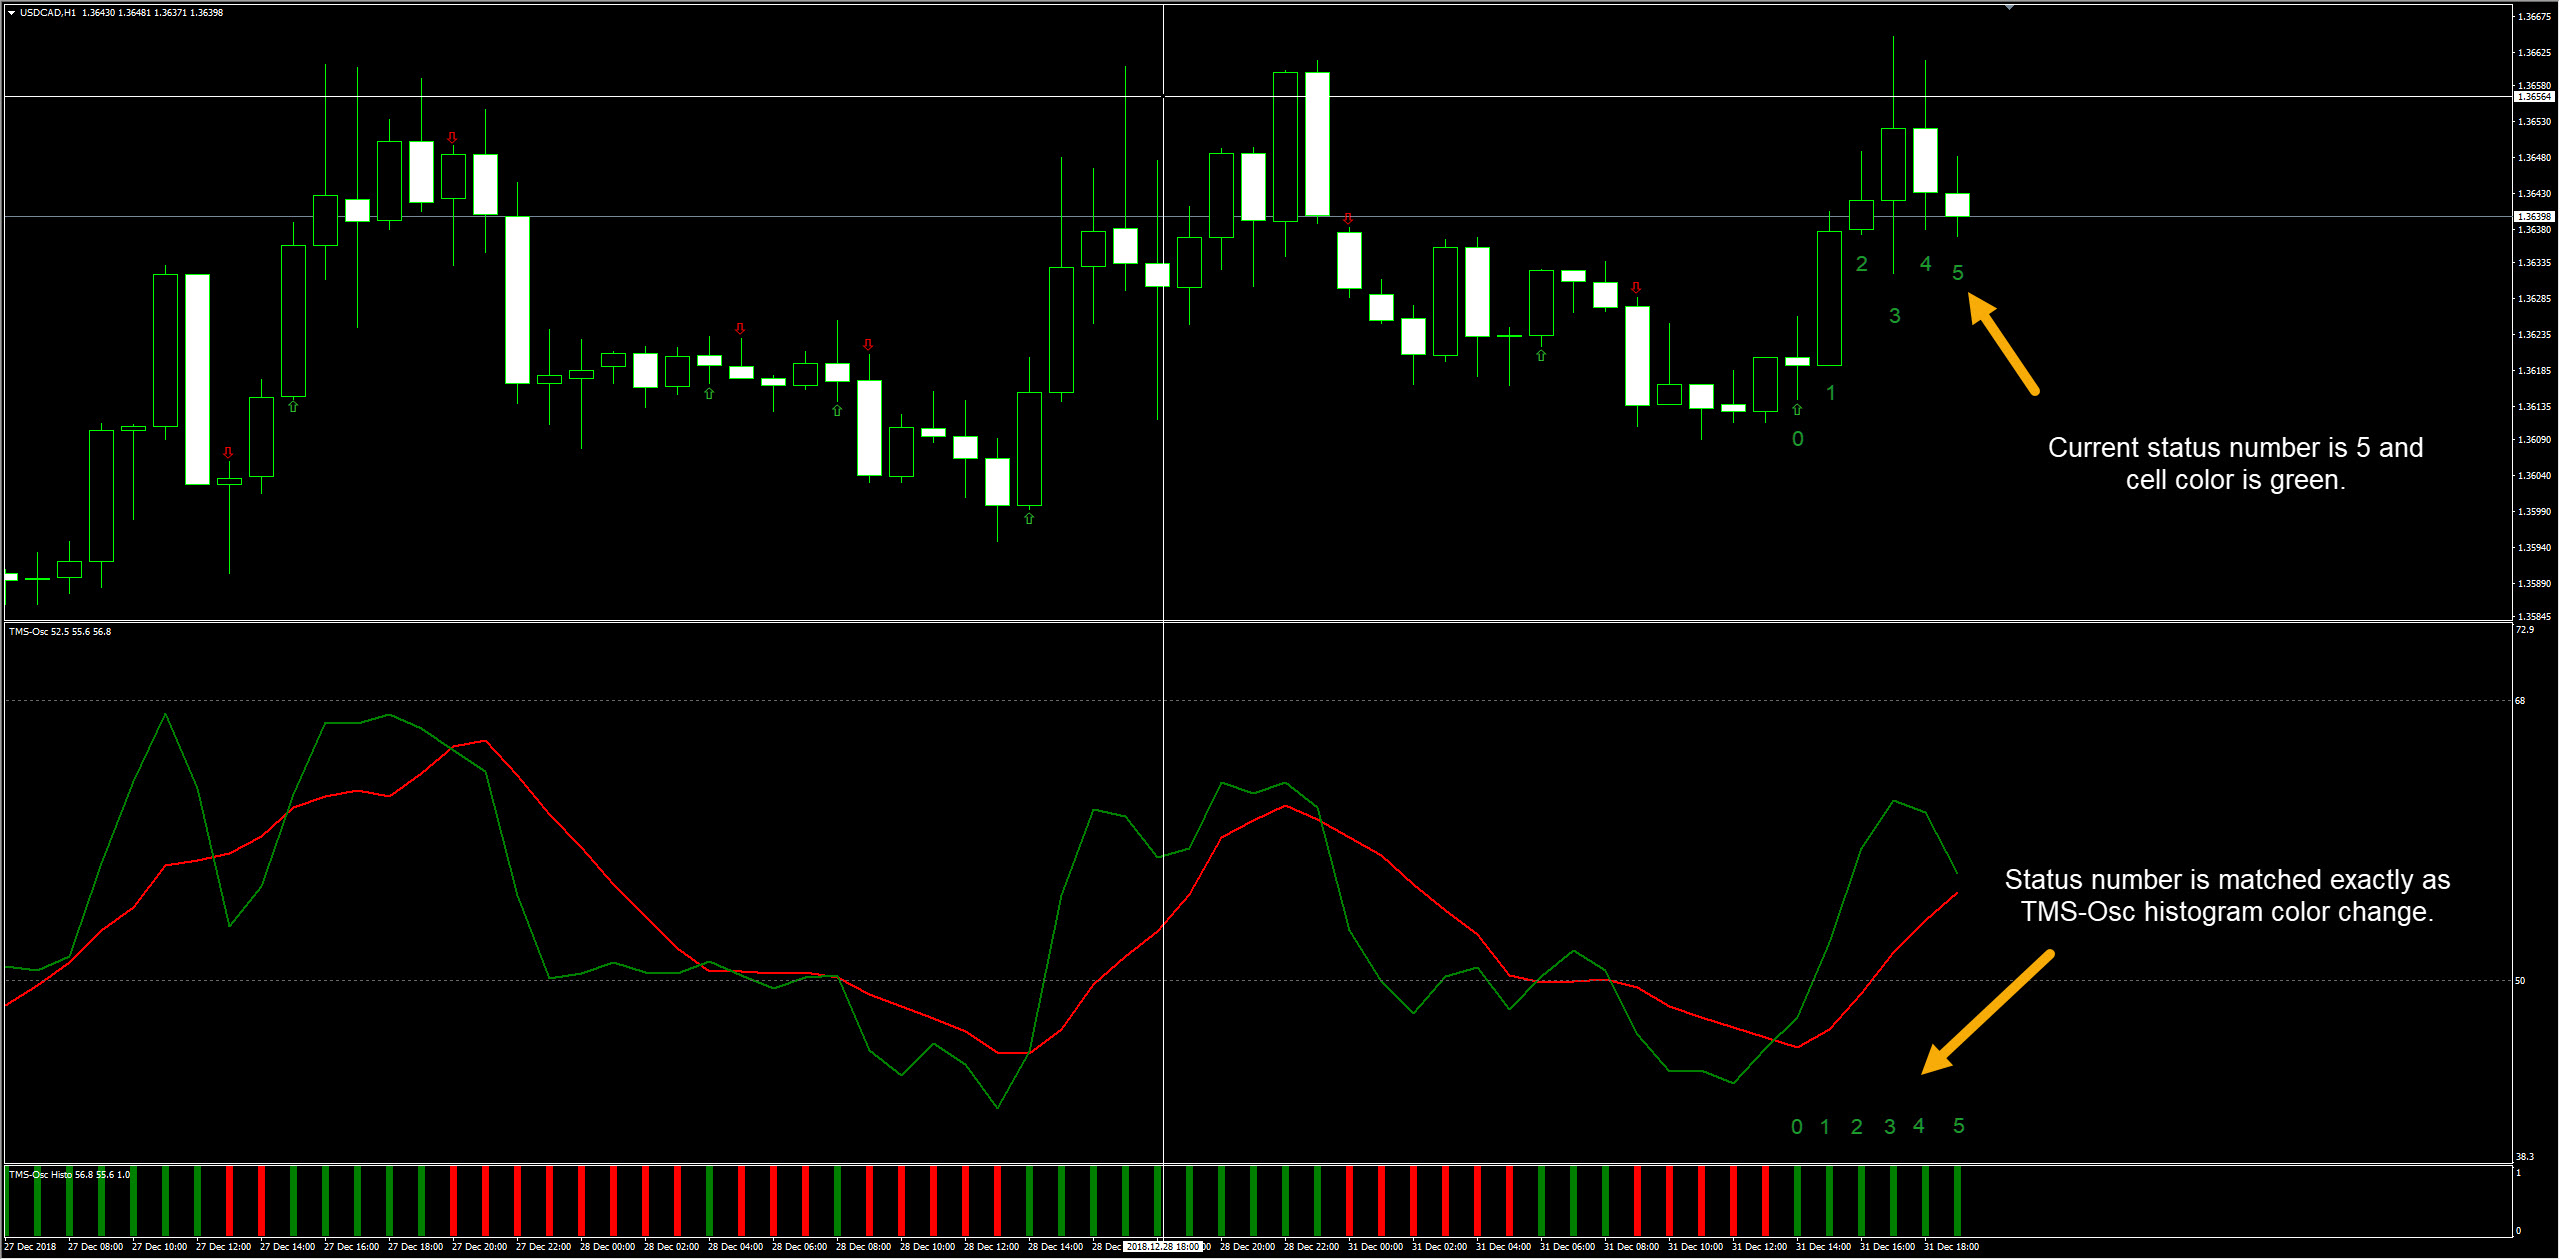
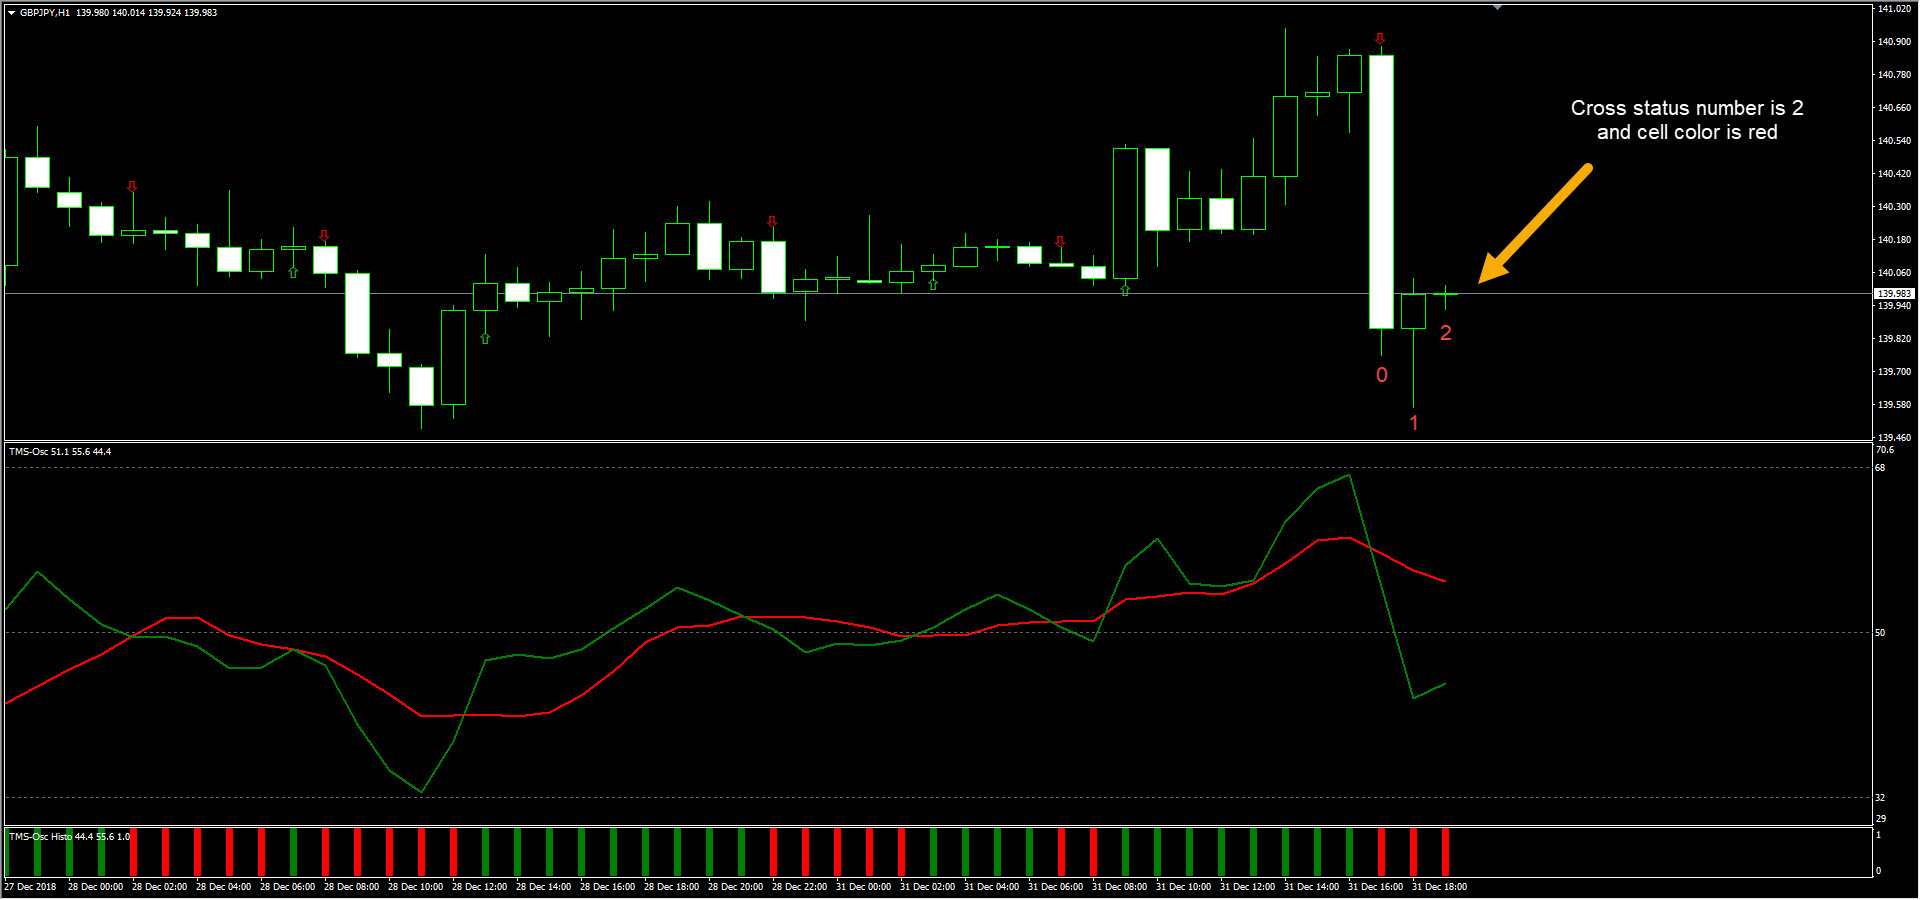
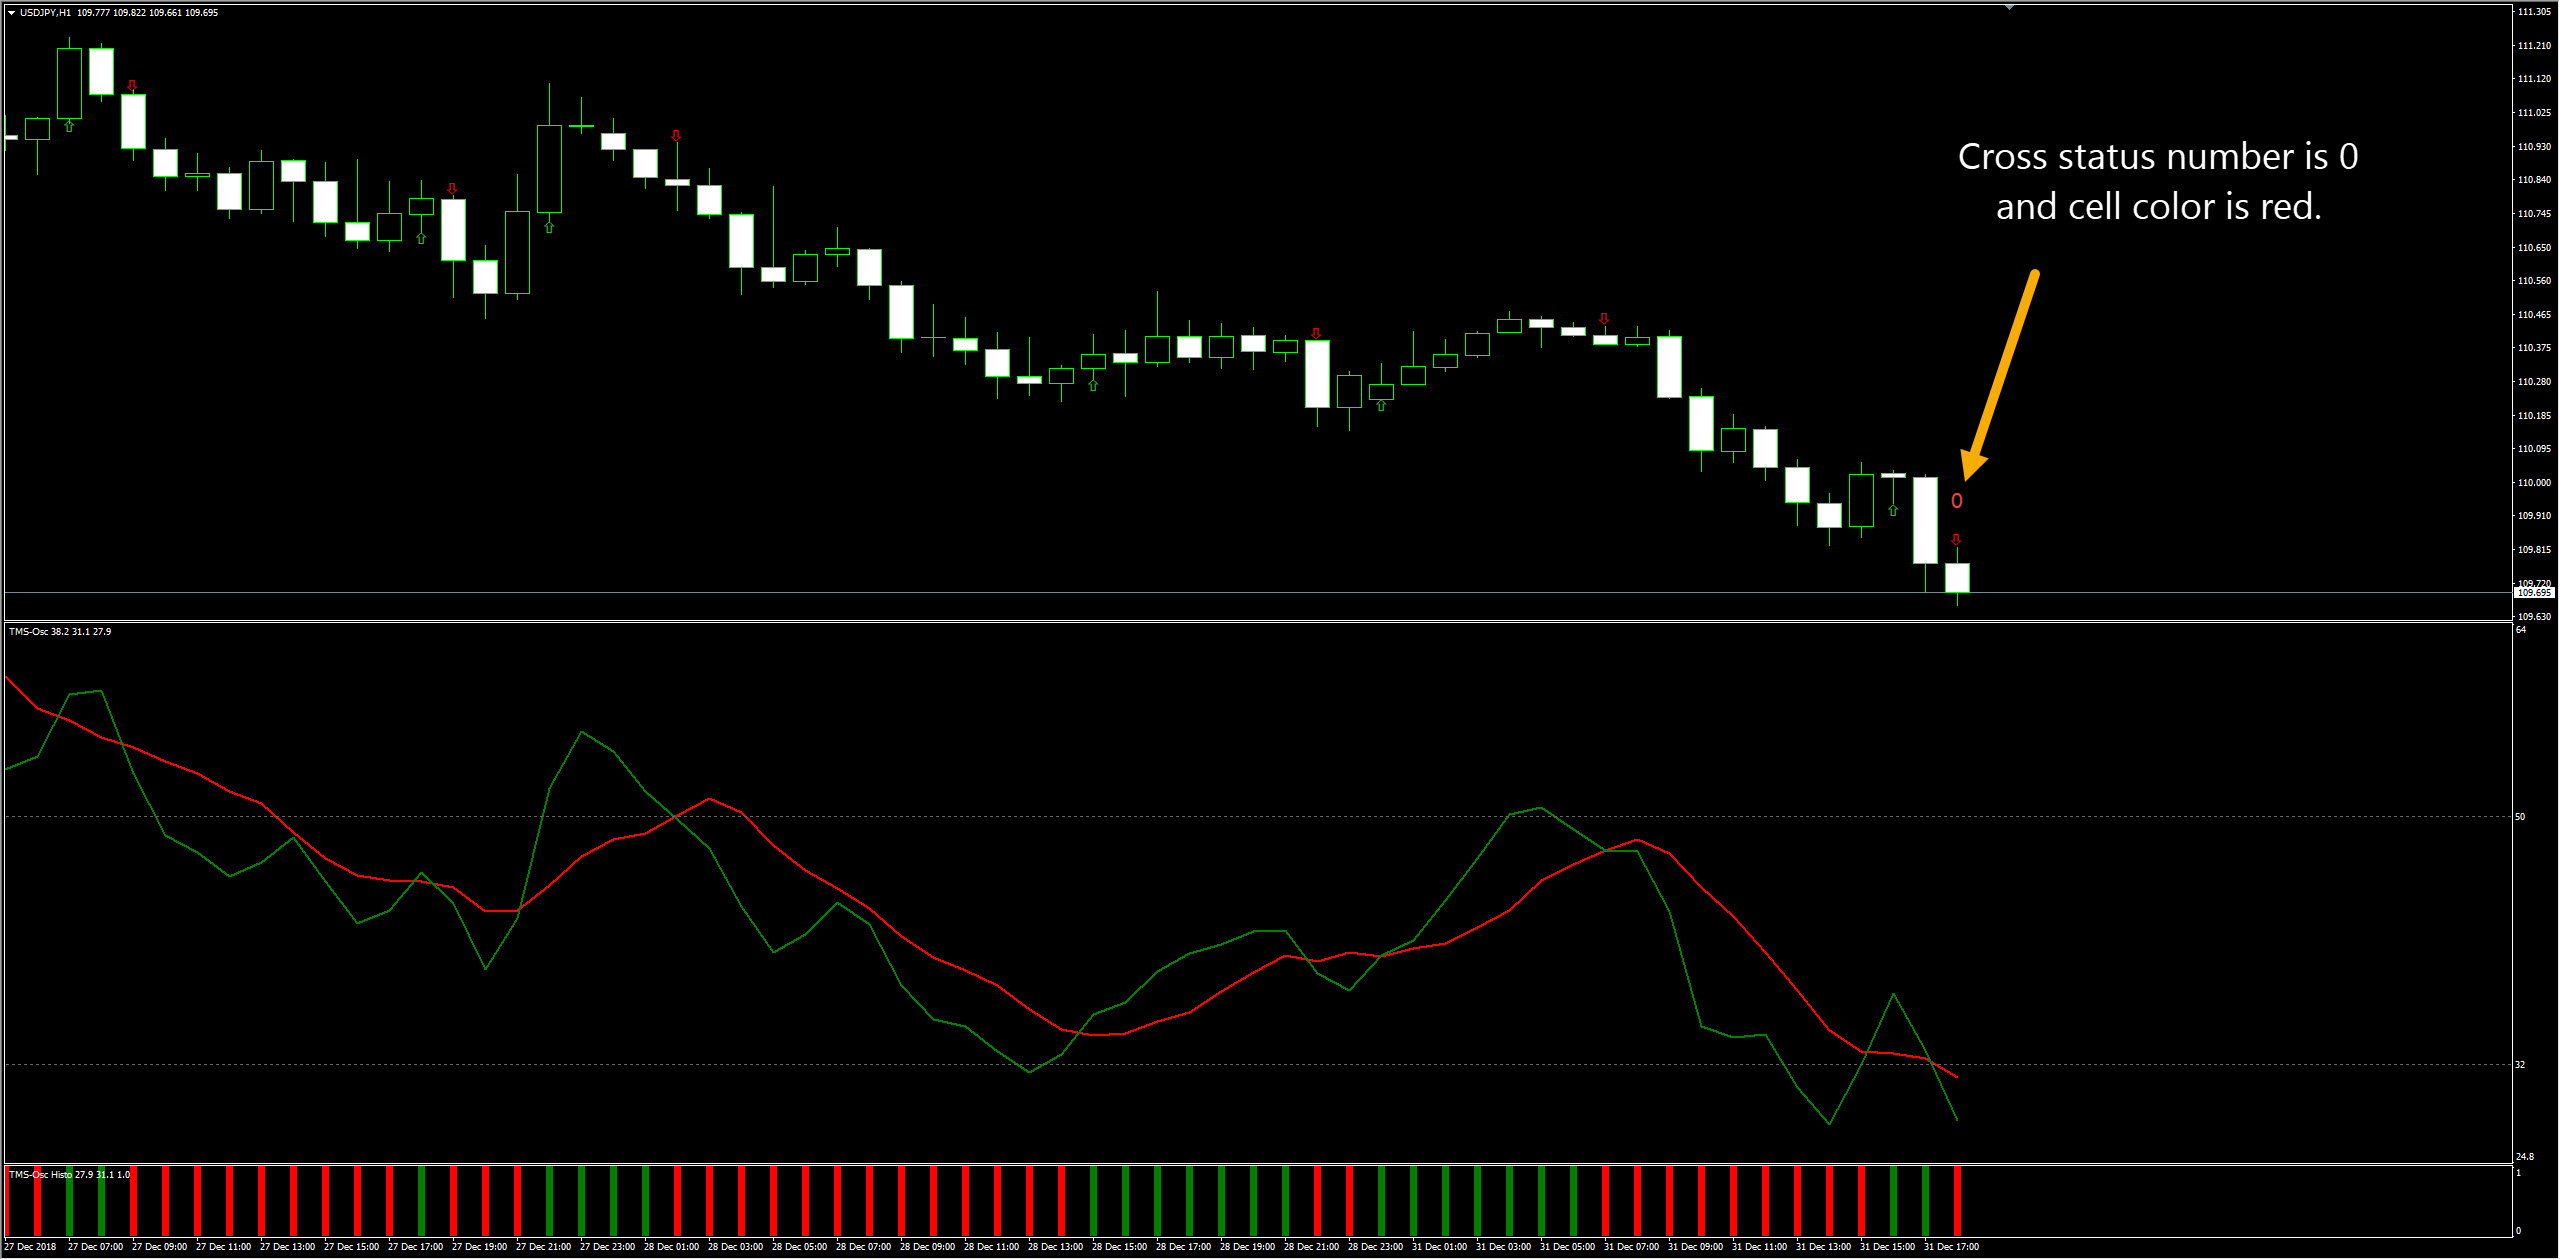
2. The cross-up or cross-down (green line crosses red line) conditions are derived from TMS-Osc indicator formula and TMS-Osc cross histogram formula (which is non-repaint). They are matched with color of TMS-Osc cross histogram.
3. Dashboard indicator can calculate value of cross by its own and other indicators are not required to be installed together.
4. Cells show numbers representing candles or bars after recent cross. If cross happens at or just before current bar, number is 0. If cross happens at one previous bar, number is 1. If cross happens at two previous bars, number is 2 and so on (as shown in pictures attached).
5. Numbers on dashboard are updated by tick just as TMS-Osc indicator and TMS-Osc histogram behave.
6. Default dashboard time frame includes one-minute, 5-minute, 15-minute, 30-minute, 1-hour, 4-hour, day, week and month time frames. Any time frames can be selected to show or hide from inputs.
7. Default currency pairs include 28 pairs as shown in example dashboard and any currency pairs can be selected to show or hide from inputs. Number of currency pairs can be added more.
8. Currency pairs prefix or suffix can be added from inputs in case some brokers has prefix or suffix added to regular symbols.
9. Most upper left cell is a toggle button designed to hide or show dashboard.
10. Position of dashboard can be adjusted from inputs.
11. Sizes of dashboard and fonts are clearly visible and appropriate to size of chart window.
12. The last one is option because I am not certain whether it is possible. I would like to convert chart time frame according to cell column and convert chart currency pair according to cell row when cell is clicked.