Смотри, как быстро заказать торгового робота
Ознакомьтесь с правилами перед работой
Как заказать торгового робота на MQL5 и MQL4
Посмотри пример Технического задания для заказа робота
Новое в категории:
30+ USD
30 - 20000 USD
30 - 100 USD
50+ USD
Работа завершена
Время выполнения 5 дней
Отзыв от заказчика
Fast response, excellent support. Very diligent and helpful. Thanks for your support.
Отзыв от исполнителя
Very nice working experience, great concept
Техническое задание
First of all we must define the general requirements to start this job:
Requirements for the code:
The code needs to be:
Object oriented.
Highly modular.
Comments in functions are required (preferably in English).
Documentation highly explained about the writed code.
Requirements for the indicator:
Indicator should be shown in separate window.
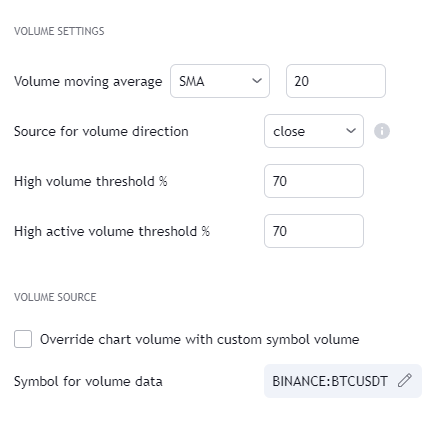
Volume composition consists of the following information:
Total volume (buy and sell). By default gray node.
Dominating volume (buy or sell). By default dark green/dark red node.
Dominating active volume (buy or sell). By default light green/light red node.
Dominating volume as percentage of total volume.
Dominating active volume as percentage of total active volume.
Buy and sell volume is defined by volume associated with lower timeframe up/down moves. This classification is further broken down to passive/active, standing for decreasing/increasing volume, e.g. a move up with volume higher than previous bar volume = active buy volume, a move up with volume lower than previous bar volume = passive buy volume.
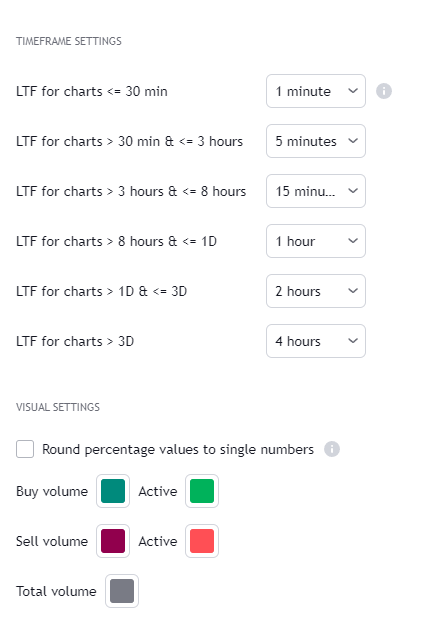
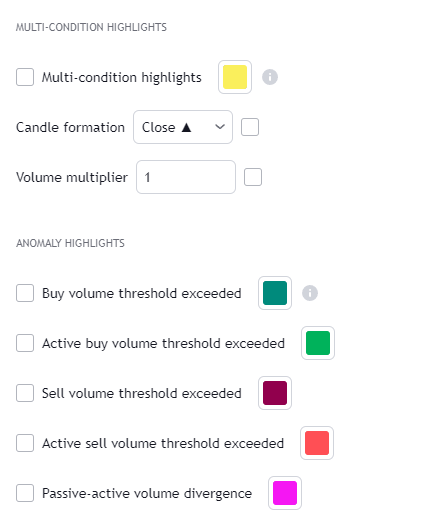
— Visuals
Breakdown of visual elements:
1. Symbol and timeframe used for volume composition calculations. By default the chart that is viewed and automatically selected lower timeframe.
2. Dominating volume threshold exceeded. Can be defined via input menu, 70% of total volume by default.
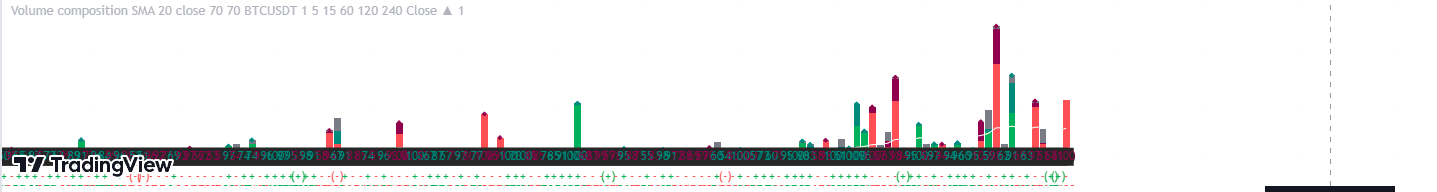
3. Dominating volume as percentage of total volume. Plotted below volume nodes, without % symbol.
4. Dominating active volume, + or - symbol, standing for buy and sell. Plotted below dominating volume percentage. When dominating volume and dominating active volume sides are in a disagreement (e.g. dominating volume is on buy side while dominating active volume is on sell side) this symbol will appear inside brackets, (+) or (-).
5. Dominating active volume as percentage of total active volume. Plotted below +/- symbol.
6. Dominating active volume threshold exceeded. Can be defined via input menu, 70% by default.
Indicator information and pinescript code:
https://www.tradingview***.com/script***/d4TDeuRU-Volume-composition-***Buy-sell-active-passive/
In attached images there's how the indicator should look and the settings...
Откликнулись
1
Оценка
Проекты
499
67%
Арбитраж
5
40%
/
0%
Просрочено
4
1%
Свободен
Опубликовал: 8 примеров
2
Оценка
Проекты
945
47%
Арбитраж
309
58%
/
27%
Просрочено
125
13%
Свободен
Похожие заказы
I need an Expert Advisor for MT5 on XAUUSD 1min timeframe using SMC concepts. STRATEGY RULES: SELL: 1. Identify previous day High/Low as liquidity 2. Entry only during London-NY session: 15:00-19:00 GMT+3 or broker clock. 3. If price sweeps previous day High and closes back below it 4. Check for bearish 1min FVG below sweep candle 5. Wait for BOS - lower low 6. Entry: Sell/buy at 50% of the FVG 7. SL: 10 pips above
Code An Loss Rate 90-100% MT5 EA , that can blow a 100 USD account a day ,with fixed TP of 3000 points and SL of 3000 For better Rate Calculations get an strategy that can lead to so
Shooter razor
30+ USD
Makes it takes trades by it self buy and sell, it must use the higher signals, also when I press stop it must not pick any trades I want it to take trades automatically when I press start also close by it self
8 cap prop firm passing
30 - 3000 USD
I am looking for an experienced MQL4/MQL5 HFT developer to build or optimize a High-Frequency Trading (HFT) Expert Advisor that can successfully pass proprietary trading firm challenges and perform consistently under live trading conditions with brokers such as 8cap or BlackBull Markets . The developer should have proven experience with HFT execution, ultra-low-latency trading, broker execution, slippage, spreads
I need a professional MT5 Expert Advisor (MQL5) for XAU/USD (Gold) only. Requirements: - Symbol: XAU/USD only - Timeframe: H1 trend, M5 entry - Smart Money Concept (SMC) - Liquidity Sweep - Break of Structure (BOS) - Order Block Retest - Confirmation Candle (Engulfing or Pin Bar) - ATR-based Stop Loss - Risk:Reward = 1:3 (adjustable) - Auto Lot (1% risk) - Break Even - Trailing Stop - Maximum 2 trades per day - One
MT4/MT5 HFT EA Live Trading
40 - 10000 USD
I have a High-Frequency Trading (HFT) Expert Advisor for both MT4 and MT5 designed primarily for US30 (Dow Jones Index) . The EA performs consistently and profitably on demo accounts, but when I run it on an IC Markets Raw or Standard live account, it starts generating losses under what appear to be the same trading conditions. At this time, I cannot provide the source code (.mq4/.mq5). I can only provide the
I need an Expert Advisor for MT5 on XAUUSD 1min timeframe using SMC concepts. STRATEGY RULES: SELL: 1. Identify previous day High/Low as liquidity 2. Entry only during London-NY session: 15:00-19:00 GMT+3 3. If price sweeps previous day High and closes back below it 4. Check for bearish 1min FVG below sweep candle 5. Wait for BOS - lower low 6. Entry: Sell at 50% of the FVG 7. SL: 10 pips above sweep wick 8. TP: 2R
Hello looking for someone to convert an indicator from tradingview to Thinkorswim I have attached the codes from trading view Also, I like make it trigger (alert) a one-time alert when the trend changes, and can also create a custom watchlist column that flags symbols currently in a new trend so you can scan multiple stocks easily. And like the watchlist to show only fresh trend changes or the current trend direction
Fundamental News Trading Strategy
50 - 200 USD
I want to build a fundamental news trading bot that trade off economic news data, as we know every economic news data released always have effect on the asset associated with it, so this bot will take a trade instantly based on the news data released either to buy or sell, it will come with good money management and also SL and TP target based on price and pips value
I have a EA/indicator that I want built. I should say 1st off dont know how to code myself so I will be using AI to verify that the source code is complete and matches the documents spec or if better so if you can not truly do the job do not waste either of out time. This is a idea I came.up wit and used AI to produce a framework for it.... and of course AI isn't 100% accurate so I need a knowledgeable quantitative
Информация о проекте
Бюджет
30 - 300 USD