 All orders
 Rules
Rules
Watch how to order a trading robot
Read the Rules before you post an order or execute it
How to Order a Trading Robot in MQL5 and MQL4
See a sample Requirements Specification to order a robot
New orders in the category:
250 - 500 USD
30+ USD
30 - 50 USD
30 - 40 USD
30+ USD
Job finished
Execution time 5 days

Feedback from employee
Very nice working experience, great concept
Feedback from customer
Fast response, excellent support. Very diligent and helpful. Thanks for your support.
Specification
First of all we must define the general requirements to start this job:
Requirements for the code:
The code needs to be:
Object oriented.
Highly modular.
Comments in functions are required (preferably in English).
Documentation highly explained about the writed code.
Requirements for the indicator:
Indicator should be shown in separate window.
Volume composition consists of the following information:
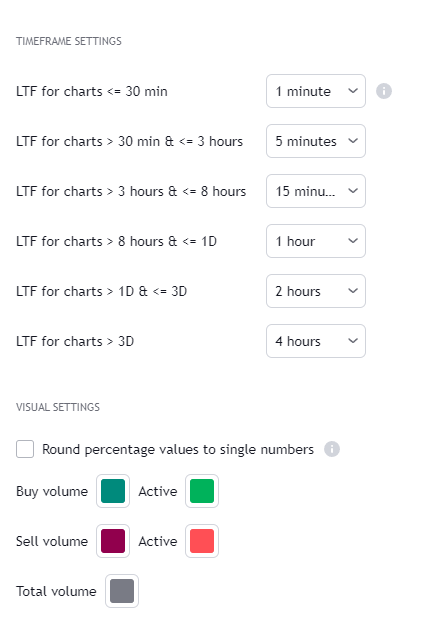
Total volume (buy and sell). By default gray node.
Dominating volume (buy or sell). By default dark green/dark red node.
Dominating active volume (buy or sell). By default light green/light red node.
Dominating volume as percentage of total volume.
Dominating active volume as percentage of total active volume.
Buy and sell volume is defined by volume associated with lower timeframe up/down moves. This classification is further broken down to passive/active, standing for decreasing/increasing volume, e.g. a move up with volume higher than previous bar volume = active buy volume, a move up with volume lower than previous bar volume = passive buy volume.
— Visuals
Breakdown of visual elements:
1. Symbol and timeframe used for volume composition calculations. By default the chart that is viewed and automatically selected lower timeframe.
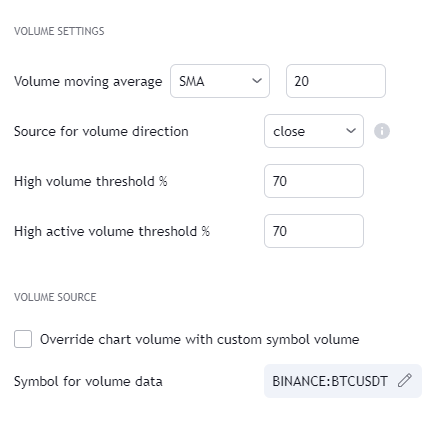
2. Dominating volume threshold exceeded. Can be defined via input menu, 70% of total volume by default.
3. Dominating volume as percentage of total volume. Plotted below volume nodes, without % symbol.
4. Dominating active volume, + or - symbol, standing for buy and sell. Plotted below dominating volume percentage. When dominating volume and dominating active volume sides are in a disagreement (e.g. dominating volume is on buy side while dominating active volume is on sell side) this symbol will appear inside brackets, (+) or (-).
5. Dominating active volume as percentage of total active volume. Plotted below +/- symbol.
6. Dominating active volume threshold exceeded. Can be defined via input menu, 70% by default.
Indicator information and pinescript code:
https://www.tradingview***.com/script***/d4TDeuRU-Volume-composition-***Buy-sell-active-passive/
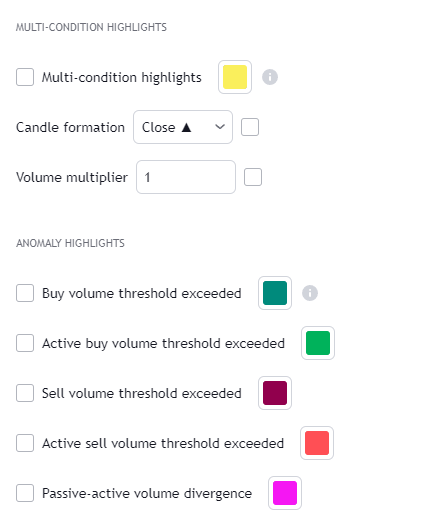
In attached images there's how the indicator should look and the settings...

Responded
1
Rating
Projects
499
67%
Arbitration
5
40%
/
0%
Overdue
4
1%
Free
Published: 8 codes
2
Rating
Projects
945
47%
Arbitration
309
58%
/
27%
Overdue
125
13%
Free
Similar orders
I’m looking for an experienced MQL5 developer to build a custom MT5 Expert Advisor for gold scalping, based on clearly defined support/resistance levels and false breakouts. Before development, I would welcome your technical feedback on the proposed rules, their feasibility, and any improvements you recommend. Please explain the reasoning behind your suggestions rather than promising returns. Proposed strategy: 1
Here is a professional, detailed requirements specification draft for your MQL5 freelance order based on your prompt: Strategy Objective: Develop an automated Expert Advisor (EA) featuring a 1:3 Risk-to-Reward ratio optimized for a small starting budget. Core Trading Logic: Execute automatic Buy and Sell trades using high-probability entry signals. Target a strict 90% theoretical win-rate structure through
i want to fix my gold martingale bot MT5. RSI 14 ENTRY 30 BUY 70 SELL Lot 0.02 0.04 0.07 TP 150 for all SL 90 30 30 once total daily profit is 200$ stop trading stop trading once 2 consecutives total losses stop trading if spread exceeded 30 and between hour 15 & 17 PM Move SL to breakeven point once the profit exceeded 50 from from breakeven thanks
MarketMind Breakout Pro XAUUSD H1 — Donchian Breakout EA Project type: Personal EA development and backtesting Platform: MetaTrader 5 Instrument: XAUUSD Timeframe: H1 Strategy: Donchian Channel breakout with EMA 200 Project overview This project evaluates a Donchian breakout trading strategy for XAUUSD on the H1 timeframe. The system uses channel-based breakout conditions and an EMA 200 trend filter. Historical
The purpose of this order is ONLY to test and implement my H1 POI (Point of Interest) identification logic correctly. I am not requesting the complete EA at this stage. I will provide the exact rules for identifying the H1 POI after selecting the developer. The developer must convert those rules into clear, deterministic MQL5 logic. Requirements: Analyze H1 candles according to the rules I provide. Identify and mark
Title: Fully Automatic MT5 Trading Bot (Expert Advisor) with Risk Management I want a fully automated trading robot (Expert Advisor) for MetaTrader 5, written in MQL5. The bot must automatically analyse market data, identify trading opportunities, execute BUY and SELL orders, manage open positions, and close trades according to predefined rules without requiring manual confirmation for each trade. Requirements
Hello, I’m looking for an experienced developer to research, build, test, and install a fully automated MetaTrader 5 trading bot for gold, XAUUSD. My total development and installation budget is $300, including all agreed work and fees. My goal is to pass a $100,000 FTMO US Two-Step Standard evaluation and sustainably maintain the funded account. I need a day-trading strategy that can buy in bullish markets and sell
MT4 expert advisor
500+ USD
I have three indicators that operate independently. I want to combine them into one indicator with custom expert programming that automatically enters trades when a signal is generated by one of the indicators. I will pay for this service Thanks you
Existing EA: NEW_CORE_ORB_M5_v021 | MT5 | XAUUSD M5 Early-stage research prototype, not a new EA from scratch. Need an experienced MQL5 developer to audit, complete, repair, improve and test BOTH independent strategies equally: Opening Range Breakout (ORB) and Scalp. Keep code lightweight and preserve an untouched baseline. No unnecessary rewrite or complex filters. 1. ORB Strategy Verify opening-range construction
Hello International Developer, I need LIFETIME MT5 EA for XAUUSD Gold. REQUIREMENTS: 1. Lifetime bot - No expiry date, unlimited accounts, unlimited installations 2. Must include source code .mq5 file - This makes it lifetime 3. Every trade MUST have Stop Loss 300 points and Take Profit 600 points 4. No martingale, No grid, No averaging - Clean safe strategy 5. Auto lot size = 1% risk per trade for good margin growth
Project information
Budget
30 - 300 USD