 Все заказы
 Правила
Смотри, как быстро заказать торгового робота
Ознакомьтесь с правилами перед работой
Как заказать торгового робота на MQL5 и MQL4
Посмотри пример Технического задания для заказа робота
Новое в категории:
50+ USD
30+ USD
10000 - 11000 USD
500+ USD
50 - 80 USD
Работа завершена
Время выполнения 4 дня

Отзыв от исполнителя
Thank you
Техническое задание
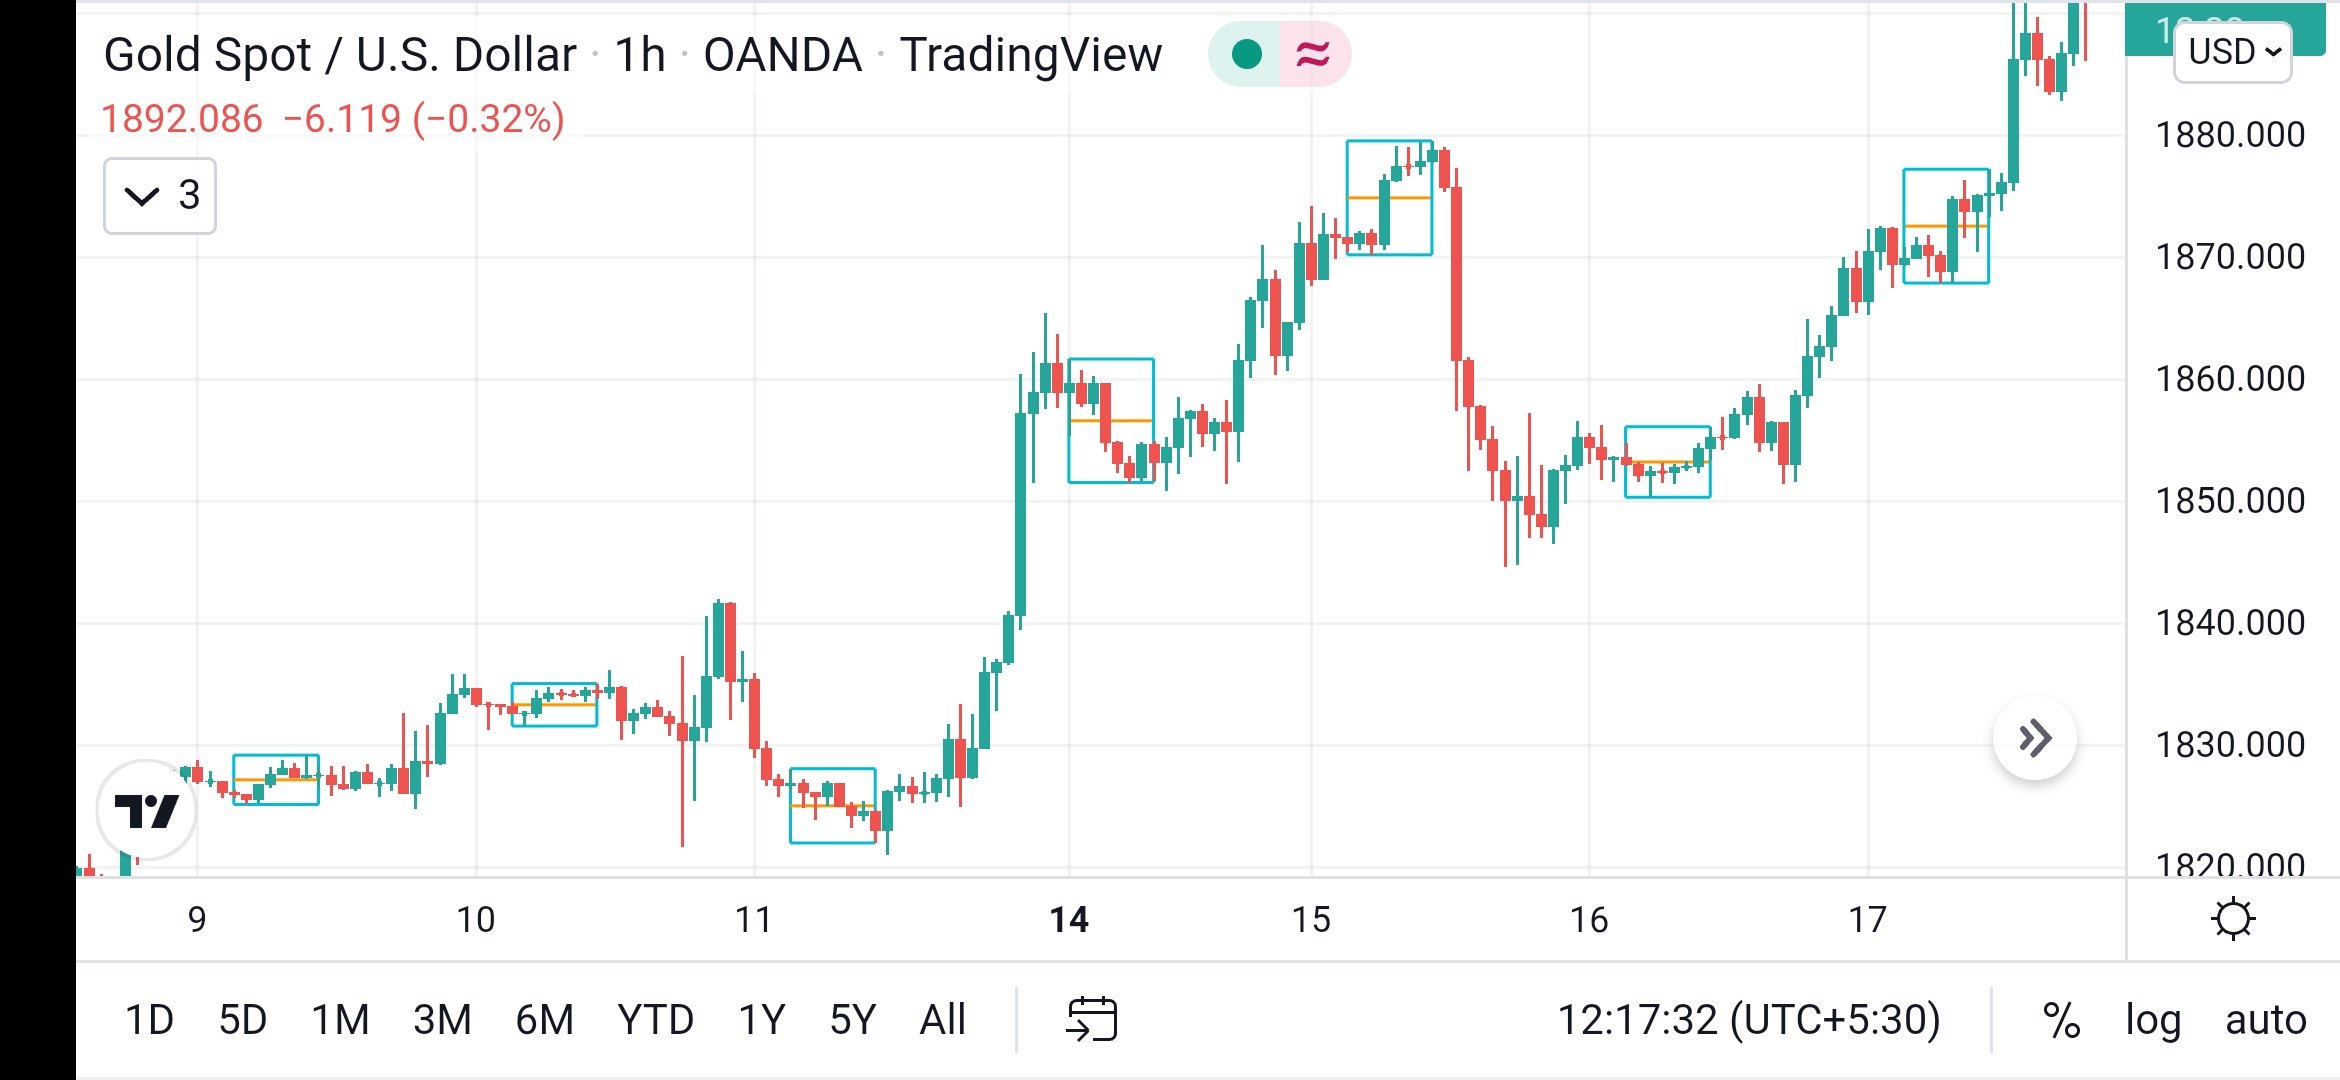
I have one simple strategy,. It should Mark the high and low of Asia session and it should trade in Newyork session when it gives BREAKOUT r BREAKDOWN especially it is for gold
Example:if BREAKOUT happen if TP hit no problem, if it reverse then it should manage by using martingale strategy, Same as in sell also when BREAKDOWN happens. Additional features 1) News filter 2) equity stop 3) trilling SL 4)it should take only 1 trade in Newyork session and it should wait for next day,. I have uploaded one image indicator available in tradingview as Asia session high low,, You can get that source code from trading view
Откликнулись
1
Оценка
Проекты
124
44%
Арбитраж
14
29%
/
50%
Просрочено
17
14%
Свободен
2
Оценка
Проекты
0
0%
Арбитраж
0
Просрочено
0
Свободен
3
Оценка
Проекты
97
43%
Арбитраж
2
50%
/
0%
Просрочено
2
2%
Свободен
Похожие заказы
Ninjascript strategy tester
30+ USD
Hi, I need NinjaTrader 8 Strategy Analyzer backtests on two of my strategies, each over 1 year AND 3 years of data. Please quote the full job. Common settings: NT8 Strategy Analyzer, MCL (Micro WTI Crude Oil) continuous front-month contract (MCL ##-##), 5-minute bars, 1yr + 3yr of the most recent data, $2.50 round-turn commission per contract. Deliverables per run: full Strategy Analyzer summary (net profit, profit
Scalping bort
30+ USD
GOLD SCALPING BOT STRATEGY Symbol: XAUUSD (Gold vs USD) Broker: Exness Account: Standard Starting Balance: $20 1. TIMEFRAME - Trend analysis: M15. - Entry timeframe: M5. - Trade only when the market has a clear direction. 2. INDICATORS - EMA 50 - EMA 200 - RSI 14 - Support and Resistance 3. BUY RULES The bot must open a BUY trade only when all these conditions are met: 1. EMA 50 is above EMA 200 on M15. 2. Price is
MT5 / FX Blue Trading Performance Web Dashboard
500 - 1500 USD
I am looking for an experienced developer to build a professional web-based trading performance dashboard connected to an MT5 trading account and/or FX Blue. The dashboard should automatically collect trading data and display: • Daily P&L calendar – profitable days green, losing days red and no-trade days grey • Equity/growth curve • Drawdown curve • Initial capital and current balance • Net profit and percentage
I need a trading system similar to the attached files. Check attachment for details on the indicator. i guess the indicator contains some of (Rainbow MA , MTF Dashboard , Symbol Switcher , and Trend Histogram), though may not be exactly as listed
i have indicator for Trading View, also copy for NT, i need someone to improve and check the NT version (indicator is simple is volume density koncept)…. when i put same settings on TV version and NT version i have diffrerent results, but this can be because diffrent market data or fact that TV sending tick info in blocks , not tick by tick like NT8 on both. I(ndicator base on counting volume) so besied that is it
Информация о проекте
Бюджет
30 - 60 USD