Risk Manager system

MQL5 Скрипты Прочее

Техническое задание

The panel should have  three columns containing useful information. The first column contains the information about the account state as of the beginning of the month, i.e. the overall result is shown as a percentage and in the deposit currency. The second column shows the daily risk specified in the settings. The third column shows the current account state.

If the daily risk is exceeded or the number of orders is above the maximum allowed number, the EA closes all orders and does not let open new ones, thus protecting from "emotional trading".


Risk Manager allows to control the following trading parameters:

  • Daily loss limit
  • Account loss limit
  • The maximum number of losing trades
  • The maximum number of trades
  • Forced stop after a series of losing trades
  • ATO SL and TP by % and pips 


The Risk Manager system should allows the trader to:

  • Save the daily profit
  • Review trading statistics online
  • Stick to a trading discipline and improve trading results (no "tilt" or "grids")
  • View current equity taking into account the broker's fees

If a trader suffers complete loss for 2 days (the loss is set in settings. For example, 4% two days in a row), he is prohibited to trade for one day.

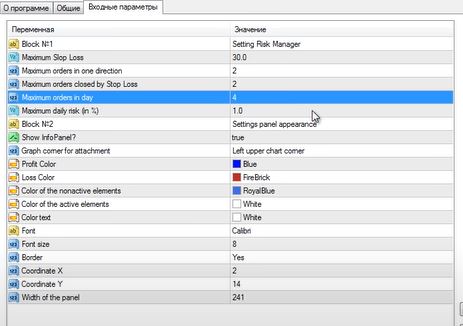
The panel should have the following configurable parameters:

  • Block №1 - Basic Settings
  • Maximum SlopLoss - maximum stop loss. When you open an order, Risk Manager sets stop loss specified here
  • Maximum orders in one direction - the maximum number of orders in one direction on one pair - protection from grids
  • Maximum orders in day - the maximum number of orders per day
  • Maximum orders closed by Stop Loss - the maximum number of orders closed with a loss ( commission and swap not included)
  • Maximum daily risk (in %) - maximum daily risk as % of deposit
  • Block №2 - Appearance Settings
  • Show InfoPanel? - display of information on a chart?
  • Graph corner for attachment - chart corner to anchor the panel
  • Сolor of the nonactive elements - the color of inactive (static) elements
  • Color of the active elements - the color of active elements
  • Profit Color - profit color
  • Loss Color - loss color
  • Color text - text color
  • Font - font type
  • Font size - font size
  • Border - display the panel border
  • Coordinate X - the X coordinate of the panel
  • Coordinate Y - the Y coordinate of the panel
  • Width of the panel - the width of the panel (if numbers do not fit into the fields)

Файлы:

JPG
Capture.JPG
36.4 Kb

Откликнулись

1
Разработчик 1
Оценка
(5)
Проекты
6
0%
Арбитраж
3
0% / 100%
Просрочено
0
Свободен
2
Разработчик 2
Оценка
(481)
Проекты
510
53%
Арбитраж
10
60% / 20%
Просрочено
3
1%
Свободен
3
Разработчик 3
Оценка
(41)
Проекты
77
39%
Арбитраж
0
Просрочено
0
Свободен
4
Разработчик 4
Оценка
(74)
Проекты
73
47%
Арбитраж
2
50% / 50%
Просрочено
2
3%
Свободен
5
Разработчик 5
Оценка
(4)
Проекты
7
29%
Арбитраж
0
Просрочено
0
Свободен
6
Разработчик 6
Оценка
(97)
Проекты
135
52%
Арбитраж
4
50% / 50%
Просрочено
0
Работает
7
Разработчик 7
Оценка
(5)
Проекты
6
50%
Арбитраж
2
0% / 50%
Просрочено
0
Свободен
8
Разработчик 8
Оценка
(351)
Проекты
372
70%
Арбитраж
4
100% / 0%
Просрочено
0
Работает
9
Разработчик 9
Оценка
(163)
Проекты
193
48%
Арбитраж
2
50% / 50%
Просрочено
1
1%
Свободен
10
Разработчик 10
Оценка
(133)
Проекты
172
19%
Арбитраж
17
47% / 18%
Просрочено
0
Работает
11
Разработчик 11
Оценка
(43)
Проекты
72
49%
Арбитраж
4
0% / 50%
Просрочено
19
26%
Свободен
12
Разработчик 12
Оценка
(66)
Проекты
143
34%
Арбитраж
10
10% / 60%
Просрочено
26
18%
Свободен
Похожие заказы
Hello there!! I need a professional ninjatrader developer who can code my specifications to an EA .kindly bid and all the necessary informations will be sent via chat box..Thank you
Here's a clearer step-by-step guide to checking the last 50 candles on your chart and applying Fibonacci retracement levels based on their colors: Identify Candle Color: Start from the 100th candle from the left on the chart and check its color. If the 100th candle is green (i.e., the close is higher than the open): Draw a Fibonacci Retracement: From the highest price to the lowest price of this candle. Check the
Hello, How are you doing? i need a developer who can help me with my prop firm project. Kindly bid if you can do this. Note: Other requirements will be discuss via inbox Thanks
Hello, How are you doing? I need help in selecting, buying and installing Forex Market of trading robots, indicators and trading applications from the METATRADER5 platform. kindly bid if this is what you can do. Thanks
I'm seeking a C# developer with Quantower experience to assist me in exporting data from the Option Analytic panel in real-time via an API. This data will be exported based on a window app, not a web app. You can review the document at the following link : . https://github.com/Quantower/Examples/blob/master/IndicatorExamples/GetOptionsInfo.cs Please check it before bidding NOTE : - Quantower is an app, not web
Hi, We are seeking a skilled software developer to design and develop a program that can seamlessly convert .hst files or CSV files into .fxh files, which can be directly integrated and used on the MetaTrader 4 (MT4) server. The primary goal is to ensure that historical data in .hst or CSV format can be transformed into .fxh format with full compatibility for use in MT4 platforms. I want to convert Export file ( .csv
hi, I have a strategy coded in Python on Jupiter but I have trouble converting it to Quantconnect. Could you do that? The strategy is based on trading with 10 most liquid crypto coins on Binance rebalanced each month and tracking when the price break 20 day high or low plus some other indicators
Hi, I'm looking to replicate or create a tradingview indicator for quantower and I want to know how much it will cost me. You can access the indicator through this link
hello, I need quick help with ninjatrader tool, market replay is not updating candles on chart, even though time is updating on playback window. I need someone who can help remotely to see what is issue. are you available

Информация о проекте

Бюджет
30 - 200 USD
Исполнителю
27 - 180 USD