Работа завершена

Время выполнения 8 дней
Отзыв от заказчика
Jabir deliver excellent quality code and product even with high-end graphic requirement! If you are finding a developer that can deliver a QUALITY + AESTHETIC PLEASING program, he is the one!!!
Отзыв от исполнителя
Very precise customer and behavior very gentle. Like to work with him again and again...

Техническое задание

I would like to develop an indicator that can display Bid Ratio, Buy/sell Ratio and Gap (3 stuff) in 1 indicator. The formula to calculate each value will be given in the specification later. However, here is the general description

  1. Bid Ratio (Blue line - customisable ) - Current Bid price % with respect to high and low over a day (Default) /week/month (broker TF - customisable)
  2. Buy/Sell Ratio (Red line - customisable ) - Currency strength of the current currency
    1. It calculate 7 base pair Bid ratio and minus 7 quote pair bid ratio
  3. Gap (Lime line - customisable) - Change in Buy/Sell Ratio over the past XX minutes (30 minute by default but is also customisable)

All the value needed to reset over day (Default) /week/month (customisable - same setting use for Bid Ratio). To ease the visualisation, a vertical grey line will be draw at where the indicator calculation will reset.


Only 1 value will display at 1 time. So I need a button at the bottom right (Allow me to change position as well) of the Indicator to allow me navigate between this 3 value. Just make a small button with using the short cut below. Font size is 10 ( Default - allow me to change in the setting).

  • BR = Bid ratio. 
  • BS = Buy Sell ratio
  • G = Gap

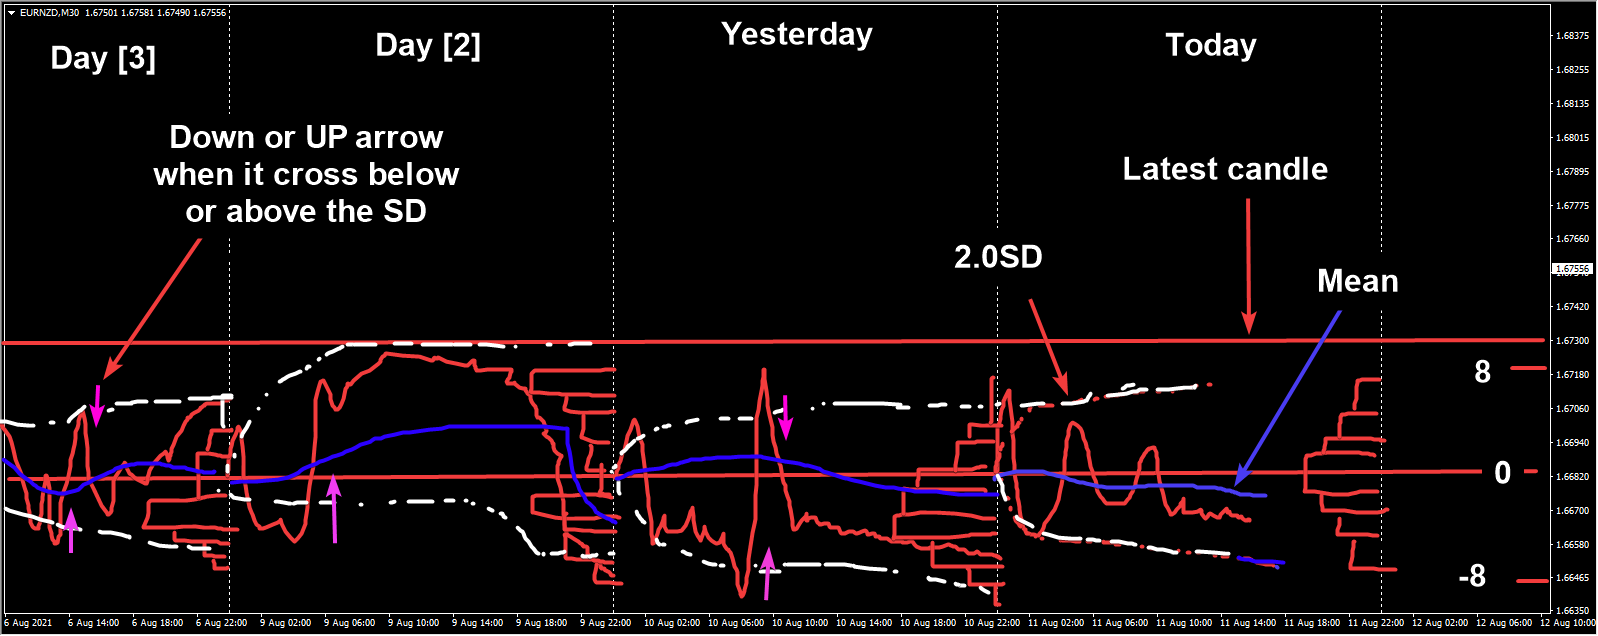
After the desire value has been plotted, starting from the where the indicator reset ( Eg. Daily), calculate the Bollinger band value of the indicator. For example

  1. I am using Buy Sell Ratio now and is reset on daily basic 
  2. It will calculate the mean price of the BS ratio and plot out the mean line together with Buy Sell Ratio
  3. A ( 2.0SD - customisable) will plot around the mean based on the standard deviation (SD) of indicator value (in this case BS ratio). This should continue and repeat for the past YY (default = 10) day
    1. (Optional) If possible, create an downward arrow when the value from top cross below the 2.0SD. Vice versa.
  4. A histogram chart will plotted on the left(or right - can change in setting) side where the indicator will reset by itself. In this case it will place on every day with hour=0. The histogram should only occupy 20% of the period. Meaning 1 day, the hour is 0 -24, and max value should only occupy from hour 19-24 (since it is at the right side).
    1. By default the bin size is 0.2and max/min value is +- 8(any number beyond that will be added here). This value need to be in setting as well.
    2. Calculate based on Current close price candle (fix)


Having the setting to export the data out and store in CSV. The indicator value for the past  YY (default = 10) day will be first store. The CSV will continue append the latest data every10sec (Default & changeable) The required data are:

  1. Symbol
  2. Broker time
  3. Local Time
  4. Close price
  5. Bid Ratio
  6. Buy Sell
  7. Gap

When the export setting is true, create a "Debugging" Yellow text at the top right of the chart so I know the CSV is collecting.

The file name is following the format: custom_name ( Default=CSIndi) + broker short name + symbol + date (year.month.day)


Expected final outcome


Ps: I forgot to draw 3 little button at the right side to change the indicator value type. But it is needed.


I do not accept indicator code that is generated.


Highly welcome developer that is communicative and experience in MQL indicator. Please communicate with me on your experience so I know if you are suitable in working with this project or not.

Source code is needed by the end of the project.


Откликнулись

1
Разработчик 1
Оценка
(115)
Проекты
129
18%
Арбитраж
11
27% / 55%
Просрочено
4
3%
Свободен
2
Разработчик 2
Оценка
(15)
Проекты
16
19%
Арбитраж
2
0% / 50%
Просрочено
1
6%
Свободен
3
Разработчик 3
Оценка
(155)
Проекты
239
70%
Арбитраж
3
67% / 33%
Просрочено
20
8%
Свободен
4
Разработчик 4
Оценка
(71)
Проекты
97
43%
Арбитраж
2
50% / 0%
Просрочено
2
2%
Свободен
Похожие заказы
I need any highly profitable MT5 robot which trades any sythetic indices on deriv very profitably. It should have good risk management and any good strategy The EA should have good risk management and can trade small accounts like 50 - 100USD Developers who have already made robots have higher chance
Mk 30+ USD
I need a fully automated trading robot designed to generate consistent profits while strictly controlling risk and minimizing losses. The robot should use a combination of strategies, including trend-following, scalping, and price action, and must be able to adapt to different market conditions such as trending and ranging markets. It should analyze the market using indicators like Moving Averages, RSI, MACD, and
Title: MT5 EA Needed – Prop‑Firm Compliance Tool (SL/TP at Entry, 60‑Second Hold, Daily Profit Cap, 0.5% XAUUSD Risk) Description: I need an MT5 Expert Advisor that enforces prop‑firm compliance rules for Instant Funding accounts. The EA must NOT trade automatically — it should only monitor and control my manual XAUUSD trading. I trade all sessions, so there should be no time restrictions. MY TRADING STYLE (Important
Simple MA indicator with buy and sell arrow with a push notification. Conditions for buy or sell should be when price breaks above or below the MA and then retraced back to the MA creating a HH/HL or LH/LL then the buy/sell signal arrow should be at the reversal candle that forms the HL/HH. And on indicator window1 RSI cross over MA and the RSI line
Hi, I hope you doing Greate, Let me share details , so the original EA already working but you can check and verify everything fine.First you verify that all original EA features are working correctly then add a user dashboard showing the number of detected zones, buy sell both none status, and an on off button. also ensure mitigated zones disappear properly and that trades follow the zone rules, and integrate the
1. IF price forms: - Higher highs + higher lows → TREND = BUY - Lower highs + lower lows → TREND = SELL ELSE → NO TRADE 2. IF: - Trend = BUY - Price retraces to support zone - Bullish engulfing candle forms - TDI green crosses above red (optional) THEN: - Execute BUY 3. IF: - Trend = SELL - Price retraces to resistance - Bearish engulfing forms - TDI confirms THEN: - Execute SELL 4. Risk per trade = 1% of account Lot
Apply with a screen of your work . Symbol Specific Logic . Live Chart Optimization Check the Core logic . [back tests as well] Change points to pips . Create buffer for the zone
Hi, I am looking for an Quant/MQL5 developer to build a pure mathematical, Delta-Neutral Statistical Arbitrage (spot vs future ) Expert Advisor. ​ No retail indicator logic (No RSI, MACD, etc.). This is a high-speed, spread-based execution model trading the pricing inefficiency between two correlated assets (e.g., Gold Spot XAUUSD vs Gold Futures). ​ Core Requirements at a Glance: ​Real-time Spread & Z-Score
Looking for a Proven Non-Repainting Gold Indicator (XAUUSD) – High Accuracy & Ready-Made Solutions Only 📌 Project Description: I am looking for a high-quality, non-repainting indicator specifically for XAUUSD (Gold) that is already developed and tested. ⚠️ Important: I am NOT looking for a new indicator to be built from scratch. I want an existing, proven system that you have already created and are confident in. 🎯
Fair Value Gap Expert , Optimize the core logic for live chart . [Filters are working] Lets ace the trailing stop . Change points to pip . Project will start from next week

Информация о проекте

Бюджет
50 - 150 USD
Сроки выполнения
от 5 до 10 дн.