Currency Strength Indicator display on Daily/Weekly/Monthly Basic

工作已完成

执行时间8 天
客户反馈
Jabir deliver excellent quality code and product even with high-end graphic requirement! If you are finding a developer that can deliver a QUALITY + AESTHETIC PLEASING program, he is the one!!!
员工反馈
Very precise customer and behavior very gentle. Like to work with him again and again...

指定

I would like to develop an indicator that can display Bid Ratio, Buy/sell Ratio and Gap (3 stuff) in 1 indicator. The formula to calculate each value will be given in the specification later. However, here is the general description

  1. Bid Ratio (Blue line - customisable ) - Current Bid price % with respect to high and low over a day (Default) /week/month (broker TF - customisable)
  2. Buy/Sell Ratio (Red line - customisable ) - Currency strength of the current currency
    1. It calculate 7 base pair Bid ratio and minus 7 quote pair bid ratio
  3. Gap (Lime line - customisable) - Change in Buy/Sell Ratio over the past XX minutes (30 minute by default but is also customisable)

All the value needed to reset over day (Default) /week/month (customisable - same setting use for Bid Ratio). To ease the visualisation, a vertical grey line will be draw at where the indicator calculation will reset.


Only 1 value will display at 1 time. So I need a button at the bottom right (Allow me to change position as well) of the Indicator to allow me navigate between this 3 value. Just make a small button with using the short cut below. Font size is 10 ( Default - allow me to change in the setting).

  • BR = Bid ratio. 
  • BS = Buy Sell ratio
  • G = Gap

After the desire value has been plotted, starting from the where the indicator reset ( Eg. Daily), calculate the Bollinger band value of the indicator. For example

  1. I am using Buy Sell Ratio now and is reset on daily basic 
  2. It will calculate the mean price of the BS ratio and plot out the mean line together with Buy Sell Ratio
  3. A ( 2.0SD - customisable) will plot around the mean based on the standard deviation (SD) of indicator value (in this case BS ratio). This should continue and repeat for the past YY (default = 10) day
    1. (Optional) If possible, create an downward arrow when the value from top cross below the 2.0SD. Vice versa.
  4. A histogram chart will plotted on the left(or right - can change in setting) side where the indicator will reset by itself. In this case it will place on every day with hour=0. The histogram should only occupy 20% of the period. Meaning 1 day, the hour is 0 -24, and max value should only occupy from hour 19-24 (since it is at the right side).
    1. By default the bin size is 0.2and max/min value is +- 8(any number beyond that will be added here). This value need to be in setting as well.
    2. Calculate based on Current close price candle (fix)


Having the setting to export the data out and store in CSV. The indicator value for the past  YY (default = 10) day will be first store. The CSV will continue append the latest data every10sec (Default & changeable) The required data are:

  1. Symbol
  2. Broker time
  3. Local Time
  4. Close price
  5. Bid Ratio
  6. Buy Sell
  7. Gap

When the export setting is true, create a "Debugging" Yellow text at the top right of the chart so I know the CSV is collecting.

The file name is following the format: custom_name ( Default=CSIndi) + broker short name + symbol + date (year.month.day)


Expected final outcome
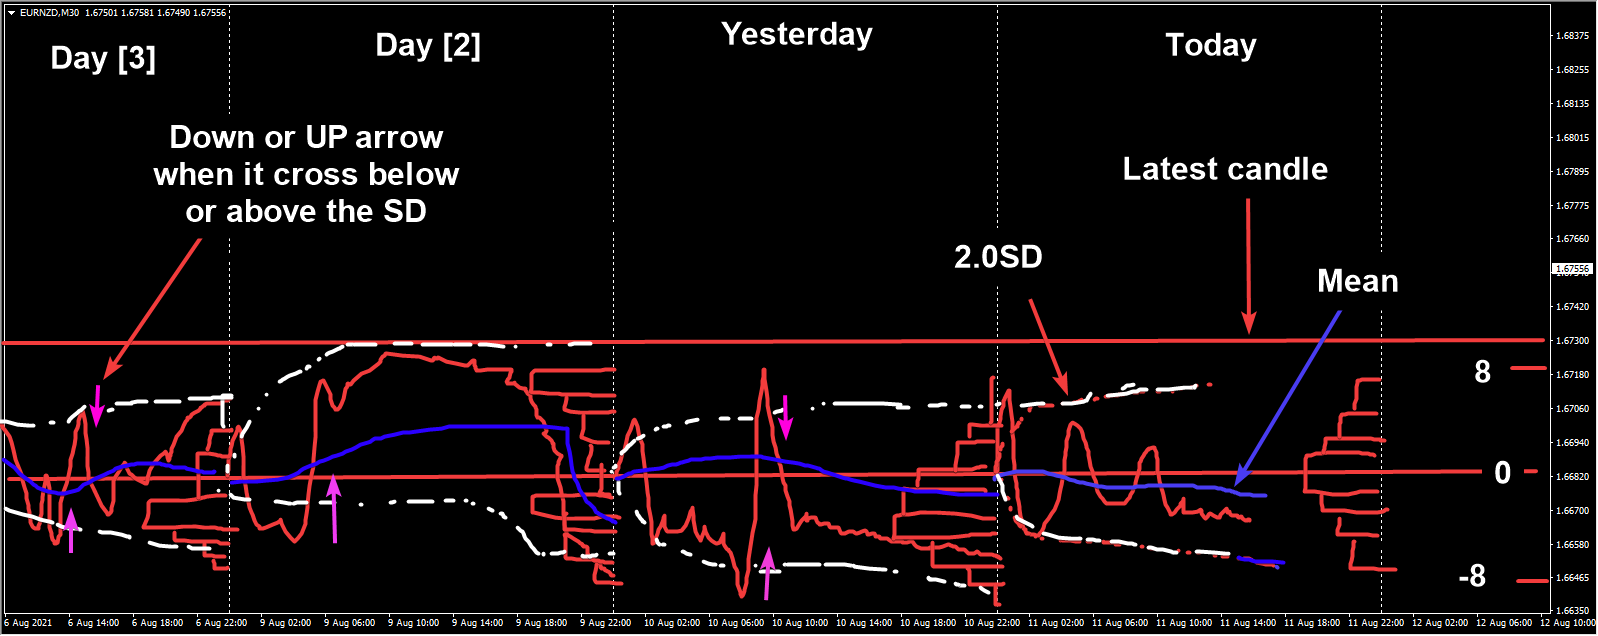

Ps: I forgot to draw 3 little button at the right side to change the indicator value type. But it is needed.


I do not accept indicator code that is generated.


Highly welcome developer that is communicative and experience in MQL indicator. Please communicate with me on your experience so I know if you are suitable in working with this project or not.

Source code is needed by the end of the project.


反馈

1
开发者 1
等级
(115)
项目
129
18%
仲裁
11
27% / 55%
逾期
4
3%
空闲
2
开发者 2
等级
(15)
项目
16
19%
仲裁
2
0% / 50%
逾期
1
6%
空闲
3
开发者 3
等级
(155)
项目
239
70%
仲裁
3
67% / 33%
逾期
20
8%
空闲
4
开发者 4
等级
(71)
项目
97
43%
仲裁
2
50% / 0%
逾期
2
2%
空闲
相似订单
Scalping bort 30+ USD
GOLD SCALPING BOT STRATEGY Symbol: XAUUSD (Gold vs USD) Broker: Exness Account: Standard Starting Balance: $20 1. TIMEFRAME - Trend analysis: M15. - Entry timeframe: M5. - Trade only when the market has a clear direction. 2. INDICATORS - EMA 50 - EMA 200 - RSI 14 - Support and Resistance 3. BUY RULES The bot must open a BUY trade only when all these conditions are met: 1. EMA 50 is above EMA 200 on M15. 2. Price is
Request for an Existing Automated Trading System (Expert Advisor) I am looking to acquire an existing, fully functional Expert Advisor (EA) that trades Forex CFDs, with the option of trading other CFDs if the strategy supports them safely. Performance objectives Target average net monthly return: 1.5%. A consistent 1.0% monthly return may be considered if the system demonstrates strong risk control and credible
I am looking for an experienced developer to build a professional web-based trading performance dashboard connected to an MT5 trading account and/or FX Blue. The dashboard should automatically collect trading data and display: • Daily P&L calendar – profitable days green, losing days red and no-trade days grey • Equity/growth curve • Drawdown curve • Initial capital and current balance • Net profit and percentage
Chciał bym w tej grze poznać dużo i zrozumieć ciężko bez języka mam tylko sms na gry nie mam kieszonkowych i kiepsko się trzymam finansowo żeby czasem myślę gdzie będę
Hi. I am looking for an experienced MQL5 developer for an advanced XAUUSD MT5 indicator. Before choosing a developer, I would like to see a small proof-of-concept or an example of a similar indicator you have already developed. My final indicator must be written from scratch in MQL5 and I must receive the complete .mq5 source code + compiled .ex5 . Main requirements: XAUUSD MT5 / MQL5 Indicator only — NO AutoTrading
Title: Advanced XAUUSD MT5 Indicator – MQL5 Source Code Required I need a professional MT5 indicator written from scratch in MQL5 (.mq5) for XAUUSD. The indicator must be signals/analysis only — AutoTrading must remain OFF . I need the complete editable .mq5 source code, not only an .ex5 file. The system should analyze multiple timeframes: H4 → H1 → M30 → M15 → M5 → M1 . Required logic: Higher-timeframe
I need a professional XAUUSD signal indicator for MetaTrader 5, written entirely in MQL5 (.mq5). IMPORTANT: This is NOT an auto-trading EA. It must never open, close or modify trades. It only analyzes XAUUSD and generates signals + MT5 push notifications. 1. Multi-timeframe analysis: H4 → H1 → M30 → M15 → M10 → M5 → M1. 2. Detect market structure: - Swing High / Swing Low - BOS - MSS - CHOCH - Bullish/Bearish HTF
i have indicator for Trading View, also copy for NT, i need someone to improve and check the NT version (indicator is simple is volume density koncept)…. when i put same settings on TV version and NT version i have diffrerent results, but this can be because diffrent market data or fact that TV sending tick info in blocks , not tick by tick like NT8 on both. I(ndicator base on counting volume) so besied that is it
looking for a highly experienced mql5 developer to build a professional trading ea based on multi timeframe top down analysis and market structure concepts the system should combine higher timeframe context with lower timeframe execution and provide both precise logic and clean visual representation on chart ⸻ core requirements • implementation of multi timeframe logic higher timeframe bias combined with lower

项目信息

预算
50 - 150 USD
截止日期
从 5 到 10 天