Taras Slobodyanik / Perfil
- Informações
|
10+ anos
experiência
|
60
produtos
|
243
versão demo
|
|
630
trabalhos
|
0
sinais
|
0
assinantes
|
1) Added parameter: "Check Lines crossing only in OB/OS zones".
------------------------------------------------------------
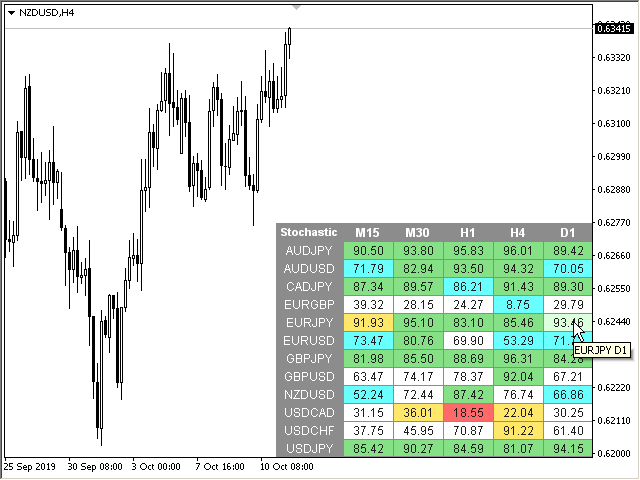
Dashboard Stochastic Multicurrency (обновление 2.0)
1) Добавлен параметр: "Определять пересечение Линий только в зонах Перекупленности/Перепроданности".
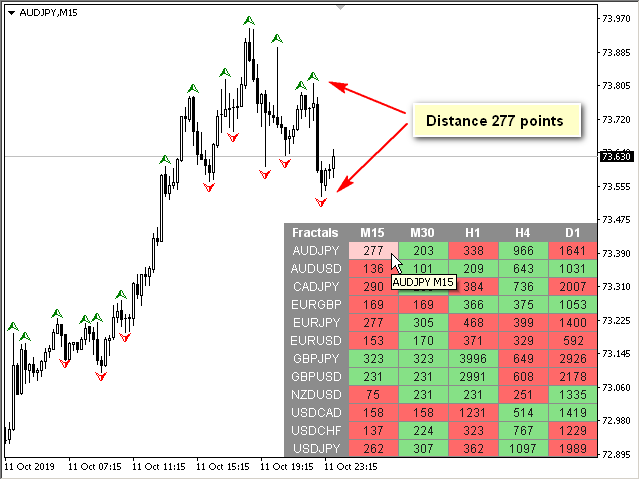
1) Added a new indicator mode: Distance between fractals.
2) Code optimization.
------------------------------------------------------------
Fractals Dashboard (обновление 1.3)
1) Добавлен новый режим индикатора: Дистанция между фракталами.
2) Оптимизация кода.
1) Added the crossing of the Main line and the Signal line (display in the table and alert).
------------------------------------------------------------
Dashboard Stochastic Multicurrency (обновление 1.9)
1) Добавлено пересечение Основной линии и Сигнальной линии (отображение в таблице и алерт).
This is a multicurrency and multitimeframe indicator that calculates the angle between two points. Points for measuring the angle can be taken from the ZigZag (the last two points), or from the Moving Average (between two given bars), or it can be the closing prices of bars. Angle measurement is possible in degrees or in radians. You can select the scale for the calculation. For a better understanding of the indicator, you can study the free Angle High Low indicator. In the parameters you can
1) Added moving the Square using the WASD keys.
2) Code optimization.
------------------------------------------------------------
Gann Square of 144 (обновление 2.5)
1) Добавлено перемещение Квадрата с помощью клавиш WASD.
2) Оптимизация кода.
1) Added parameter: "Bars to calculate ZZ".
2) Fixed incorrect display for high Depth.
------------------------------------------------------------
ZigZag Dashboard (MT4 & MT5) (обновление 1.4)
1) Добавлен параметр: "Bars to calculate ZZ".
2) Исправлена ошибка неправильного отображения при большом Depth.
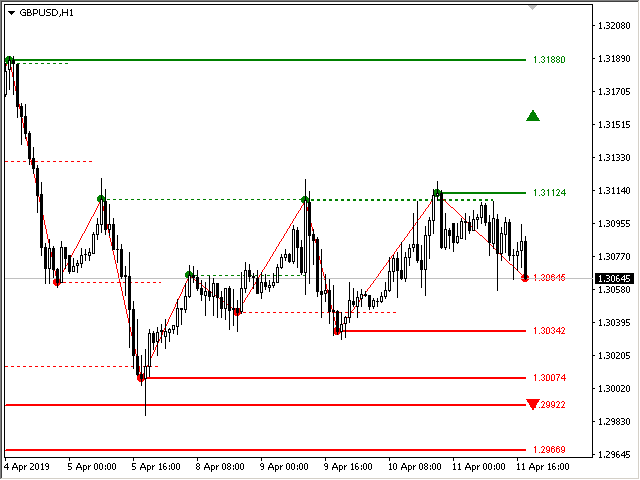
1) Added new mode "ZigZag Close".
2) Added alert when the price is near the line.
------------------------------------------------------------
ZigZag Lines MTF (MT4 & MT5) (обновление 3.4)
1) Добавлен новый режим "ZigZag Close".
2) Добавлен алерт когда цена возле линии.
Modificação multimoeda e multitimeframe do indicador Commodity Channel Index (CCI). Você pode especificar quaisquer moedas e prazos desejados nos parâmetros. Além disso, o painel pode enviar notificações ao cruzar níveis de sobrecompra e sobrevenda. Ao clicar em uma célula com ponto final, este símbolo e ponto final serão abertos. Este é o scanner MTF. A chave para ocultar o painel do gráfico é “D” por padrão. Parâmetros CCI Period — período médio. CCI Applied price — tipo de preço. Clear the
1) Added an alert to exit the overbought / oversold zone.
2) Added parameter: "Check alerts only on bar closing".
------------------------------------------------------------
Dashboard RSI Multicurrency (MT4 & MT5) (обновление 1.7)
1) Добавлен алерт выхода из зоны перекупленности/перепроданности.
2) Добавлен параметр: "Check alerts only on bar closing".
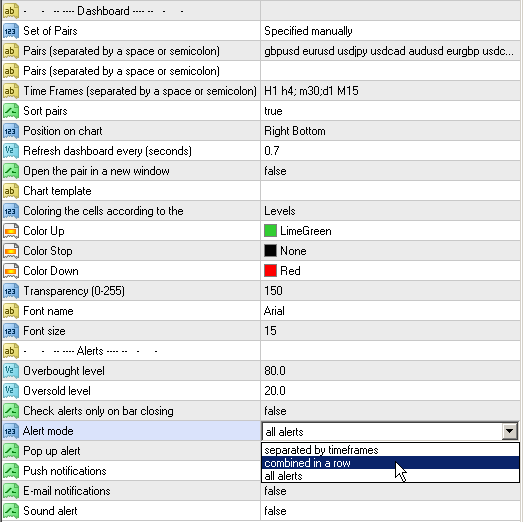
1) Added modes for alerts.
2) Added the option to display information about the previous wave.
------------------------------------------------------------
ZigZag Dashboard (MT4 & MT5) (обновление 1.3)
1) Добавлены режимы для алертов.
2) Добавлен параметр для отображения информации о предыдущей волне.
The indicator draws the time scale on the chart. You can specify the time offset, adjust the size and font to display on the chart ( it is displaying your local time on your chart instead of MT time ). You can also select the desired format for displaying the date and time. You may be interested in my other product , which contains a more advanced version of the Time Scale . You can also find my other products here . Parameters Hours (time shift) — time shift (hours); Minutes (time
The indicator draws the time scale on the chart. You can specify the time offset, adjust the size and font to display on the chart (it is displaying your local time on your chart instead of MT time). You can also select the desired format for displaying the date and time. While holding down the middle mouse button, and moving the cursor, a slider will appear on the scale. You may be interested in my other product , which contains a more advanced version of the Time Scale. You can also find
1) Added modes for alerts.
------------------------------------------------------------
Stochastic Dashboard Multicurrency (MT4 & MT5) (обновление 1.6)
1) Добавлены режимы для алертов.
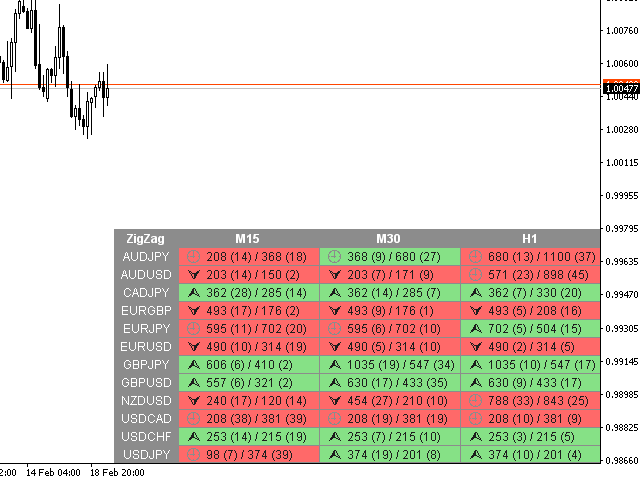
1) Added the number of bars in the ZigZag.
2) Added arrows showing the breaking through of the previous point and the corresponding alerts.
------------------------------------------------------------
ZigZag Dashboard (обновление 1.2)
1) Добавлено число баров в ЗигЗаге.
2) Добавлены стрелки, отображающие пробитие предыдущей точки и соответствующие алерты.
Modificação multimoeda e multitimeframe do indicador Fractals. Exibe os dois últimos fractais — sua sequência (e qual está quebrada) ou a distância entre eles. Você pode especificar quaisquer moedas e prazos desejados nos parâmetros. Além disso, o painel pode enviar notificações sobre o rompimento de um fractal. Ao clicar em uma célula com ponto final, este símbolo e ponto final serão abertos. Este é o scanner MTF. A chave para ocultar o painel do gráfico é “D” por padrão. Parâmetros
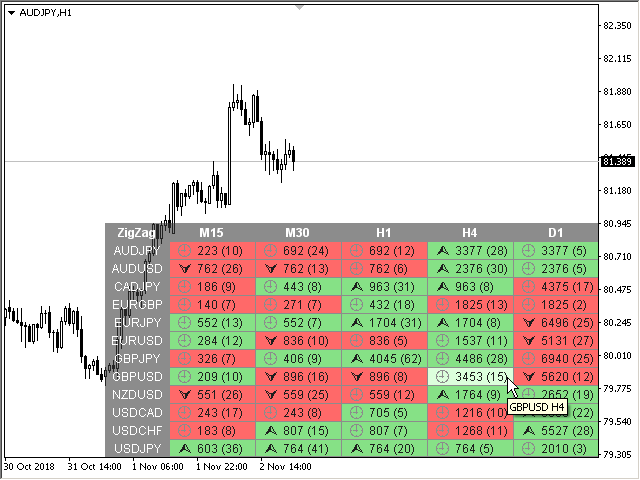
Modificação multimoeda e multitimeframe do indicador ZigZag. Exibe a direção atual do mercado, a altura do último movimento, o número de barras neste movimento e a quebra do ponto anterior do ZigZag (linha horizontal). Este é o scanner MTF. Você pode especificar quaisquer moedas e prazos desejados nos parâmetros. Além disso, o painel pode enviar notificações quando o ZigZag mudar de direção ou quando houver um rompimento do ponto anterior. Ao clicar em uma célula com ponto final, este símbolo e