Gold Analysis: 28 July, 2021: FED INTEREST RATE DAY.
ECB is unlikely to raise the interest rates until at least 2023
ECB’s dovish shift is bad news for the yellow metal
:: ultra-low interest rates for even longer
:: asset purchases under the Pandemic Emergency Purchase Programme at the current (faster than it was originated) pace over the third quarter of 2021
::No bazookas
*Impact: *
DOLLAR appreciated relative to the euro after the ECB’s monetary policy meeting.
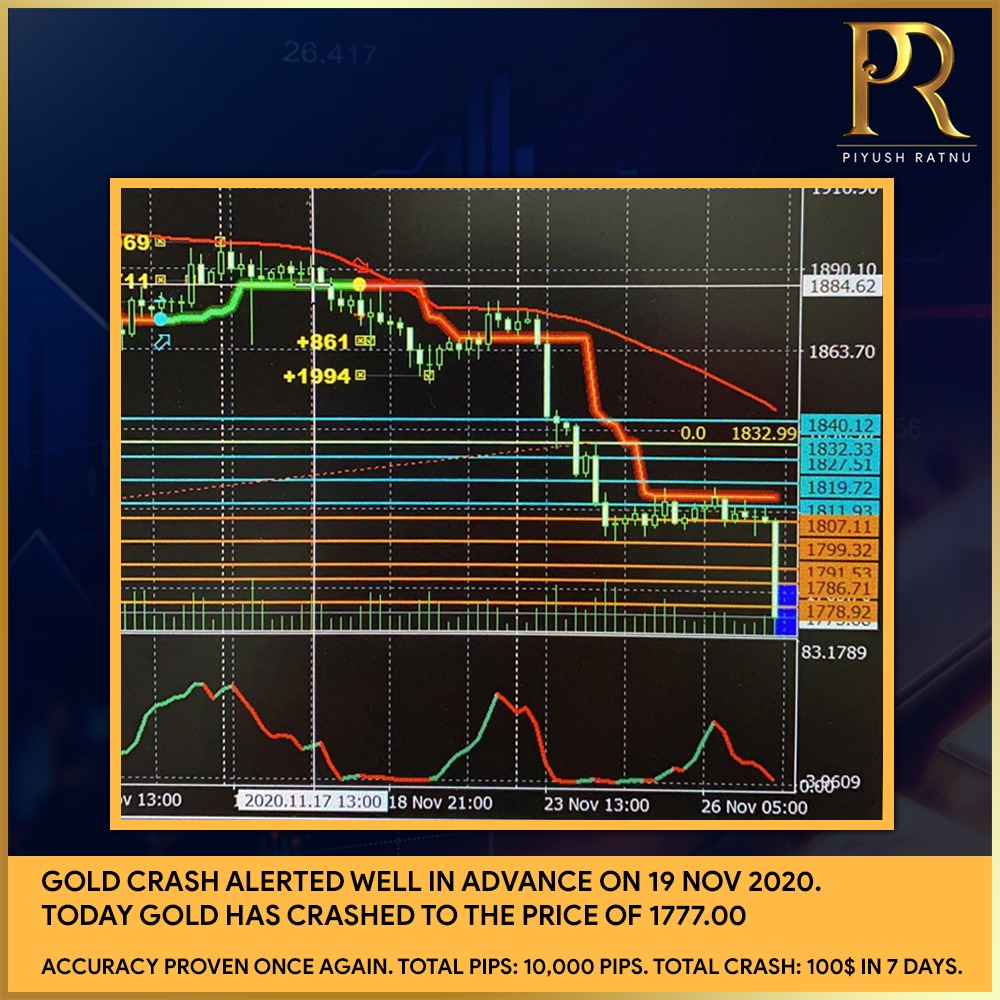
Result: GOLD crashed.
Current price zone: 1796-1818
The Fed looks hawkish in comparison to the ECB
*FOCUS: *
:: tapering and monetary policy, and it’s normalization
:: the timing of tapering amid surging inflation in the US
:: the divergence in monetary policy and interest rates
:: the Fed is expected to hint at a likely taper starting off from the final quarter of this year.
OIL Co-relation:
Oil prices continue to recoup previous losses as traders bet on tightening supply. It’s swift recovery above 71.10 is an encouraging sign that buyers are still hanging around. Following the breakout, 70.10 has established itself as fresh support.
YIELDS
**On Tuesday, the US dollar has given back more ground as real US bond yields hit all-time lows, supporting the yellow metal.
Todays, The dollar fell, despite a generalized dismal mood. Global stocks edged lower, while demand for government bonds increased, pushing yields lower.
**The yield on 10-year Treasury inflation-protected securities (TIPS) hit an all-time low -1.147% before rebounding to -1.116%.
**Traders are buying DOLLAR (repetition of Last JULY format) due to COVID concerns, soaring cases, restrictions and seriousness of B.1.617.2.
**10-year breakeven inflation rates rose to 2.40% and nominal yields fell to 1.25%. Nominal yields suggest bond markets are getting increasingly concerned about the potential deflationary impact of the delta variant, but inflation break evens suggest greater concern about the current inflation outlook.
**US infrastructure bill added volatility and optimism in market, recently.
**To hedge the potential economic fallout from the spread of the highly contagious Delta variant
**China's regulatory crackdown is impacting equities & stocks
**The risk-off impulse in the markets depicts a generally negative tone around the equity markets, supporting GOLD.
**Surging covid cases in Asia is supporting DOLLAR.
GOLD: Current Status:
Monetary Policy Related Scenarios:
Gold would be expected to gain on a less hawkish and more cautionary tone, pushing the US dollar down of its carry trade advantage over cross currencies.
Tapering could be mentioned in the official statement, which would be a very hawkish surprise and would be expected to support the US dollar. The US dollar smile theory could also come into play given the global spread of the delta variant. If the Fed sounds the alarm bells too aggressively, this will favour the dollar and cap any bullish advances in gold for now.
CONSOLIDATION:
The current consolidation is a sign of indecision ahead of a catalyst-driven breakout. 1823 is a major hurdle and its breach would heighten momentum and resume the stalled rally till 1855-1866 (resistance zone).
SCK:
H1 H4 D1 GOLD is currently in OVERSOLD area
Past 15 days Oscillation: 1790-1818 price zone.
SMA & FIB:
D SMA5 Stands at 1827 (1818-1823 zone) indicating a tough resistance at 1823, suggesting SELLS above 1818 price level till 38.2% with price gap of $5 between each trade set to exit in NET AVERAGE PROFIT in the same set.
SMA SUMMARY
Daily SMA20 1800.64
Daily SMA50 1833.41
Daily SMA100 1797.04
Daily SMA200 1822.82
S/R Levels
LEVELS
Previous Daily High 1811.55
Previous Daily Low 1796.42
Previous Weekly High 1825.04
Previous Weekly Low 1789.8
Previous Monthly High 1916.62
Previous Monthly Low 1750.77
Daily Fibonacci 38.2% 1802.2
Daily Fibonacci 61.8% 1805.77
Daily Pivot Point S1 1792.2
Daily Pivot Point S2 1786.75
Daily Pivot Point S3 1777.07
Daily Pivot Point R1 1807.33
Daily Pivot Point R2 1817.01
Daily Pivot Point R3 1822.46
Summary:
APPLY: RM 5 steps | GP 6 steps | Gaps: $3 after 15 minutes or $25 movement and exit at FIB 23.6 and 38.2% in M5, M15 as, trend based price movement might be observed during Japanese Session followed by consolidation in London Session.
In any case the 30% retracement, will be observed in rise or crash: both the scenarios within 24 hours of price movement, on a longer term FIB RT 50% can be the target price as per H1, to book profits in a time frame of 12-18 trading days.
SELL above 1827: and exit in NAP
1830
1836
1842
BUY below 1777: and exit in NAP.
1770
1765
1760
1755
1750
Do not risk more than 3% of Principle, inorder to recover the trades in case of a high volatility crash or rise. I suggest to take positions at 15 minutes after the interest rate decision and 30 minutes after the conference.
ECB is unlikely to raise the interest rates until at least 2023
ECB’s dovish shift is bad news for the yellow metal
:: ultra-low interest rates for even longer
:: asset purchases under the Pandemic Emergency Purchase Programme at the current (faster than it was originated) pace over the third quarter of 2021
::No bazookas
*Impact: *
DOLLAR appreciated relative to the euro after the ECB’s monetary policy meeting.
Result: GOLD crashed.
Current price zone: 1796-1818
The Fed looks hawkish in comparison to the ECB
*FOCUS: *
:: tapering and monetary policy, and it’s normalization
:: the timing of tapering amid surging inflation in the US
:: the divergence in monetary policy and interest rates
:: the Fed is expected to hint at a likely taper starting off from the final quarter of this year.
OIL Co-relation:
Oil prices continue to recoup previous losses as traders bet on tightening supply. It’s swift recovery above 71.10 is an encouraging sign that buyers are still hanging around. Following the breakout, 70.10 has established itself as fresh support.
YIELDS
**On Tuesday, the US dollar has given back more ground as real US bond yields hit all-time lows, supporting the yellow metal.
Todays, The dollar fell, despite a generalized dismal mood. Global stocks edged lower, while demand for government bonds increased, pushing yields lower.
**The yield on 10-year Treasury inflation-protected securities (TIPS) hit an all-time low -1.147% before rebounding to -1.116%.
**Traders are buying DOLLAR (repetition of Last JULY format) due to COVID concerns, soaring cases, restrictions and seriousness of B.1.617.2.
**10-year breakeven inflation rates rose to 2.40% and nominal yields fell to 1.25%. Nominal yields suggest bond markets are getting increasingly concerned about the potential deflationary impact of the delta variant, but inflation break evens suggest greater concern about the current inflation outlook.
**US infrastructure bill added volatility and optimism in market, recently.
**To hedge the potential economic fallout from the spread of the highly contagious Delta variant
**China's regulatory crackdown is impacting equities & stocks
**The risk-off impulse in the markets depicts a generally negative tone around the equity markets, supporting GOLD.
**Surging covid cases in Asia is supporting DOLLAR.
GOLD: Current Status:
Monetary Policy Related Scenarios:
Gold would be expected to gain on a less hawkish and more cautionary tone, pushing the US dollar down of its carry trade advantage over cross currencies.
Tapering could be mentioned in the official statement, which would be a very hawkish surprise and would be expected to support the US dollar. The US dollar smile theory could also come into play given the global spread of the delta variant. If the Fed sounds the alarm bells too aggressively, this will favour the dollar and cap any bullish advances in gold for now.
CONSOLIDATION:
The current consolidation is a sign of indecision ahead of a catalyst-driven breakout. 1823 is a major hurdle and its breach would heighten momentum and resume the stalled rally till 1855-1866 (resistance zone).
SCK:
H1 H4 D1 GOLD is currently in OVERSOLD area
Past 15 days Oscillation: 1790-1818 price zone.
SMA & FIB:
D SMA5 Stands at 1827 (1818-1823 zone) indicating a tough resistance at 1823, suggesting SELLS above 1818 price level till 38.2% with price gap of $5 between each trade set to exit in NET AVERAGE PROFIT in the same set.
SMA SUMMARY
Daily SMA20 1800.64
Daily SMA50 1833.41
Daily SMA100 1797.04
Daily SMA200 1822.82
S/R Levels
LEVELS
Previous Daily High 1811.55
Previous Daily Low 1796.42
Previous Weekly High 1825.04
Previous Weekly Low 1789.8
Previous Monthly High 1916.62
Previous Monthly Low 1750.77
Daily Fibonacci 38.2% 1802.2
Daily Fibonacci 61.8% 1805.77
Daily Pivot Point S1 1792.2
Daily Pivot Point S2 1786.75
Daily Pivot Point S3 1777.07
Daily Pivot Point R1 1807.33
Daily Pivot Point R2 1817.01
Daily Pivot Point R3 1822.46
Summary:
APPLY: RM 5 steps | GP 6 steps | Gaps: $3 after 15 minutes or $25 movement and exit at FIB 23.6 and 38.2% in M5, M15 as, trend based price movement might be observed during Japanese Session followed by consolidation in London Session.
In any case the 30% retracement, will be observed in rise or crash: both the scenarios within 24 hours of price movement, on a longer term FIB RT 50% can be the target price as per H1, to book profits in a time frame of 12-18 trading days.
SELL above 1827: and exit in NAP
1830
1836
1842
BUY below 1777: and exit in NAP.
1770
1765
1760
1755
1750
Do not risk more than 3% of Principle, inorder to recover the trades in case of a high volatility crash or rise. I suggest to take positions at 15 minutes after the interest rate decision and 30 minutes after the conference.