Rosenildo Araujo De Souza / Perfil
- Informações
|
7+ anos
experiência
|
1
produtos
|
101
versão demo
|
|
0
trabalhos
|
0
sinais
|
0
assinantes
|
Pivot Point RSouza
https://www.mql5.com/pt/market/product/29553
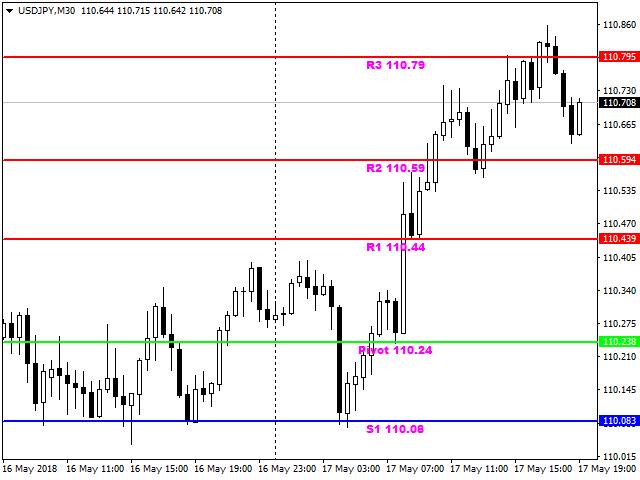
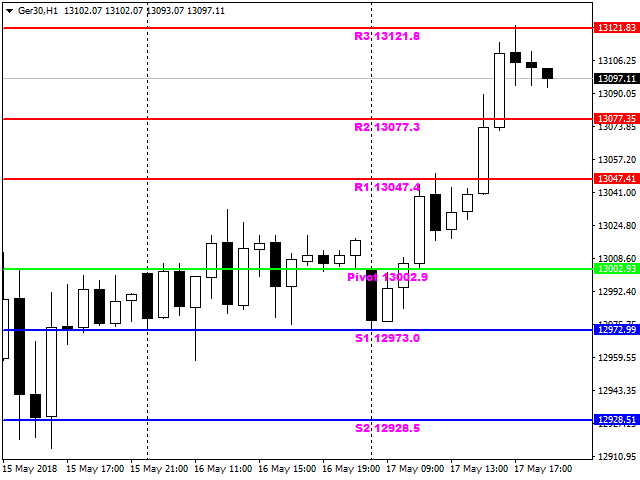
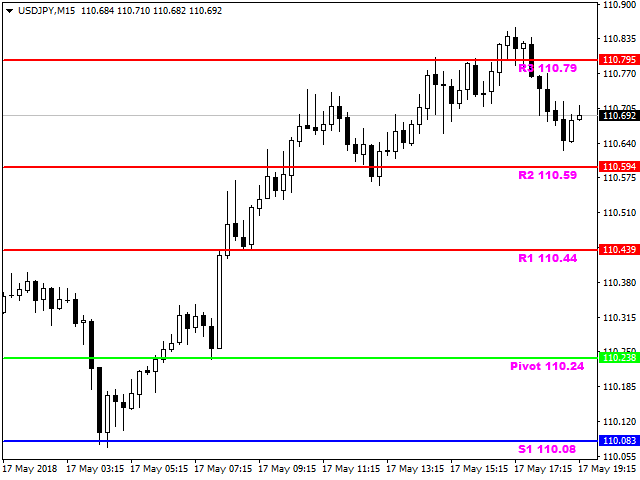
This indicator automatically calculates the levels of the pivot points and draws the lines on the chart.
The lines that are drawn: Pivot line, line R1, line R2, line R3, line S1, line S2, line S3.
Below each line, the value of your level is displayed.
The pivot points are calculated using the traditional method.
The colors of the lines and font are configurable, as well as the font size of the text.
It can only be used at periods equal to or less than D1.
Display Parameters:
-Font color - text color of the values of the indicator levels.
-Font size - font size of the text.
-Color line resistance .
-Color line support - color of the support line.
-Color line pivot point - color of the pivot point line.
Product: https://www.mql5.com/pt/market/product/29553
Amigos
91
Pedidos
Enviados
Rosenildo Araujo De Souza
Pivot Point RSouza
https://www.mql5.com/pt/market/product/29553
This indicator automatically calculates the levels of the pivot points and draws the lines on the chart.
The lines that are drawn: Pivot line, line R1, line R2, line R3, line S1, line S2, line S3.
Below each line, the value of your level is displayed.
The pivot points are calculated using the traditional method.
The colors of the lines and font are configurable, as well as the font size of the text.
It can only be used at periods equal to or less than D1.
Display Parameters:
-Font color - text color of the values of the indicator levels.
-Font size - font size of the text.
-Color line resistance .
-Color line support - color of the support line.
-Color line pivot point - color of the pivot point line.
Product: https://www.mql5.com/pt/market/product/29553
https://www.mql5.com/pt/market/product/29553
This indicator automatically calculates the levels of the pivot points and draws the lines on the chart.
The lines that are drawn: Pivot line, line R1, line R2, line R3, line S1, line S2, line S3.
Below each line, the value of your level is displayed.
The pivot points are calculated using the traditional method.
The colors of the lines and font are configurable, as well as the font size of the text.
It can only be used at periods equal to or less than D1.
Display Parameters:
-Font color - text color of the values of the indicator levels.
-Font size - font size of the text.
-Color line resistance .
-Color line support - color of the support line.
-Color line pivot point - color of the pivot point line.
Product: https://www.mql5.com/pt/market/product/29553

Rosenildo Araujo De Souza
Pivot Point RSouza
https://www.mql5.com/pt/market/product/29553
This indicator automatically calculates the levels of the pivot points and draws the lines on the chart.
The lines that are drawn: Pivot line, line R1, line R2, line R3, line S1, line S2, line S3.
Below each line, the value of your level is displayed.
The pivot points are calculated using the traditional method.
The colors of the lines and font are configurable, as well as the font size of the text.
It can only be used at periods equal to or less than D1.
Display Parameters:
-Font color - text color of the values of the indicator levels.
-Font size - font size of the text.
-Color line resistance .
-Color line support - color of the support line.
-Color line pivot point - color of the pivot point line.
Product: https://www.mql5.com/pt/market/product/29553
https://www.mql5.com/pt/market/product/29553
This indicator automatically calculates the levels of the pivot points and draws the lines on the chart.
The lines that are drawn: Pivot line, line R1, line R2, line R3, line S1, line S2, line S3.
Below each line, the value of your level is displayed.
The pivot points are calculated using the traditional method.
The colors of the lines and font are configurable, as well as the font size of the text.
It can only be used at periods equal to or less than D1.
Display Parameters:
-Font color - text color of the values of the indicator levels.
-Font size - font size of the text.
-Color line resistance .
-Color line support - color of the support line.
-Color line pivot point - color of the pivot point line.
Product: https://www.mql5.com/pt/market/product/29553

Rosenildo Araujo De Souza
Pivot Point RSouza
https://www.mql5.com/pt/market/product/29553
This indicator automatically calculates the levels of the pivot points and draws the lines on the chart.
The lines that are drawn: Pivot line, line R1, line R2, line R3, line S1, line S2, line S3.
Below each line, the value of your level is displayed.
The pivot points are calculated using the traditional method.
The colors of the lines and font are configurable, as well as the font size of the text.
It can only be used at periods equal to or less than D1.
Display Parameters:
-Font color - text color of the values of the indicator levels.
-Font size - font size of the text.
-Color line resistance .
-Color line support - color of the support line.
-Color line pivot point - color of the pivot point line.
Product: https://www.mql5.com/pt/market/product/29553
https://www.mql5.com/pt/market/product/29553
This indicator automatically calculates the levels of the pivot points and draws the lines on the chart.
The lines that are drawn: Pivot line, line R1, line R2, line R3, line S1, line S2, line S3.
Below each line, the value of your level is displayed.
The pivot points are calculated using the traditional method.
The colors of the lines and font are configurable, as well as the font size of the text.
It can only be used at periods equal to or less than D1.
Display Parameters:
-Font color - text color of the values of the indicator levels.
-Font size - font size of the text.
-Color line resistance .
-Color line support - color of the support line.
-Color line pivot point - color of the pivot point line.
Product: https://www.mql5.com/pt/market/product/29553

Rosenildo Araujo De Souza
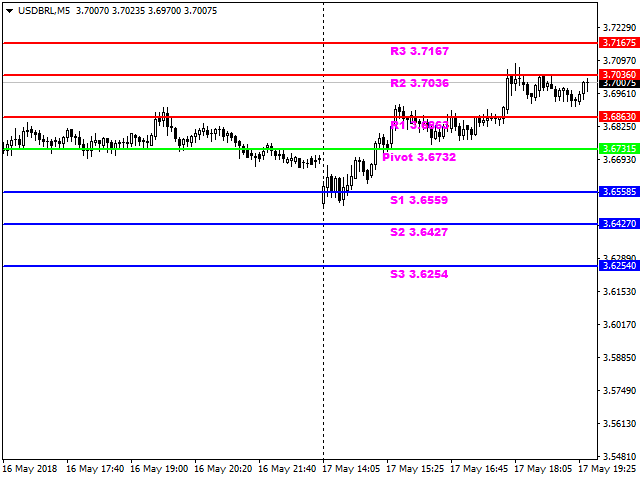
This indicator automatically calculates the levels of pivot points and draws the lines on the chart.
The lines that are drawn: Pivot Line, R1 Line, R2 Line, R3 Line, S1 Line, S2 Line, S3 Line.
Below each line, your level value is displayed.
Pivot points are calculated using the traditional method.
Line and font colors are configurable, as is the font size of the text.
It can only be used in periods equal to or less than D1.
indicator parameters
Font color - text color of indicator levels values.
Font size - font size of the text.
Color line resistance - color of the resistance line.
Color line support - color of the support line.
Color line pivot point - color of the pivot point line.
Product: https://www.mql5.com/pt/market/product/29553

Rosenildo Araujo De Souza
Pivot Point RSouza
https://www.mql5.com/pt/market/product/29553
This indicator automatically calculates the levels of the pivot points and draws the lines on the chart.
The lines that are drawn: Pivot line, line R1, line R2, line R3, line S1, line S2, line S3.
Below each line, the value of your level is displayed.
The pivot points are calculated using the traditional method.
The colors of the lines and font are configurable, as well as the font size of the text.
It can only be used at periods equal to or less than D1.
Display Parameters:
-Font color - text color of the values of the indicator levels.
-Font size - font size of the text.
-Color line resistance .
-Color line support - color of the support line.
-Color line pivot point - color of the pivot point line.
Product: https://www.mql5.com/pt/market/product/29553
https://www.mql5.com/pt/market/product/29553
This indicator automatically calculates the levels of the pivot points and draws the lines on the chart.
The lines that are drawn: Pivot line, line R1, line R2, line R3, line S1, line S2, line S3.
Below each line, the value of your level is displayed.
The pivot points are calculated using the traditional method.
The colors of the lines and font are configurable, as well as the font size of the text.
It can only be used at periods equal to or less than D1.
Display Parameters:
-Font color - text color of the values of the indicator levels.
-Font size - font size of the text.
-Color line resistance .
-Color line support - color of the support line.
-Color line pivot point - color of the pivot point line.
Product: https://www.mql5.com/pt/market/product/29553
Rosenildo Araujo De Souza
produto compartilhado
Este indicador calcula automaticamente os níveis dos pontos de pivô e desenha as linhas no gráfico. As linhas que são desenhadas: Linha de Pivô, linha R1, linha R2, linha R3, linha S1, linha S2, linha S3. Abaixo de cada linha, o valor do seu nível é exibido. Os pontos de pivô são calculados usando o método tradicional. As cores das linhas e da fonte são configuráveis, e também o tamanho da fonte do texto. Só pode ser usado em períodos iguais ou inferiores a D1. Parâmetros do indicador Font color
Rosenildo Araujo De Souza

Pivot Point RSouza this indicator automatically calculates the levels of the pivot points and draws the lines on the chart.
The lines that are drawn: Pivot line, line R1, line R2, line R3, line S1, line S2, line S3.
Below each line, the value of your level is displayed.
The pivot points are calculated using the traditional method.
The colors of the lines and font are configurable, as well as the font size of the text.
It can only be used at periods equal to or less than D1. Display Parameters:
-Font color - text color of the values of the indicator levels.
-Font size - font size of the text.
-Color line resistance .
-Color line support - color of the support line.
-Color line pivot point - color of the pivot point line. Product: https://www.mql5.com/pt/market/product/29553

:
