|
7+ 년도
경험
|
1
제품
|
100
데몬 버전
|
|
0
작업
|
0
거래 신호
|
0
구독자
|
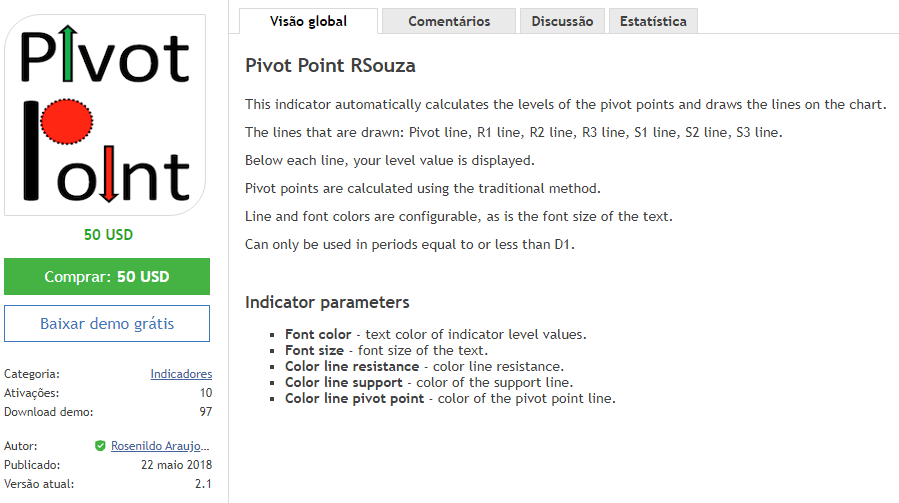
Pivot Point RSouza
https://www.mql5.com/pt/market/product/29553
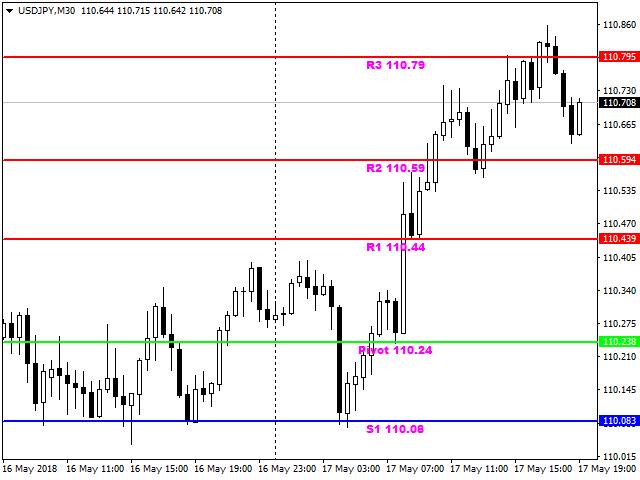
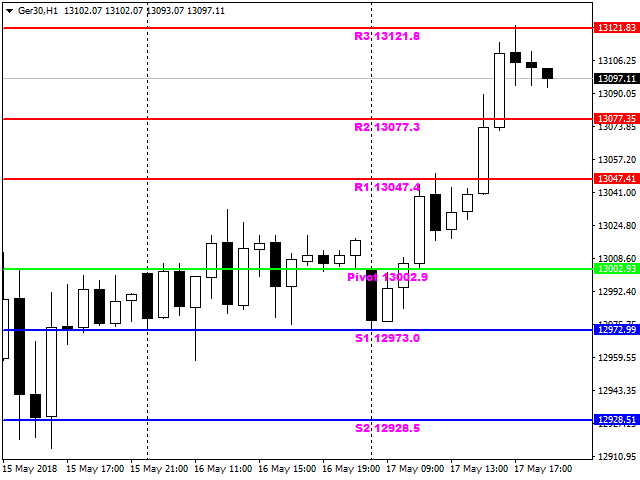
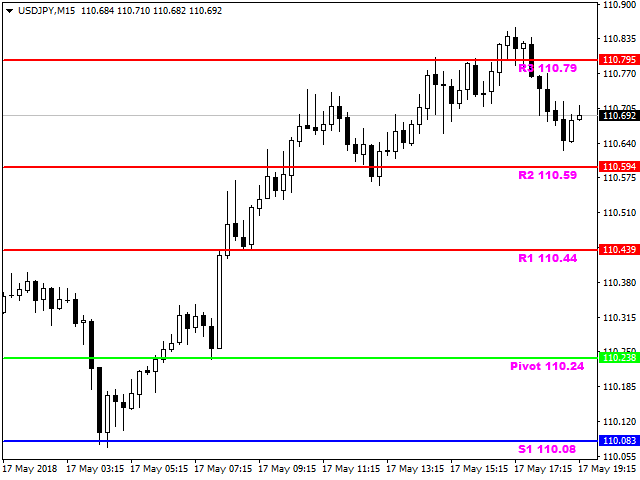
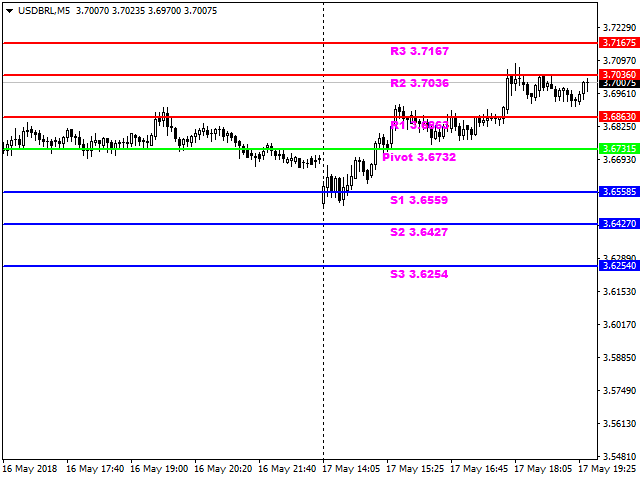
This indicator automatically calculates the levels of the pivot points and draws the lines on the chart.
The lines that are drawn: Pivot line, line R1, line R2, line R3, line S1, line S2, line S3.
Below each line, the value of your level is displayed.
The pivot points are calculated using the traditional method.
The colors of the lines and font are configurable, as well as the font size of the text.
It can only be used at periods equal to or less than D1.
Display Parameters:
-Font color - text color of the values of the indicator levels.
-Font size - font size of the text.
-Color line resistance .
-Color line support - color of the support line.
-Color line pivot point - color of the pivot point line.
Product: https://www.mql5.com/pt/market/product/29553
https://www.mql5.com/pt/market/product/29553
This indicator automatically calculates the levels of the pivot points and draws the lines on the chart.
The lines that are drawn: Pivot line, line R1, line R2, line R3, line S1, line S2, line S3.
Below each line, the value of your level is displayed.
The pivot points are calculated using the traditional method.
The colors of the lines and font are configurable, as well as the font size of the text.
It can only be used at periods equal to or less than D1.
Display Parameters:
-Font color - text color of the values of the indicator levels.
-Font size - font size of the text.
-Color line resistance .
-Color line support - color of the support line.
-Color line pivot point - color of the pivot point line.
Product: https://www.mql5.com/pt/market/product/29553