|
no
experiência
|
7
produtos
|
0
versão demo
|
|
0
trabalhos
|
0
sinais
|
0
assinantes
|
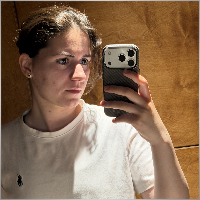
Hi, I'm Milana.
I came into trading at 14. I am 18 now, which means four years in front of the charts: learning, losing, reviewing and starting again until the market began to make sense. I started working for myself, and I have built everything on my own since then, with no investors and no team behind me. My main market is NASDAQ (US100).
I got into programming because I could not find tools that showed the market the way I read it. So I learned to write them myself, first in Pine Script for TradingView (3.8k followers) and now in MQL5 for MetaTrader 5
I run a YouTube channel that has almost 7k followers , with free lessons on ICT concepts: Candle Range Theory, liquidity, true opens, daily bias. I explain things the way I wish someone had explained them to me at 14: plainly, with examples
Outside the charts I train. I played competitive basketball later moved to CrossFit and strength training. Sport is where my discipline comes from, and I bring the same approach to trading: routine, patience, and honest review of my own mistakes.
What you can expect from me here: good trading free and paid tools. I do not sell signals and I do not promise profit. My Instagram : milana.muslimova_
I came into trading at 14. I am 18 now, which means four years in front of the charts: learning, losing, reviewing and starting again until the market began to make sense. I started working for myself, and I have built everything on my own since then, with no investors and no team behind me. My main market is NASDAQ (US100).
I got into programming because I could not find tools that showed the market the way I read it. So I learned to write them myself, first in Pine Script for TradingView (3.8k followers) and now in MQL5 for MetaTrader 5
I run a YouTube channel that has almost 7k followers , with free lessons on ICT concepts: Candle Range Theory, liquidity, true opens, daily bias. I explain things the way I wish someone had explained them to me at 14: plainly, with examples
Outside the charts I train. I played competitive basketball later moved to CrossFit and strength training. Sport is where my discipline comes from, and I bring the same approach to trading: routine, patience, and honest review of my own mistakes.
What you can expect from me here: good trading free and paid tools. I do not sell signals and I do not promise profit. My Instagram : milana.muslimova_


