Traders need clear, volatility-adjusted reference levels across multiple timeframes without cluttering the chart with separate indicators or constant manual calculations. This indicator provides a single visual grid system that shows ATR-derived spacing from a chosen anchor (current open candle or last closed candle). This supports grid trading, mean-reversion setups, range identification, and multi-timeframe confluence analysis. The optional State 3 mode adds a time-based 12-hour cycle (AM/PM
Visualize ATR-based volatility grids across up to 9 timeframes on a single chart. The indicator places horizontal levels scaled to each timeframe’s ATR so traders can quickly see multi-timeframe confluence, potential support/resistance zones, and volatility context without switching charts. Benefits Individual color per timeframe (defaults form a progressive dark-to-bright fade) for instant visual separation. Best for a strategy tester visual Flexible ATR period, multiplier, and min/max spacing
Lock multi-timeframe ATR grids to any candlestick you click. This gives a clear visual of volatility-based levels (from M1 through MN1) relative to a specific bar instead of always floating with the current price. Benefits Instant multi-TF ATR view locked to a chosen candle Color-coded grids (yellow fade) so each timeframe is easy to distinguish Optional side legend and pips labels for quick reading Fallback modes (open/closed candle or 12-hour cycle) when nothing is selected Clean
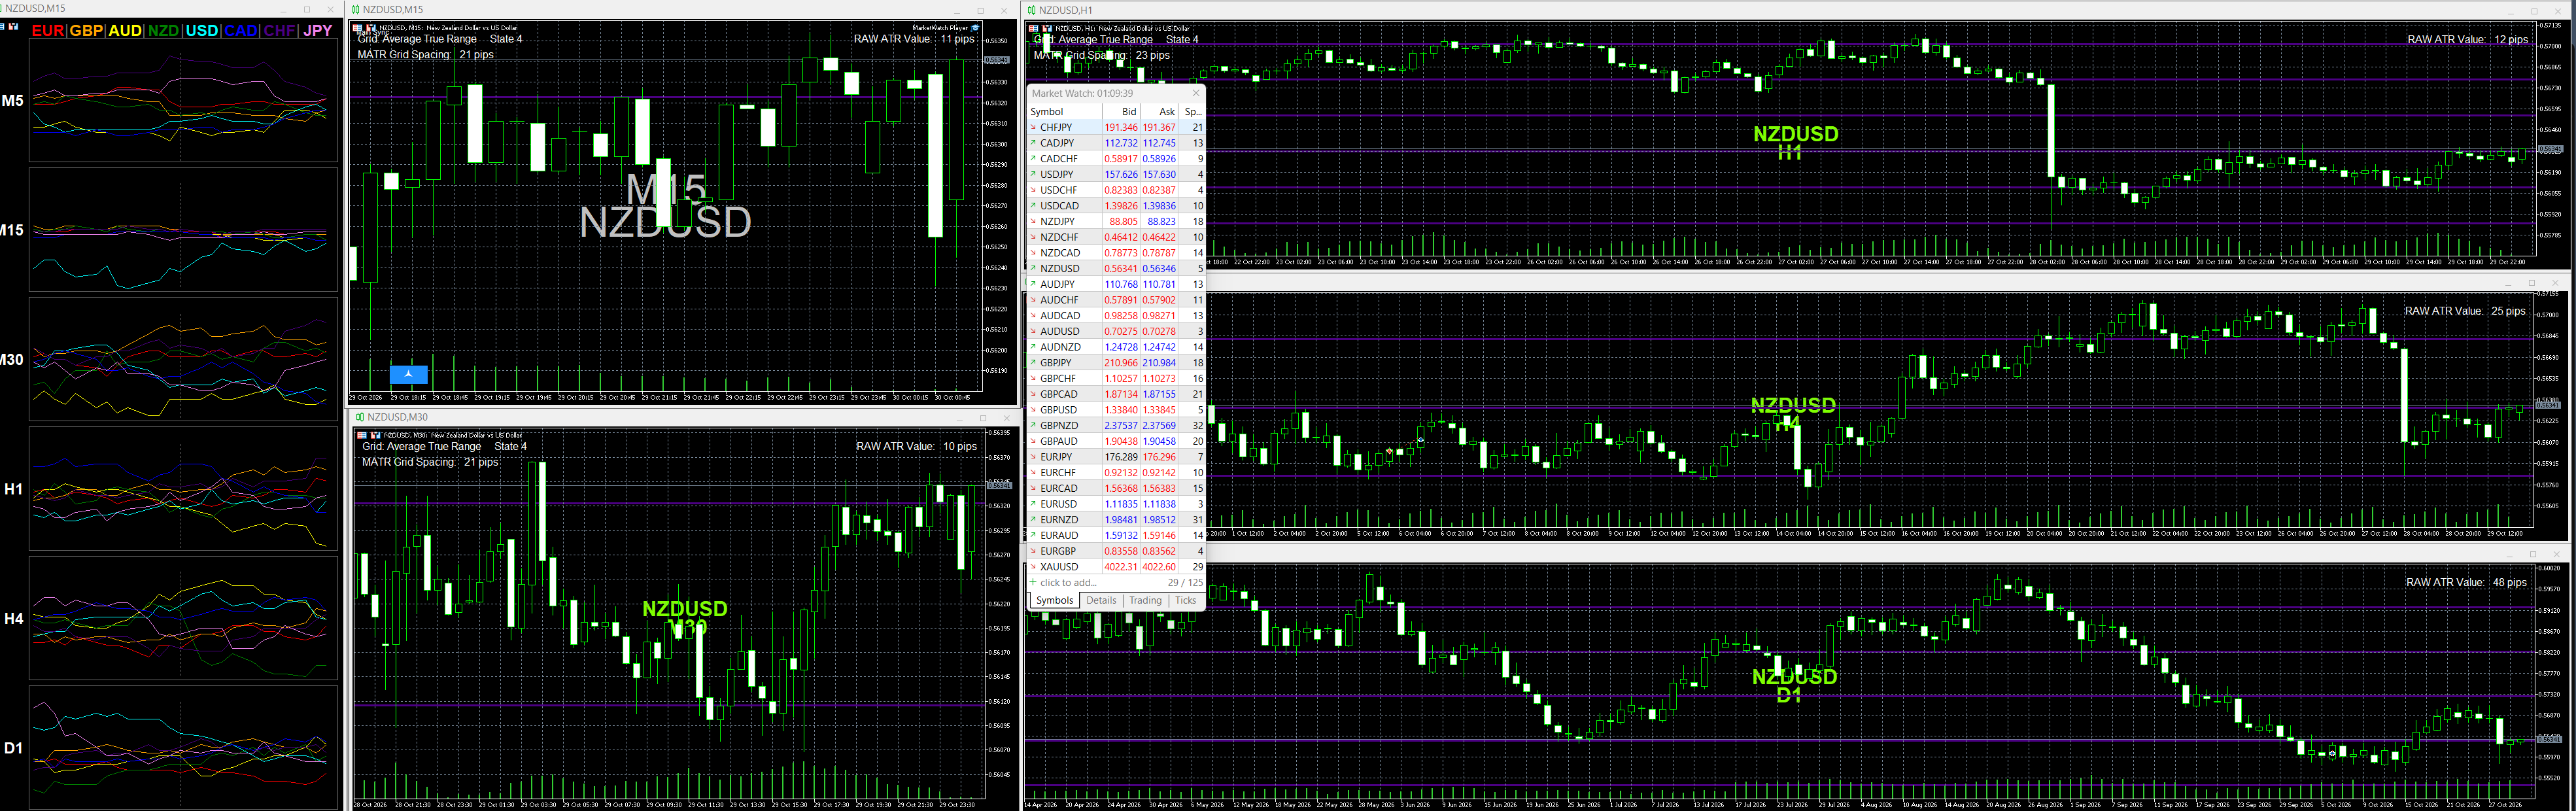
Comparing my type of trading view versus people who stay with one chart at a time, this picture is the mindset needed to enable the common sense. You know, you need is some foundation of science literacy so that you can inoculate yourself against those who exploit your absence of knowledge and how the science works for their own gain. So, it was one of the great challenges in life is knowing enough to think your right but not enough to know you’re wrong. Science! The only point of the scientific method is to make sure you are not fooled into thinking that something is true, that is not. Or thinking that something is not true that is. That is the only point.
A Market Watch multi-timeframe ATR dashboard that turns a chart into a full-screen table showing each selected symbol’s recent volatility across multiple timeframes. It calculates ATR for the symbols visible in Market Watch, then displays the result in pips, points, or raw price units. Its practical use is volatility scanning, quickly finding instruments and timeframes that are moving enough—or quietly enough—for your trading style.
It’s a real shame watching traders camp out on one lonely chart for hours, completely blind to the dozens of other symbols on their own Market Watch that are quietly setting up better opportunities. With Sync All Charts keeping every open chart locked in perfect time and price, Market Watch Player automatically rotating you through every symbol in 20-second bursts, and MultiTimeframe Chart Launcher instantly popping open the full stack of timeframes for any pair you pause on, you get a living, full-market scan that no single-chart sitter can ever match. This system forces you to see the entire board instead of falling in love with one instrument, so you catch the real high-probability setups as they appear across the market instead of forcing mediocre trades on the chart you just happen to be staring at.
is a native chart-management script. When run on a chart, it opens separate charts for the same symbol at the enabled timeframes, from M1 through MN1. By default, it opens M15, M30, H1, H4, and D1. You can enable or disable each supported timeframe to create a workspace suited to your analysis. Key Benefits One-Click Multi-Timeframe Access: Open all selected timeframes without manually creating each chart. Flexible Configuration: Enable or disable individual timeframes from M1 to MN1. Cleaner
is a native chart-management script. When run on a chart, it opens separate charts for the same symbol at the enabled timeframes, from M1 through MN1. By default, it opens M15, M30, H1, H4, and D1. You can enable or disable each supported timeframe to create a workspace suited to your analysis. Key Benefits One-Click Multi-Timeframe Access: Open all selected timeframes without manually creating each chart. Flexible Configuration: Enable or disable individual timeframes from M1 to MN1. Cleaner
Automatically cycles through every symbol in your Market Watch at a user-defined interval, letting you scan multiple pairs hands-free without manually changing charts. Benefits Hands-free multi-pair scanning with adjustable speed and optional reverse direction Reliable play/pause button that stays on-chart and can be placed in any corner with custom colors Optional large centered Symbol + Timeframe labels (stacked, with adjustable spacing) that can sit behind or in front of price Remembers its
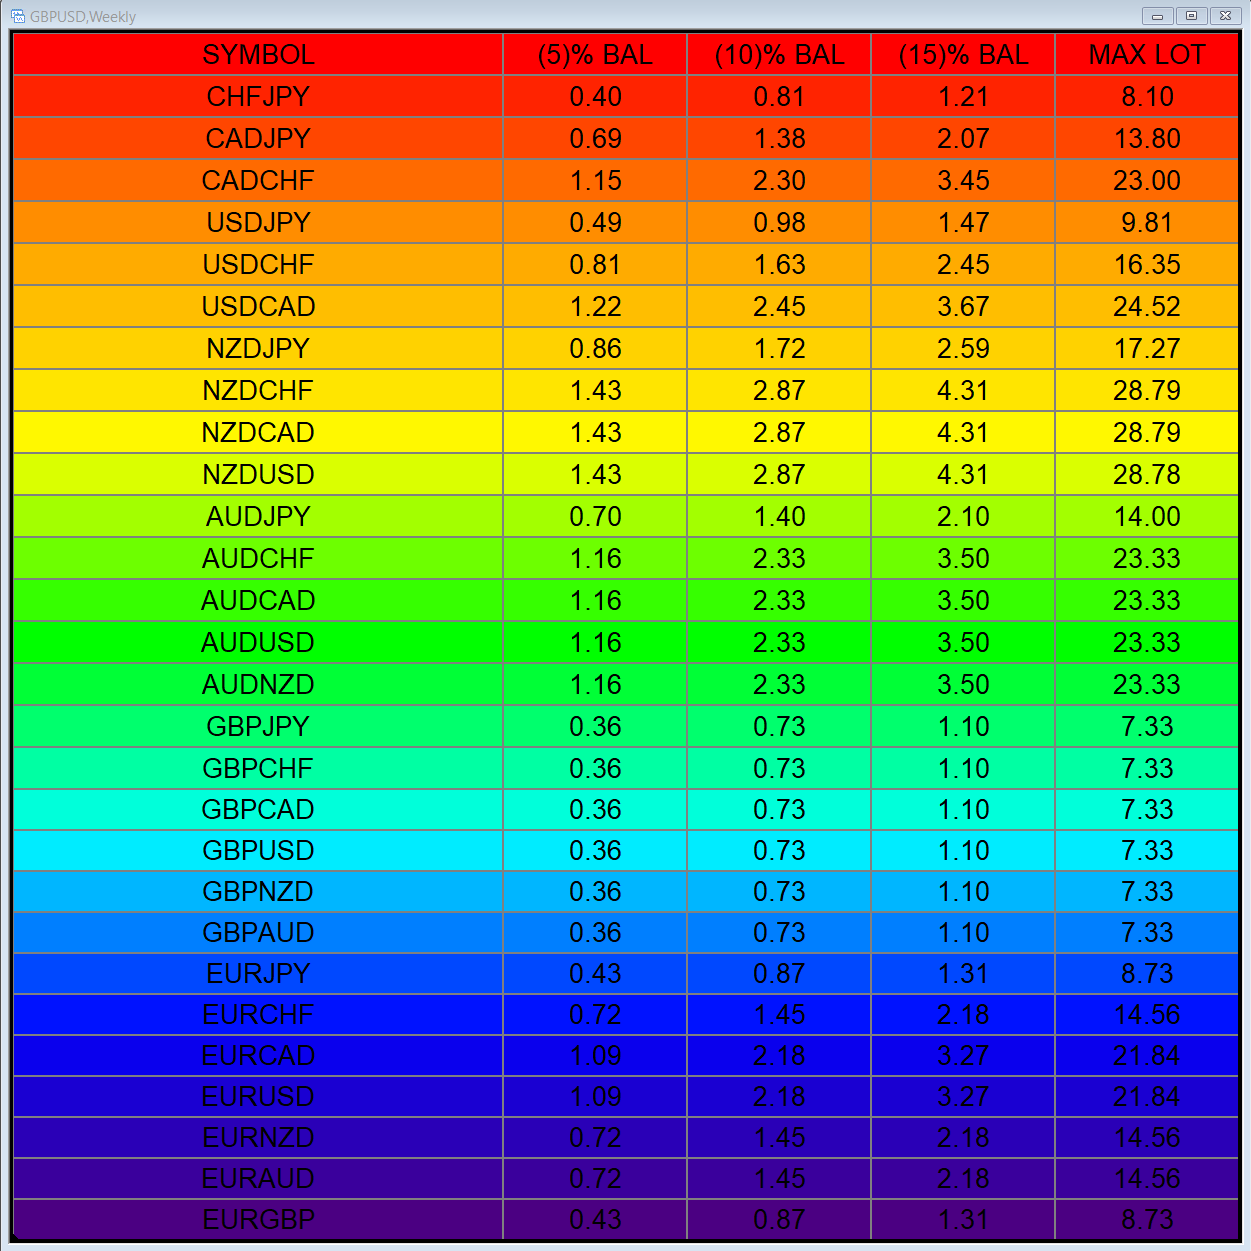
Powered by the Market Watch and Account Balance, this Expert Advisor calculates suggested lot sizes for every symbol based on a percentage of your account balance. It displays three columns (Symbol, % Risked, Max Lot), with the % Risked and Max Lot columns available as optional display settings.
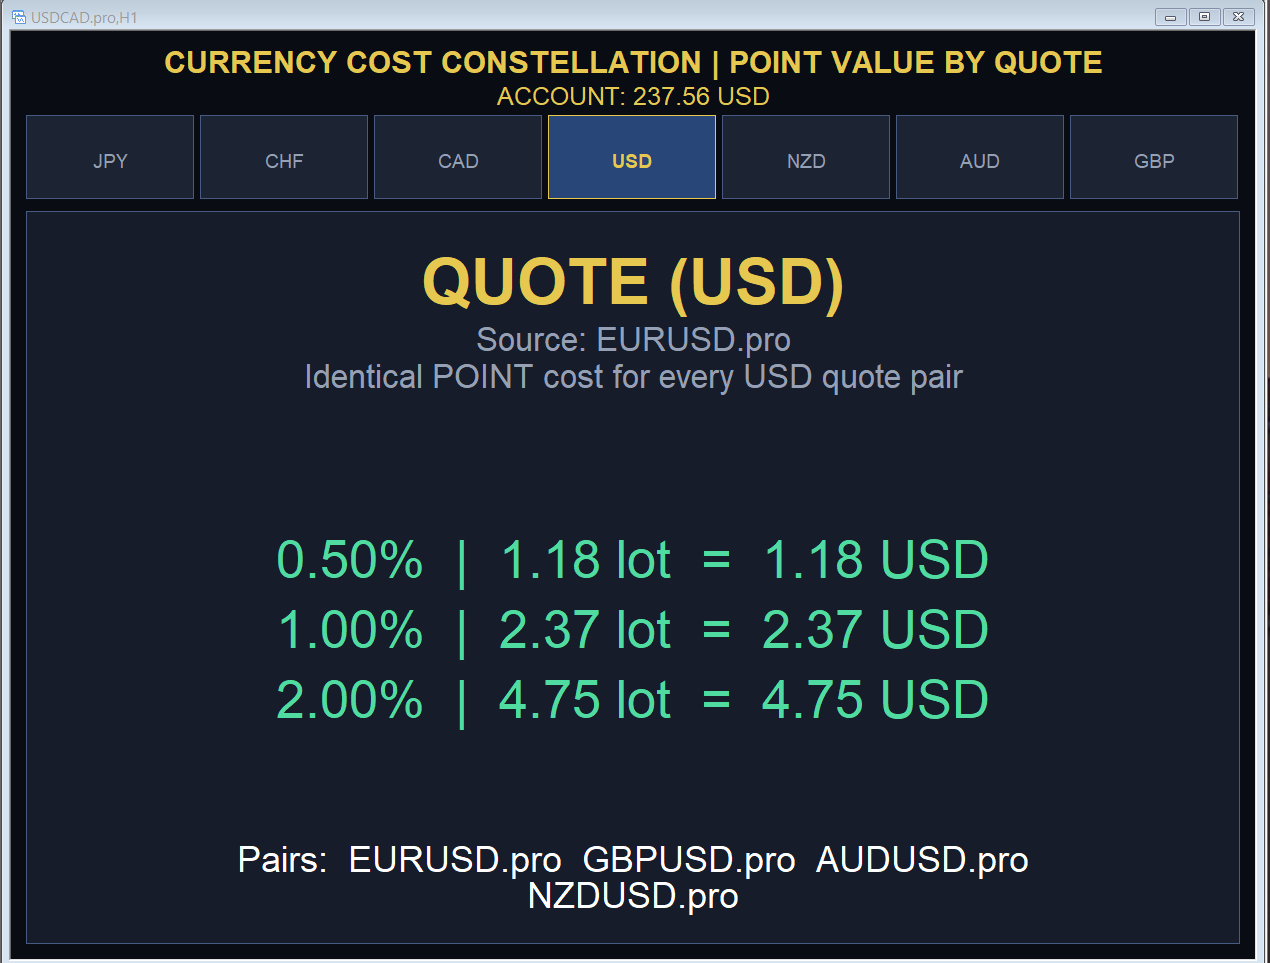
Both indicators show the shared pip or point cost for every major quote currency and instantly convert three risk percentages (or fixed lots) into the exact lot sizes that expose that amount of your account.
**Example:** On the JPY tab, 1.00% risk of a $500 account equals 0.37 lots, and a 1-point move on that position is worth $2.33.
We Traders know that the FX market moves endlessly through Time and Price, but do you know the cost of a SINGLE PIP OR POINT (and how to find its calculation)?
Whatever you see on my seller page is applications I couldn’t find elsewhere being original or even secondary. Whatever chart app you can think of that “I don’t have”, someone else already made it.
This EA gives traders a clean, full-window view of how large a position each Market Watch symbol can support at different percentages of account balance used as margin. It helps you quickly compare sizing options across symbols and risk levels without ever placing or modifying orders. The goal is simple position-size awareness so you can decide exposure before you trade. Benefits Shows lot size potential across Market Watch symbols at up to three different % of balance margin levels
This EA gives traders a clean, full-window view of how large a position each Market Watch symbol can support at different percentages of account balance used as margin. It helps you quickly compare sizing options across symbols and risk levels without ever placing or modifying orders. The goal is simple position-size awareness so you can decide exposure before you trade. Benefits Shows lot size potential across Market Watch symbols at up to three different % of balance margin levels
Built to innovate. Designed to evolve. Take ownership of your trading journey with FX-oriented applications that upgrade both your trading style and your lifestyle.
gives you the power to close every open chart window at once — no matter the symbol, timeframe, number of indicators, Expert Advisors, or objects on them. When you attach it, a confirmation dialog appears. Only after you explicitly grant permission does the script shut down all charts, leaving you on the clean gray screen with Market Watch still fully available. From there you can rebuild your layout from scratch exactly the way you want it. Ideal for: Quickly clearing a cluttered multi-chart
is a multi-timeframe visual matrix that tracks the relative linear progression (log-return strength) of the eight major currencies — EUR, GBP, AUD, NZD, USD, CAD, CHF, and JPY — across selected timeframes in a single responsive panel. Motive Traders often struggle to quickly see which currencies are gaining or losing strength relative to one another across multiple timeframes. This indicator condenses that information into color-coded progression lines so you can immediately identify strong