Rogerio Figurelli
Rogerio Figurelli
3.7 (14)
  • Informações
13+ anos
experiência
0
produtos
0
versão demo
7
trabalhos
0
sinais
0
assinantes
Trajecta - Consultoria e Projeto de Robôs - http://www.trajecta.com.br
LinkedIn: https://br.linkedin.com/in/figurelli
Livros publicados: https://goo.gl/j9mhPi
Cursos publicados: https://www.udemy.com/user/rogerio-figurelli/
Entrevista com Rogério Figurelli (ATC 2012) https://www.mql5.com/en/articles/561
---
Rogerio Figurelli
Rogerio Figurelli
Introducing Trajecta ClusterMap - from quantitative to qualitative

Examples of visual information to trading analysis and decision support, based on this indicator:

Volatility: long areas can indicate high volatility.
Lateral Movement: several mix of colors can indicate that market is not trending.
Trend Force: just one color can indicate that market is trending.
Divergence: start of new colors can indicate a market divergence and start of new trend.
Risk: be aware about unusual maps formats since they can indicate risk market scenarios.
Cycles: usual maps formats can indicate cycle market scenarios.
Scenarios: pattern maps formats can indicate usual market scenarios.
Correlations: pattern maps formats between two instruments can indicate pair trading opportunities.
Combinations: up and down trend colors combination (new color) can indicate lateral market or trend changing to lateral.
Support and Resistence: white areas (no color) can indicate weak to strong support and resistance areas.
Rogerio Figurelli
Rogerio Figurelli
Introducing Trajecta ForceMap - from quantitative to qualitative

Examples of visual information to trading analysis and decision support, based on this indicator:

Volatility: long areas can indicate high volatility.
Lateral Movement: several mix of colors can indicate that market is not trending.
Trend Force: just one color can indicate that market is trending.
Divergence: start of new colors can indicate a market divergence and start of new trend.
Risk: be aware about unusual maps formats since they can indicate risk market scenarios.
Cycles: usual maps formats can indicate cycle market scenarios.
Scenarios: pattern maps formats can indicate usual market scenarios.
Correlations: pattern maps formats between two instruments can indicate pair trading opportunities.
Combinations: up and down trend colors combination (new color) can indicate lateral market or trend changing to lateral.
Support and Resistence: white areas (no color) can indicate weak to strong support and resistance areas.
Rogerio Figurelli
Rogerio Figurelli
Introducing Trajecta SpeedMap - from quantitative to qualitative

Examples of visual information to trading analysis and decision support, based on this indicator:

Volatility: long areas can indicate high volatility.
Lateral Movement: several mix of colors can indicate that market is not trending.
Trend Force: just one color can indicate that market is trending.
Divergence: start of new colors can indicate a market divergence and start of new trend.
Risk: be aware about unusual maps formats since they can indicate risk market scenarios.
Cycles: usual maps formats can indicate cycle market scenarios.
Scenarios: pattern maps formats can indicate usual market scenarios.
Correlations: pattern maps formats between two instruments can indicate pair trading opportunities.
Combinations: up and down trend colors combination (new color) can indicate lateral market or trend changing to lateral.
Support and Resistence: white areas (no color) can indicate weak to strong support and resistance areas.
Rogerio Figurelli
Rogerio Figurelli
Trajecta ForceMap for Brazilian Future Bovespa Index
Rogerio Figurelli
Rogerio Figurelli
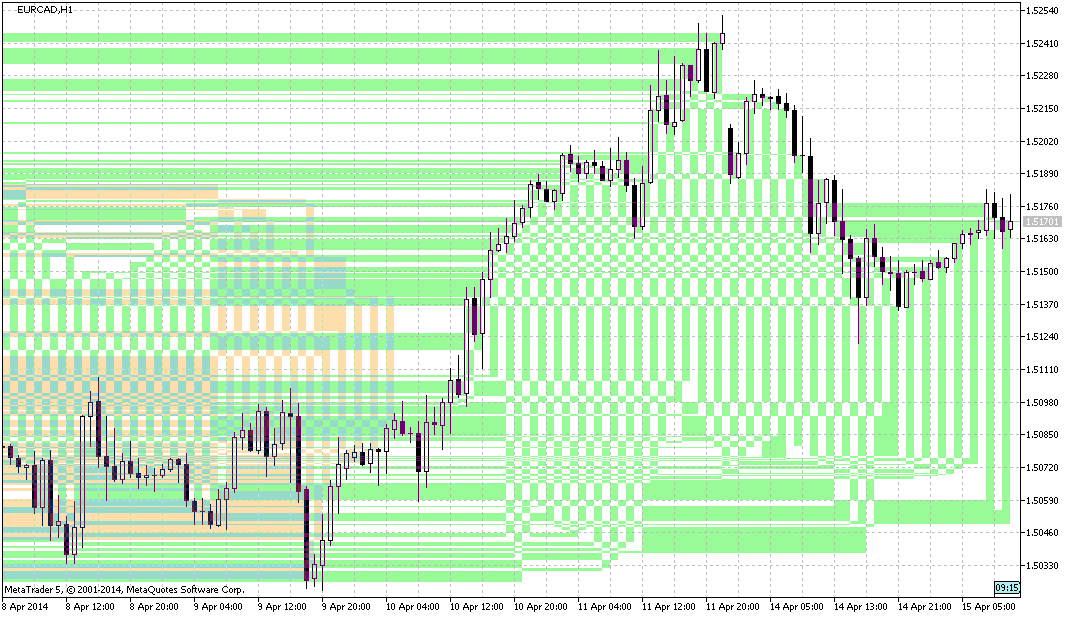
Trajecta ForceMap - Market Beta Testing
Jeremy Scott
Jeremy Scott 2014.04.15
It is interesting to look at! How do you use it?
Rogerio Figurelli
Rogerio Figurelli 2014.04.15
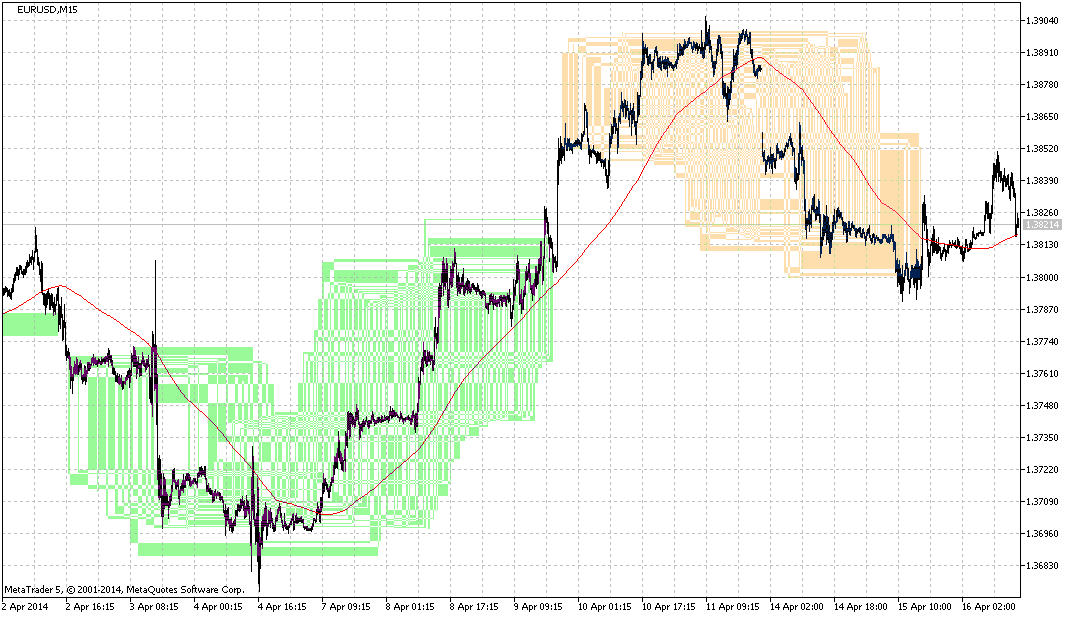
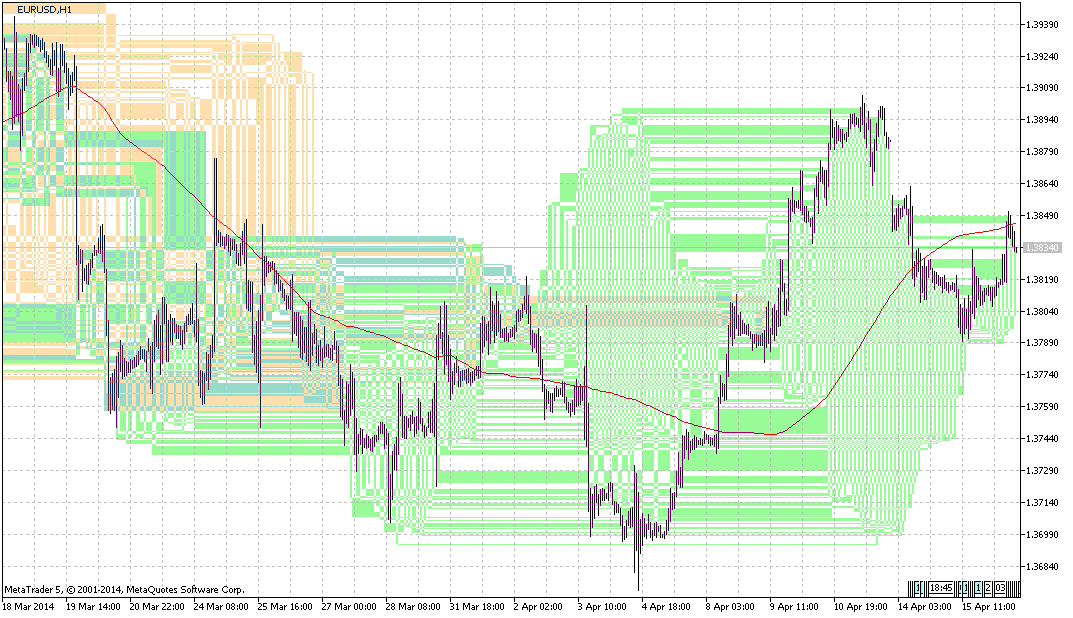
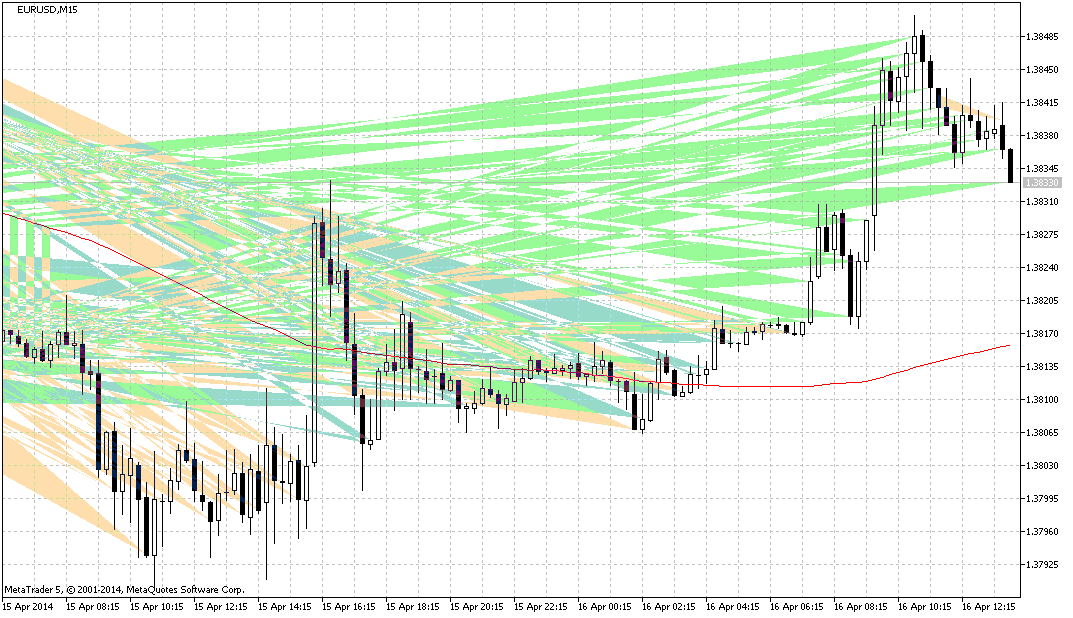
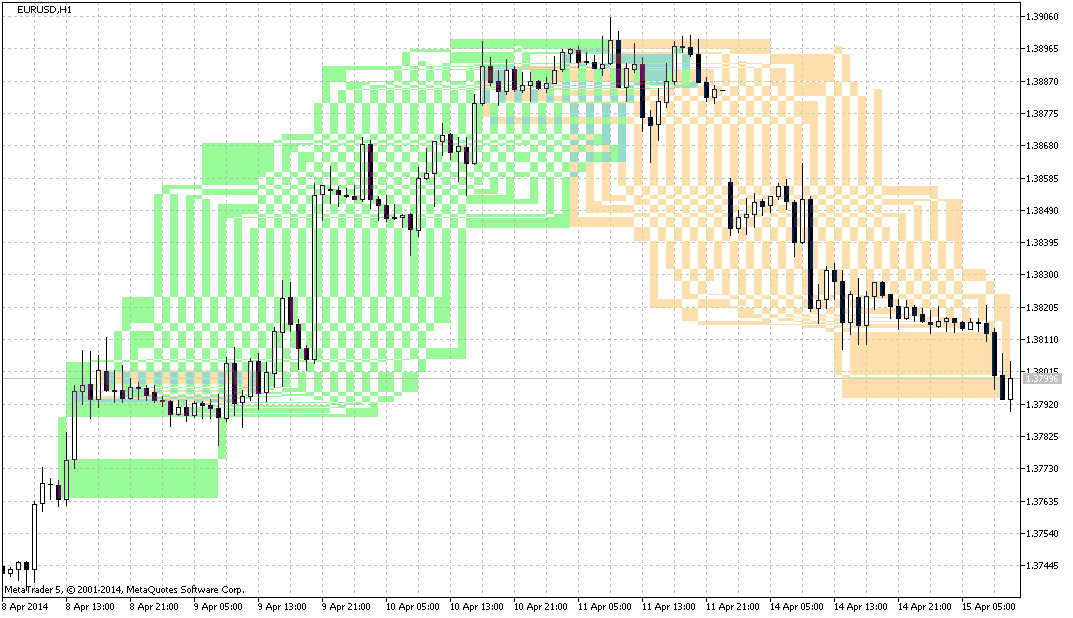
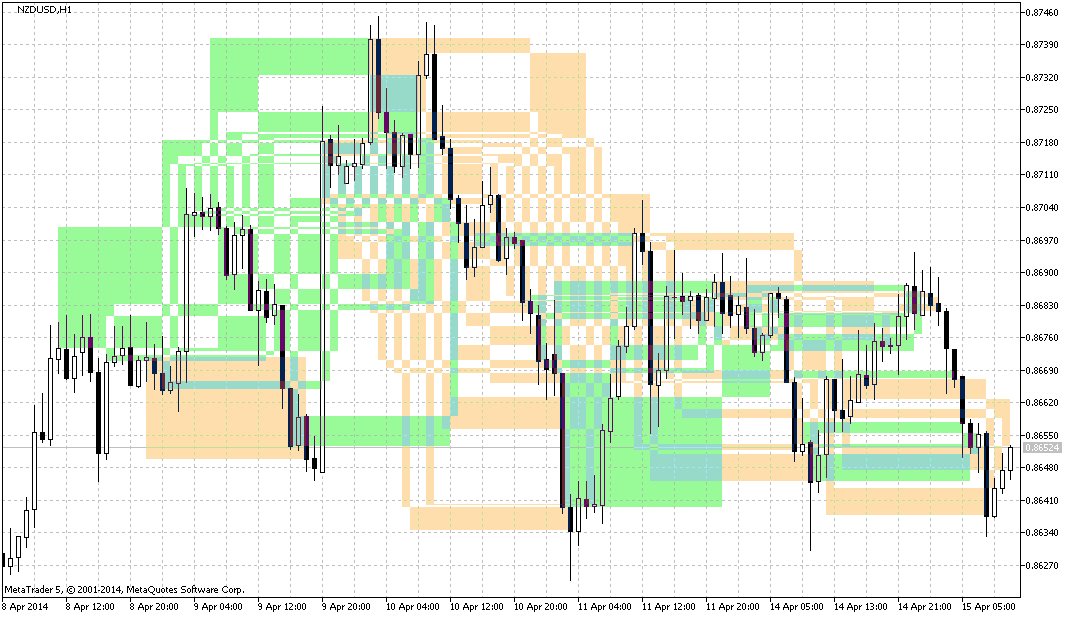
Thanks Jeremy, the main idea is quite simple, create maps based on forces and use brain intuition do the rest. Anyway, the algorithm logic is map colors for bulls and bears scenarios in graph area, instead of traditional indicators based on lines and/or histograms.
Rogerio Figurelli
Rogerio Figurelli
Trajecta ForceMap - Market Beta Testing
Rogerio Figurelli
Rogerio Figurelli
Looking for innovation? These are the first public Trajecta ForceMap screenshots. I created this new kind of indicator to bring new research ideas to this field. Hope you like. Any suggestion are welcome, the idea is bring a new series of indicators showing what no other indicator shows or trader see in their platform.