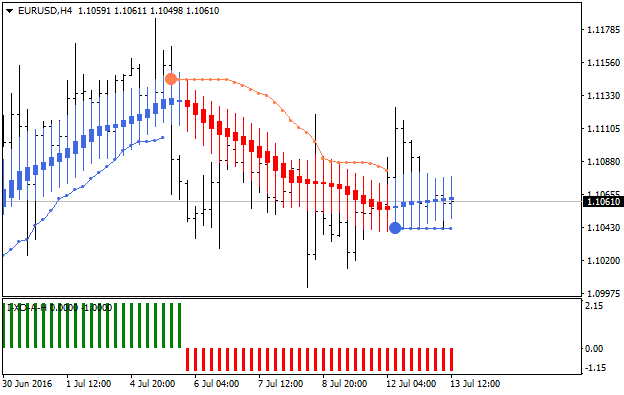
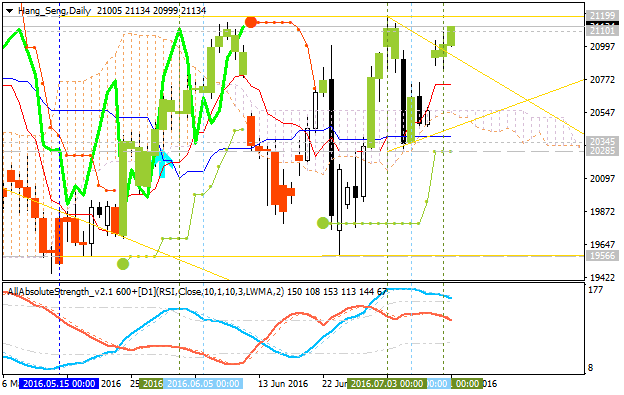
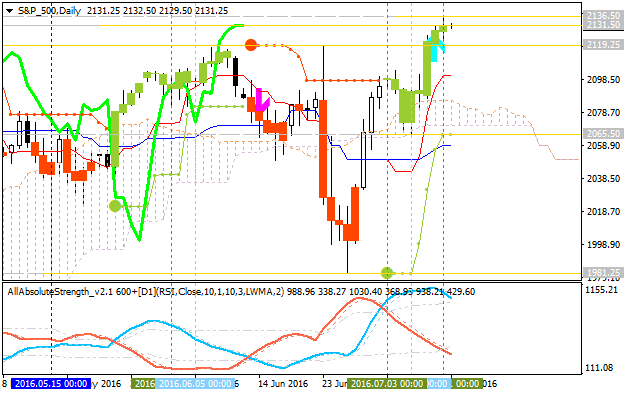
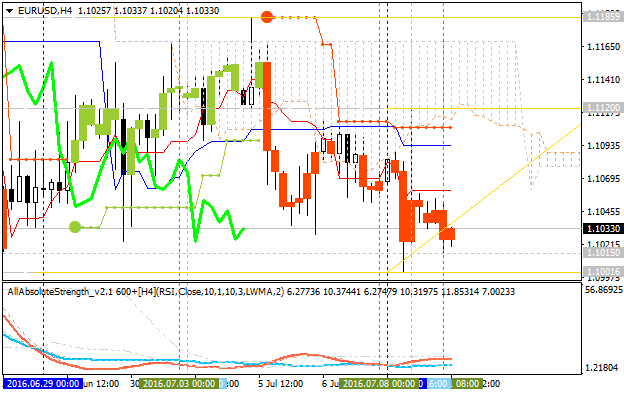
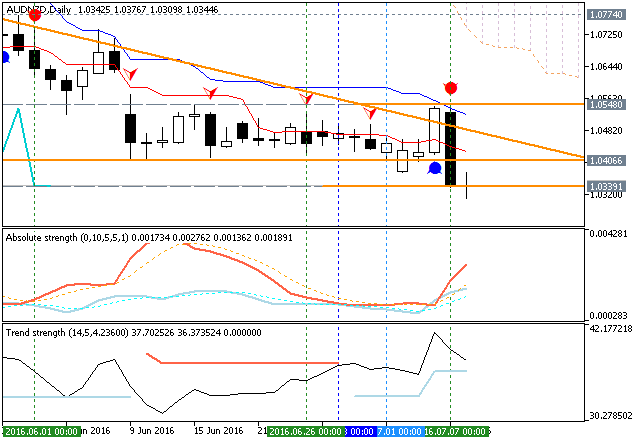
How To Trade - Heiken Ashi indicator and How Does It Work (adapted from the article ) Heikin-Ashi chart looks like the candlestick chart, but the method of calculation and plotting of the candles on
USD/CNH Intra-Day Fundamentals: China Trade Balance and 46 pips price movement 2016-07-13 07:00 GMT | [CNY - Trade Balance] past data is 325B, forecast data is 323B, actual data is 311B according to
AUD/USD Intra-Day Fundamentals: Westpac-Melbourne Institute Consumer Sentiment and 17 pips price movement 2016-07-13 00:30 GMT | [AUD - Westpac Consumer Sentiment] past data is -1.0%, forecast data is
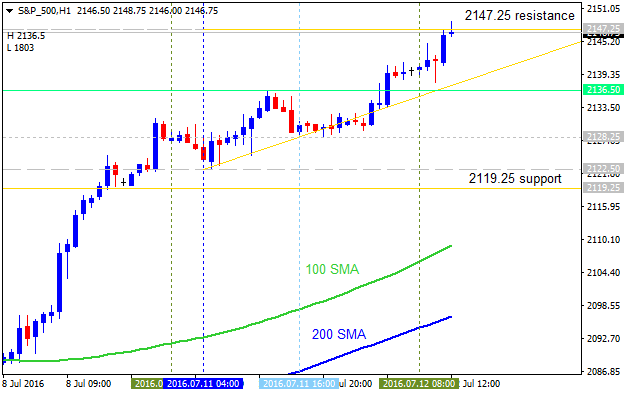
S&P 500 Short-Term Technical Analysis: watch for key support to be broken for possible sell trade ( adapted from the article ) The one hour price is located above 100 period SMA (100 SMA) and 200
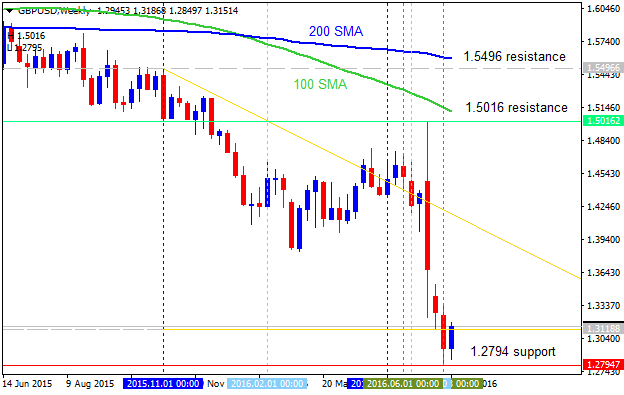
How low can sterling go? (review of the article ) There are some forecastings made by some int'l financial institutions related to the GBP/USD pair movement in the long-term situation: Goldman Sachs
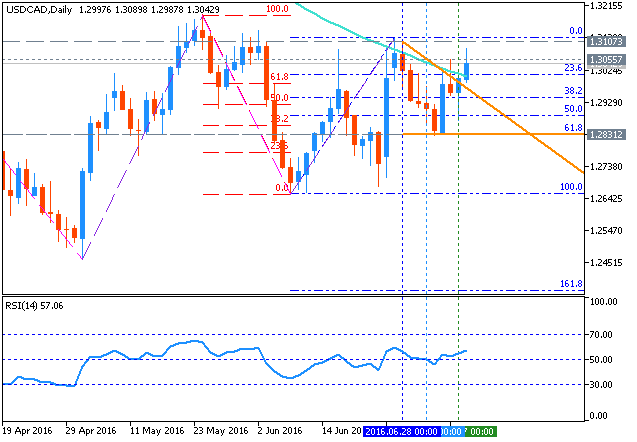
Sergey Golubev : Daily price is located below 200 SMA in the bearish area of the chart: the price is on ranging within Fibo resistance level at 1.3120 and 61.8% Fibo support level at 1.2831. If the
GBP/USD Intra-Day Fundamentals: BoE Financial Stability Report speech and 40 pips price movement 2016-07-12 09:00 GMT | [GBP - BoE Gov Carney Speaks ] past data is n/a , forecast data is n/a , actual
Forum on trading, automated trading systems and testing trading strategies Press review Sergey Golubev , 2016.07.12 08:41 Foreign Exchange post-Brexit Vote - China's Economy: Between a Rock and a
Forum on trading, automated trading systems and testing trading strategies Press review Sergey Golubev , 2016.07.12 08:14 S&P 500 Sets New Record (adapted from the article ) Analysts at Goldman Sachs
AUD/USD Intra-Day Fundamentals: National Australia Bank Business Confidence and 44 pips price movement 2016-07-12 01:30 GMT | [AUD - NAB Business Confidence] past data is 3 , forecast data is n/a
Technical Targets for EUR/USD by United Overseas Bank (based on the article ) H4 price is located below Ichimoku in the primary bearish area of the chart: price is on ranging within the following
Tom DeMark’s TD Sequential : TD Sequential - indicator for MetaTrader 4 TD Sequential - indicator for MetaTrader 4 ----- The New Science of Technical Analysis by Thomas R. Demark From the Foreword by
Fundamental Weekly Forecasts for Dollar Index, GBP/USD, USD/JPY, AUD/USD, USD/CAD, USD/CNH and GOLD (based on the article ) Dollar Index - " If there is any imbalance in one of these major regions of
Daily price is located below 200 SMA in the bearish area of the chart: the price is on ranging within Fibo resistance level at 1.3120 and 61.8% Fibo support level at 1.2831. If the price will break 1.3120 resistance level so the local uptrend as the
Credit Agricole with Week Ahead: Relative Value Trades With Degrees of Separation From The Brexit Trade (adapted from the article ) Credit Agricole was analysiing the Brexit situation onto the forex
Daily price is located below Ichimoku cloud on the bearish market condition with the ranging within the narrow key support/resistance levels: 1.1186 resistance located below Ichimoku cloud on the border between the ranging bearish and the secondary
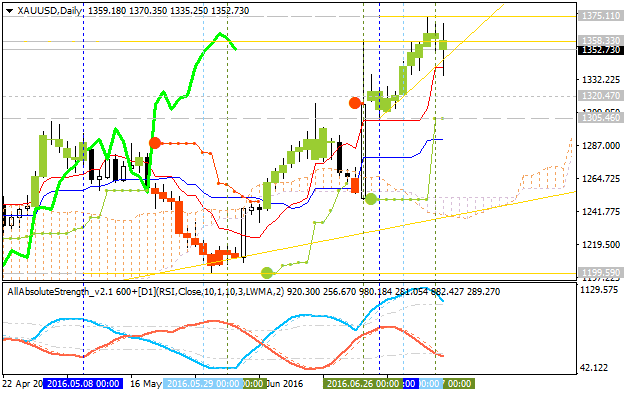
GOLD: End Of Week Technicals - correction to be started This trading week ended with some interesting results for this pair (XAU/USD). So, let's describe some of the moments related to it
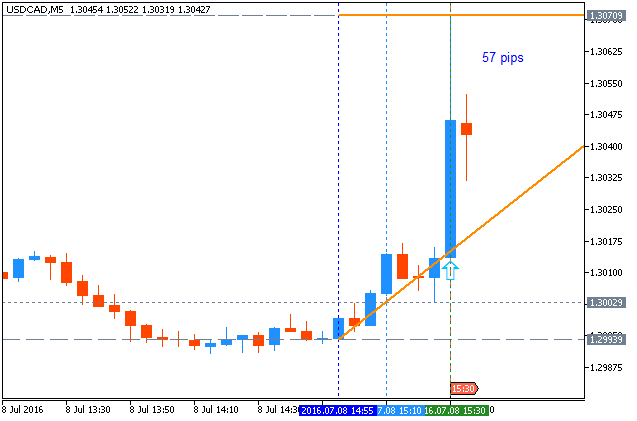
USD/CAD Intra-Day Fundamentals: Canada's Employment Change and 57 pips price movement 2016-07-08 12:30 GMT | [CAD - Employment Change] past data is 13.8K, forecast data is 6.5K, actual data is -0.7K