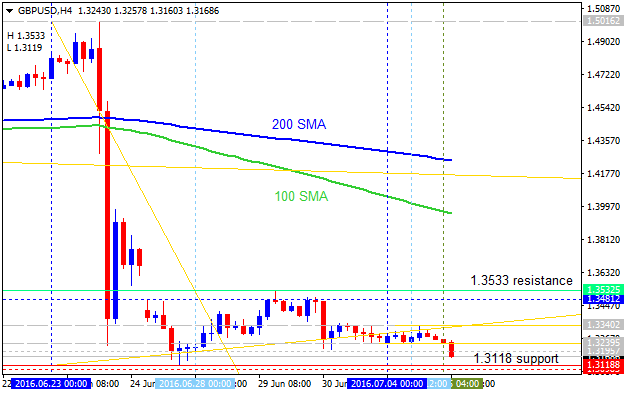
Technical Targets for GBP/USD by United Overseas Bank (based on the article ) H4 price is located below 200 period SMA (200 SMA) for the bearish area of the chart for the ranging within narrow
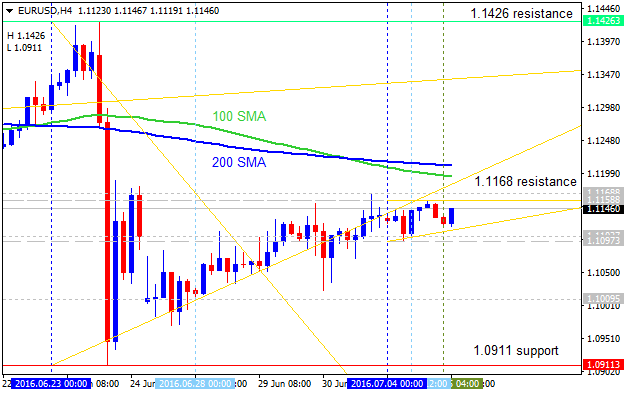
Technical Targets for EUR/USD by United Overseas Bank (based on the article ) H4 price is located near and below 200 period SMA (200 SMA) for the bearish ranging near bullish reversal. The price is on
USD/CNH Intra-Day Fundamentals: Caixin Services PMI and 35 pips price movement 2016-07-05 01:45 GMT | [CNY - Caixin Services PMI] past data is 51.2, forecast data is 52.3, actual data is 52.7
AUD/USD Intra-Day Fundamentals: RBA Cash Rate and 41 pips price movement 2016-07-05 04:30 GMT | [AUD - Cash Rate] past data is 1.75%, forecast data is 1.75%, actual data is 1.75% according to the
Daily price is on breakdown for the Ichimoku cloud to be crossed to below on open daily bar for the reversal of the price movement to the primary bearish market condition: the price is breaking 1.2864 support level for now for the bearish breakdown
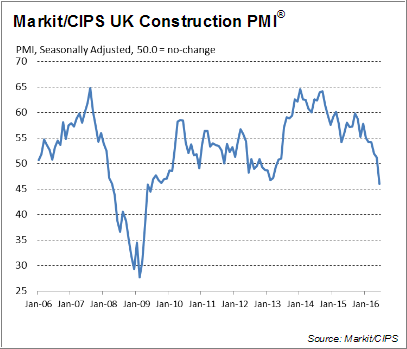
GBP/USD Intra-Day Fundamentals: U.K. Construction PMI and 44 pips range price movement 2016-07-04 08:30 GMT | [GBP - Construction PMI] past data is 51.2, forecast data is 50.7, actual data is 46.0
USD/CNH Price Action Analysis - ranging within 6.70 'bullish continuation' resistance and 6.50 'bearish reversal' support (adapted from the article ) Daily price is located above 200 period SMA and
EUR/USD Intra-Day Fundamentals: Spanish Unemployment Change and 16 pips range price movement 2016-07-04 07:00 GMT | [EUR - Spanish Unemployment Change] past data is -119.8K, forecast data is -74.3K
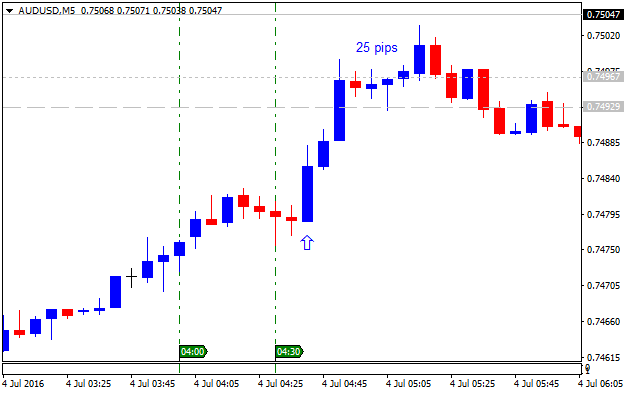
AUD/USD Intra-Day Fundamentals: Australian Building Approvals and 25 pips price movement 2016-07-04 01:30 GMT | [AUD - Building Approvals] past data is 3.3%, forecast data is -3.5%, actual data is
Daily price is on breaking Senkou Span line which is the virtual border between the primary bearish and the primary bullish trend on the chart: the price is breaking this line at 0.7486 for the reversal of the price movement from the ranging bearish
Daily price was started to be ranging after Brexit breakdown located below Ichimoku cloud in the primary bearish area of the chart, and within the following key support/resistance levels: 1.1427 resistance located above Ichimoku cloud in the primary
Quick Technical Overview: Technical Targets for GOLD (XAU/USD) - breaking 1,360 area for the bullish trend to be continuing H4 price is located to be above 100 SMA/200 SMA reversal on the bullish area of the chart: the price is breaking 1341.42
Quick Technical Overview: Technical Targets for Dollar Index - daily ranging for direction H4 price is on bullish ranging within 96.42 resistance and 95.44 support levels. If the price breaks 96.42 resistance level to above so the bullish trend will
Quick Technical Overview: Technical Targets for USD/JPY - ranging bearish to be continuing or the secondary rally to be started H4 price is located to be below 100 SMA/200 SMA on the primary bearish area of the chart. The price is on ranging within
Quick Technical Overview: Technical Targets for DAX Index - psy level at 10,000.0 to be tested for the bullish reversal H4 price is on slowly recovering mode after Brexit breakdown: the secondary bear market rally was started with 9.794.1 resistance
Sergey Golubev : Jupiter M - expert for MetaTrader 4 "This grid EA namely Jupiter M is building grids on both sides and may use martingale function which can be switched off by setting Multiplier
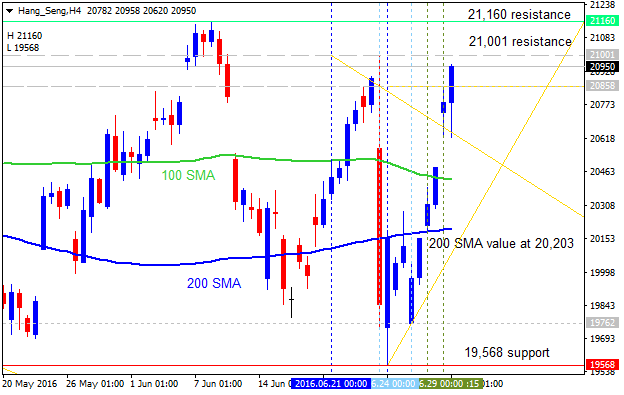
Quick Technical Overview: Technical Targets for Hang Seng Index - intra-day/daily breakout with bullish reversal H4 price broke 100 SMA/200 SMA reversal area once once again after Brexit brekdown on Friday: the price broke 200 SMA to above for the
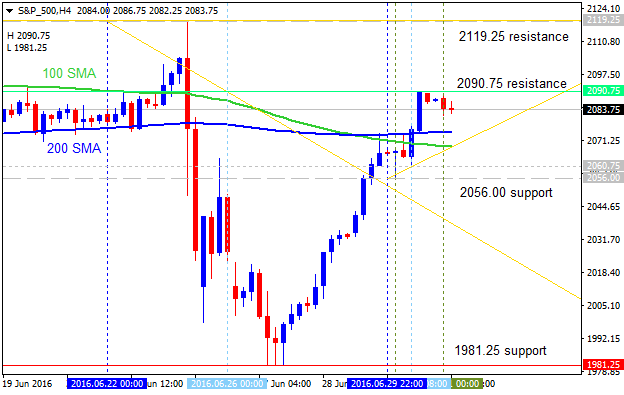
Quick Technical Overview: Technical Targets for S&P 500 - after Friday's brexit recoverying H4 price is recovering after Friday's 'brexit breakdown' - the price broke 100 SMA/200 SMA area to above to be reversed back to the primary bullish area
Technical Targets for GBP/USD H4 price is on bearish market condition located below 100 SMA/200 SMA reversal area. The price is on ranging within narrow s/r levels: 1.3495 resistance and 1.3120 support. If the price breaks 1.3120 level to below so