EUR/USD - daily price is on weekly resistance to be tested; 1.1268 level is the key (based on the article ) Daily price is on bullish ranging within 1.1268 weekly resistance level and 1.1095 support
일본 캔들스틱 차트의 구성과 캔들스틱 패턴 분석은 놀라운 기술적 분석 영역을 구성합니다. 캔들스틱의 장점은 데이터 내부의 역학을 추적 할 수 있는 방식으로 데이터를 표현한다는 것입니다. 이 글에서는 캔들스틱 유형, 캔들스틱 패턴 분류를 분석하고 캔들스틱 패턴을 결정할 수 있는 인디케이터를 제시합니다.
Trading Gold and Silver (based on the article ) "Trading gold and silver has become increasingly popular over recent years. More and more Forex brokers are offering trading in gold and silver, as well
EUR/USD Intra-Day Fundamentals: ECB President Draghi Speaks and range price movement 2017-05-18 18:00 GMT | [EUR - ECB President Draghi Speaks] past data is n/a, forecast data is n/a, actual data is
Hi, Here is today trade example i took based off HarmonicPatternFinderV2 indicator scan pattern on EURGBP H4 time frame, it detected a bearish Butterfly 113 pattern. Taregt was set based off fibo
FTSE 100 and the S&P 500 Turns Lower (based on the article ) "Yesterday, global stocks were shaken on political upheaval in Washington. The FTSE 100 managed to escape yesterday’s sessions relatively
AUD/USD Intra-Day Fundamentals: Australian Employment Change and range price movement 2017-05-18 02:30 GMT | [AUD - Employment Change] past data is 60.0K, forecast data is 4.5K, actual data is 37.4K
Dax Index - waiting for the bullish trend to be continuing or for the secondary correction to be started (based on the article ) Daily price is on bullish ranging within 12,839 resistance and 12,518
EUR/USD - bullish breakout (based on the article ) Daily price is on bullish breakout which was started in the end of the previous week: the price is testing 1.1097 resistance to above for the bullish
NZD/USD Intra-Day Fundamentals: New Zealand Producer Price Index and range price movement 2017-05-16 23:45 GMT | [NZD - PPI Input] past data is 1.0%, forecast data is 0.7%, actual data is 0.8%
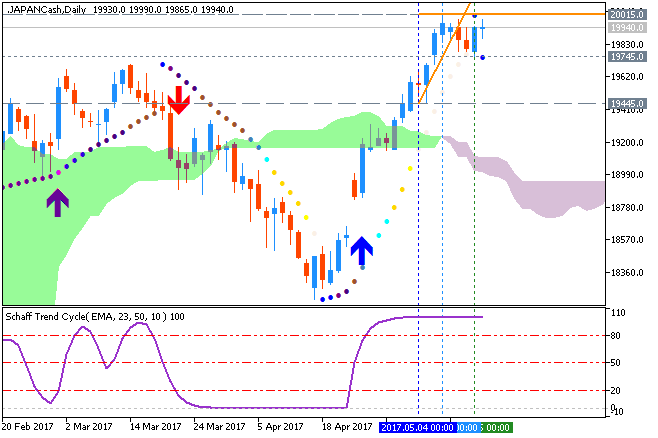
Nikkei 225 Index - daily bullish; 20,015 is the key level (based on the article ) Daily shares price is located above Ichimoku cloud in the bullish area of the chart. The price is testing 20,015