USD/CAD Intra-Day Fundamentals: CMHC Housing Starts and range price movement 2017-07-11 13:15 GMT | [CAD - Housing Starts] past data is 195K, forecast data is 200K, actual data is 213K according to
AUD/USD Intra-Day Fundamentals: NAB Business Confidence and range price movement 2017-07-11 02:30 GMT | [AUD - NAB Business Confidence] past data is 8, forecast data is n/a, actual data is 9
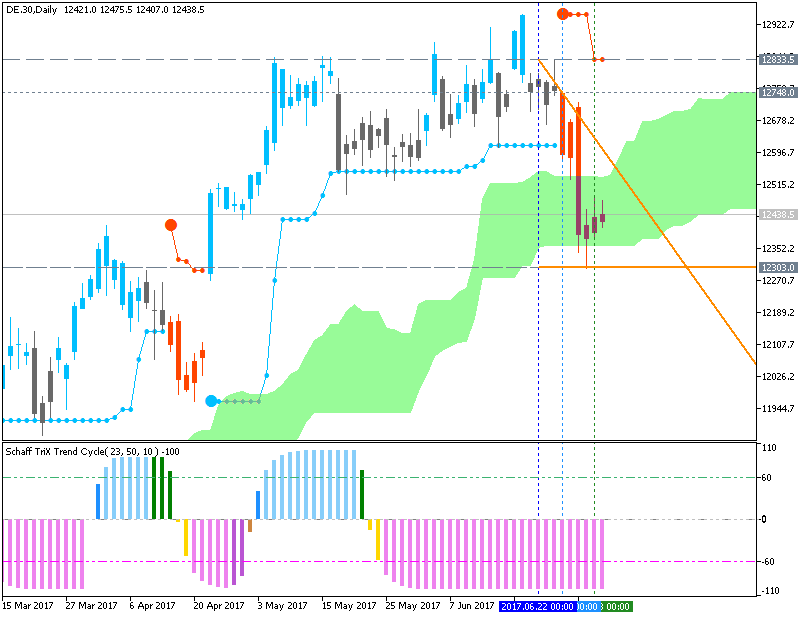
I would really like if you can explain to me how to use Schaff Trend Cycle. I'm not sure how to read it properly. Can you teach me how to read and make use of it?
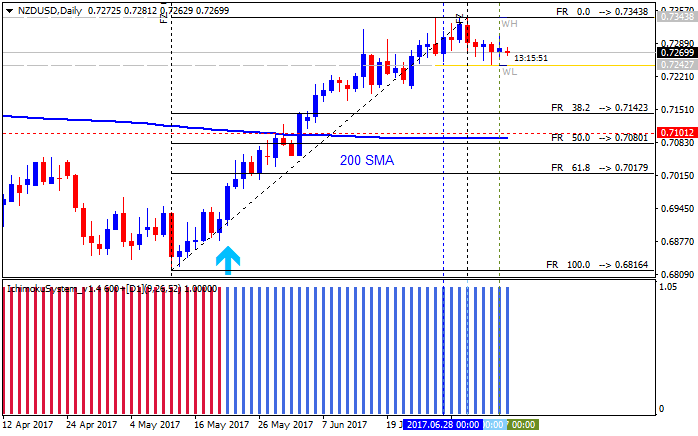
NZD/USD - bullish ranging within narrow s/r levels; 0.7343 and 0.7102 are the keys (based on the article ) Daily price broke 200 period SMA to above on the good breakout movement to be reversed to the
USD/JPY - daily bullish continuation with 114.36 target (based on the article ) Daily price broke Ichimoku clud to above for the reversal of the price movement from the primary bearish to the primary
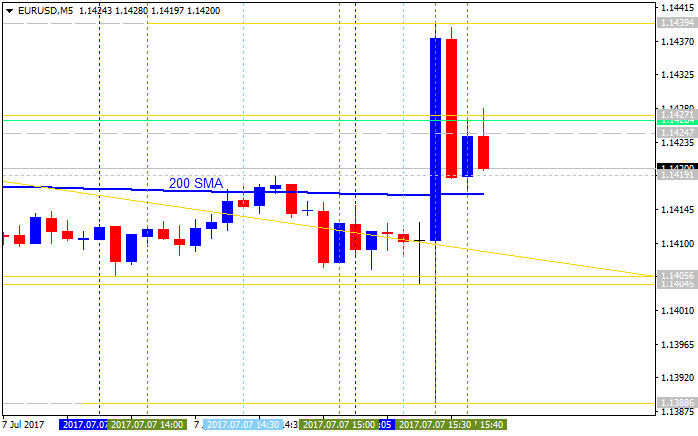
Intra-Day Fundamentals - EUR/USD, GBP/USD and Dollar Index: Non-Farm Payrolls 2017-07-07 13:30 GMT | [USD - Non-Farm Employment Change ] past data is 152K, forecast data is 175K, actual data is 222K
Phillip Futures, member of the PhillipCapital Group based in Singapore, is pleased to offer the MetaTrader 5 platform to their clients. This makes the futures and forex broker the first in Singapore to adopt the new-generation multi-asset trading
How To Trade News Events: Two Trading Mistakes Which Destroy Your Account One of the most common mistakes is sticking in a trade where you know your forex trading strategy is correct, but the market
Forum on trading, automated trading systems and testing trading strategies Market Condition Evaluation based on standard indicators in Metatrader 5 Sergey Golubev , 2013.07.11 16:03 And some comments
Vladimir Karputov : No. Not so. The main idea: to buy below and below and to sell above and above. There is a preliminary version Multi_arbitration version 1.000 Restriction of "ACCOUNT_LIMIT_ORDERS"
EUR/USD - intra-day ranging near bearish reversal (based on the article ) Price on H4 chart is located near and above Ichimoku cloud in the bullish area of the chart. The price is near the border
EUR/USD with short probability (based on the article ) Daily price is on above Ichimoku cloud for the bullish ranging within the following s/r levels: 1.1445 resistance level located in the beginning
Bitcoin and tesla Investors is in a bubble territory (based on the article ) Bitcoin/US Dollar - daily price is located above the Ichimoku cloud in the bullish area of the chart. The price is on
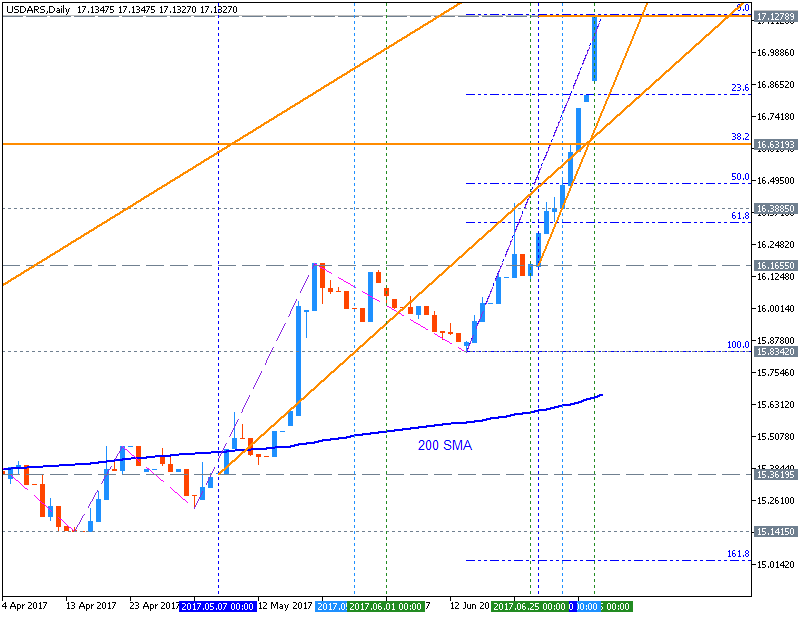
US Dollar (USD) to Argentine Peso (ARS): daily bullish breakout; 17.1278 is the key (based on the article ) USD/ARS daily price is on bullish breakout by ascendsing triangle pattern to be crossing to
AUD/USD Intra-Day Fundamentals: Australia's Trade Balance and range price movement 2017-07-06 02:30 GMT | [AUD - Trade Balance] past data is 0.09B, forecast data is 1.00B, actual data is 2.47B
S&P 500 - ranging bullish; 2,405 is the key for the possible bearish reversal (based on the article ) The price on S&P 500 daily chart is on bullish ranging above Ichimoku cloud: price is on ranging
Dax Index - correction to the bearish reversal; 2.303 support is the key (based on the article ) Daily price is on secondary correction within the primary bullish market condition. The price is
GOLD - intra-day bearish reversal with breakdown; 1.1219 level is the key (based on the article ) H4 price was bounced from 1,254 resistance level which is Senkou Span line and virtual border between
And this is Brainwashign setup for same pair (AUD/USD) but for H4 timeframe. We may see +168 pips in profit in case of trading by stop loss/trailing stop line
AUD/USD Intra-Day Fundamentals: RBA Cash Rate and range price movement 2017-07-04 05:30 GMT | [AUD - Cash Rate] past data is 1.50%, forecast data is 1.50%, actual data is 1.50% according to the latest