Chang Suk Chung
Chang Suk Chung
  • 정보
9+ 년도
경험
1
제품
658
데몬 버전
0
작업
0
거래 신호
0
구독자
Copyright 2009-2017, Chang Suk Chung
Chang Suk Chung
Below is USDJPY H1 chart. Please concern about circle. Chikou span is a historical price on 26 days ago of a current close price. It is crossing over historical candle. There was a buying point at that time...
Chang Suk Chung
Chang Suk Chung
Below is usdjpy H1 chart. Ichimoku kinko hyo, heiken ashi and fibonacci retracement are showed in chart. Chikou span is touching historical candle. And now candle is moving over senkou span A. Next resistance level is located at fibonacci 38.2% retracement...
3
Chang Suk Chung
Below is usdjpy H1 chart. Ichimoku kinko hyo, heiken ashi and fibonacci retracement are showed in chart. Chikou span is touching historical candle. And now candle is moving over senkou span A. Next resistance level is located at fibonacci 38.2% retracement...
공유된 작성자의 Dmitry Voronkov 기고글
Haiken-Ashi(평균족) 인디케이터에 기반한 매매 시스템 예시

이 문서에서 우리는 매매에서 Haiken-Ashi 인디케이터를 쓰는 법에 대해 알아보겠습니다 . 이 인디케이터를 기반으로 간단한 매매 시스템을 고안해보고 MQL5 Expert Advisor를 하나 짜보겠습니다. 매매 작업은 표준 클래스 라이브러리의 클래스들을 기반으로 구현되었습니다. 검토된 매매 전략의 과거 기력을 기반으로한 시험 결과는 내장 MetaTrader 5 전략 테스터를 이용하여 이루어졌으며, 이 문서 내에서 확인하실 수 있습니다.
Chang Suk Chung
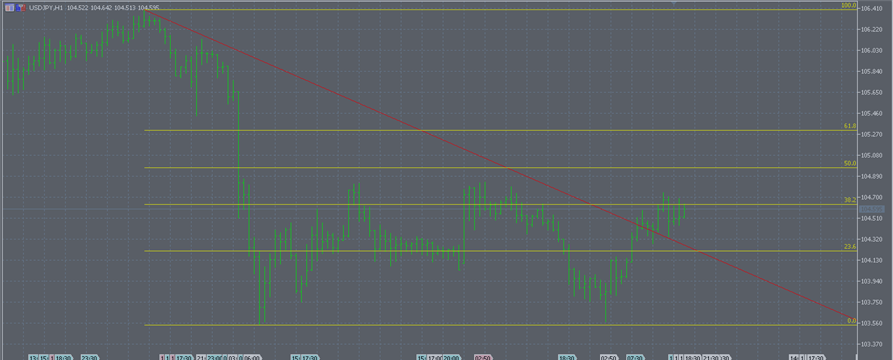
This stage of USDJPY is Fibonacci 38.2% retracement. Next target point is 104.839...
Chang Suk Chung
게시된 스크린샷
USDJPY, H1MetaQuotes Software Corp.
Chang Suk Chung

USDJPY H1 Chart

17 6월 2016, 12:26
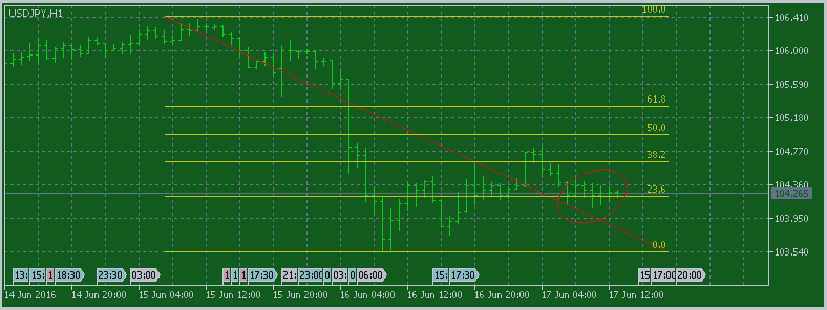
This stage is Fibonacci 23.6% retracement...
Chang Suk Chung
I think down trend of USDJPY is ending. Below is ichimoku kinko hyo chart. Lowest value of Chikou span is being high. I think now is buying point. What is your opinion...
Chang Suk Chung
Chang Suk Chung
1
공유된 작성자의 Samuel Olowoyo 기고글
This is the most excellent article.
You can't miss it.
초보자를 위한 MQL5 Expert Advisor 코드 작성 가이드

MQL5의 Expert Advisors 프로그래밍은 간단하며 쉽게 배울 수 있습니다. 이 단계별 가이드를 통해 개발된 거래 전략에 따라 간단한 Expert Advisor를 작성할 때 필요한 기본 단계를 확인할 수 있습니다. Expert Advisor의 구조, 내장 기술 인디케이터 및 거래 기능의 사용, 디버그 모드의 세부 사항 및 Strategy Tester의 사용 등이 소개되어 있습니다.

Chang Suk Chung
Parabolic SAR is magnificent to make profit. You can find trend apparently at Parabolic SAR. But in side walking phases it shows misleading signals...
공유된 작성자의 Dmitriy Zabudskiy 기고글
Indicator for P&F Chart for MetaTrader 5.
It is creative and innovationall.
포인트 앤 피겨 차트 지표
포인트 앤 피겨 차트 지표

현재 시장 상황에 대한 정보를 제공하는 차트 유형이 많이 있습니다. Point and Figure 차트와 같은 많은 것들은 먼 과거의 유산입니다. 이 글에서는 실시간 지표를 사용한 점 및 그림 차트의 예를 설명합니다.

공유된 작성자의 Dmitriy Zabudskiy 기고글
This is a very excellent article about Three Line Break Chart.
You can gain a good inspiration.
세줄 브레이크 차트(Three Line Break Chart)를 구성하기 위한 지시자

이 기사는 스티브 니슨이 그의 책 "캔들스틱 그 너머"에서 제안한 3행 브레이크 차트(Three Line Break Chart)에 관한 것입니다. 이 차트의 가장 큰 장점은 이전 이동과 관련하여 가격의 사소한 변동을 필터링할 수 있다는 것입니다. 우리는 차트 구성의 원칙, 지표의 코드, 그리고 그것을 기반으로 한 거래 전략의 몇 가지 예를 논의할 것입니다.

Chang Suk Chung
게재된 포스트 How to use Icimoku Kinco Hyo chart
Below is my opinion about using Ichimoku Kinco Hyo chart at EURUSD. This is the chart. Arrows is signals to hold positions at EURUSD. There are buying and selling signals at above chart. It is important to analize the chart...
Chang Suk Chung
게재된 포스트 Analysis of Ichimoku Kinco Hyo Charts at EURUSD
I am interesting at Ichimoku Kinko Hyo Chart. It shows and represents past, present and future market move. Below is the chart at EURUSD Today. After three-bottom type occurs, up-trend is progressing. And a few minutes ago candle sticks are moving upward very rapidly and sharply...
Chang Suk Chung
Chang Suk Chung
I like renko and ichimoku charts.
Chang Suk Chung
MQL5.커뮤니티에 등록됨