Pullback Hunter MT4
- 지표
- 버전: 1.1
- 업데이트됨: 26 6월 2023
- 활성화: 5

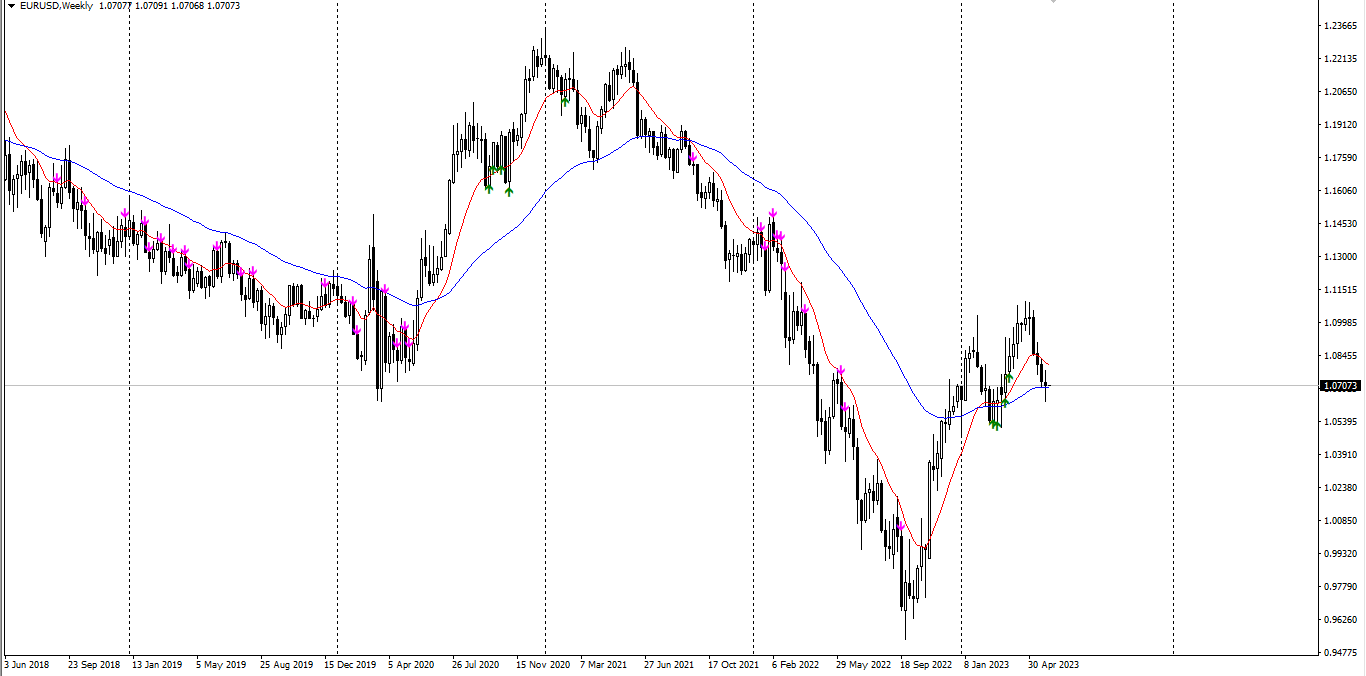
Indicator show best signals for buy and sell orders.
Indicator uses only 2 inputs:
PEMA Bounce Period - bounce percentage exponential moving average period
PEMA Confirm Period - confirm percentage exponential moving average period
Positions of price according to bounce and confirm percentage exponential moving averages and directions of bounce and confirm percentage exponential moving average shows buy and sell signals, which are drawn as green and magenta arrows respectively.