Gadiel Move MT5
- 지표
- 버전: 1.1
- 업데이트됨: 26 6월 2023
- 활성화: 5

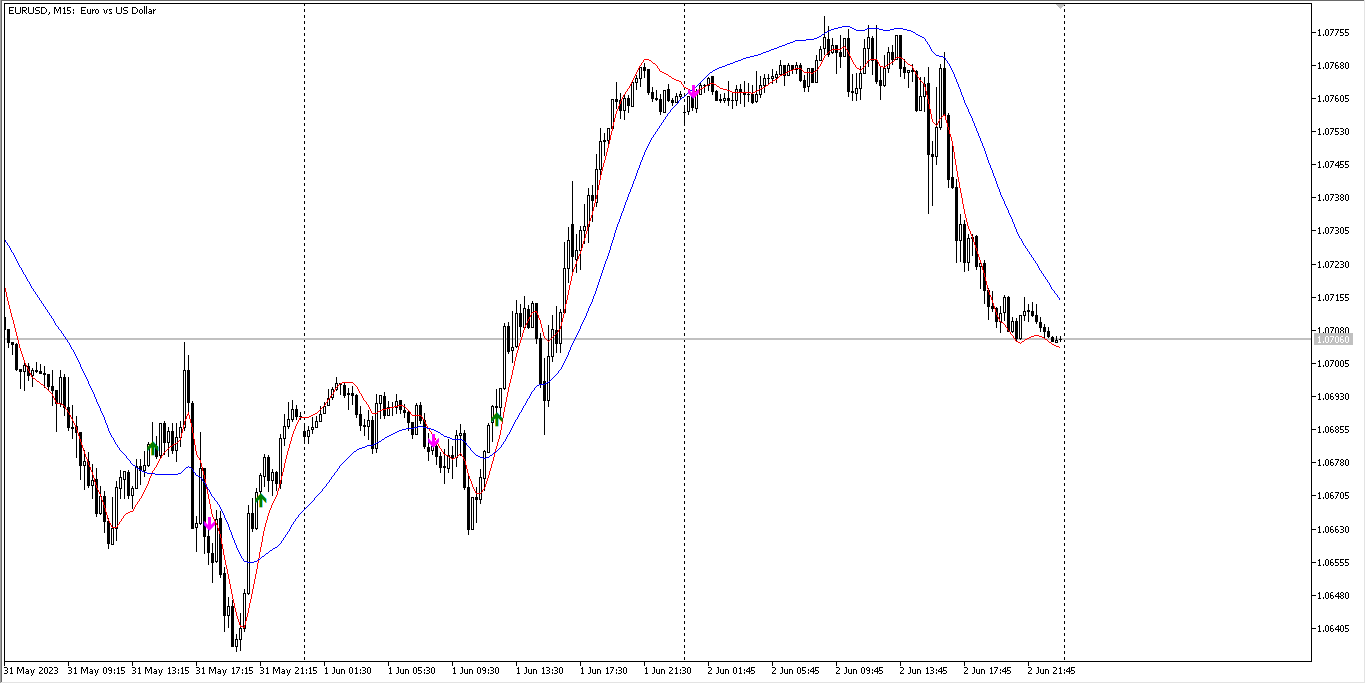
Indicator show best signals for buy and sell orders.
Indicator uses only 2 inputs:
DEMA Fast Period - fast double exponential moving average period
DEMA Slow Period - slow double exponential moving average period
Crossings of fast and slow double double exponential moving averages shows buy and sell signals, which are drawn as green and magenta arrows respectively.