• 미리보기
  • 리뷰 (32)
  • 코멘트 (50)
  • 새 소식

Trading box Technical analysis

5

Everything for chart Technical Analysis indicator mt4 in one tool

Draw your supply demand zone with rectangle and support resistance with trendline and get alerts to mobile phone or email alert - Risk reward indicator

Video tutorials and manuals hereFind contacts on my profile.


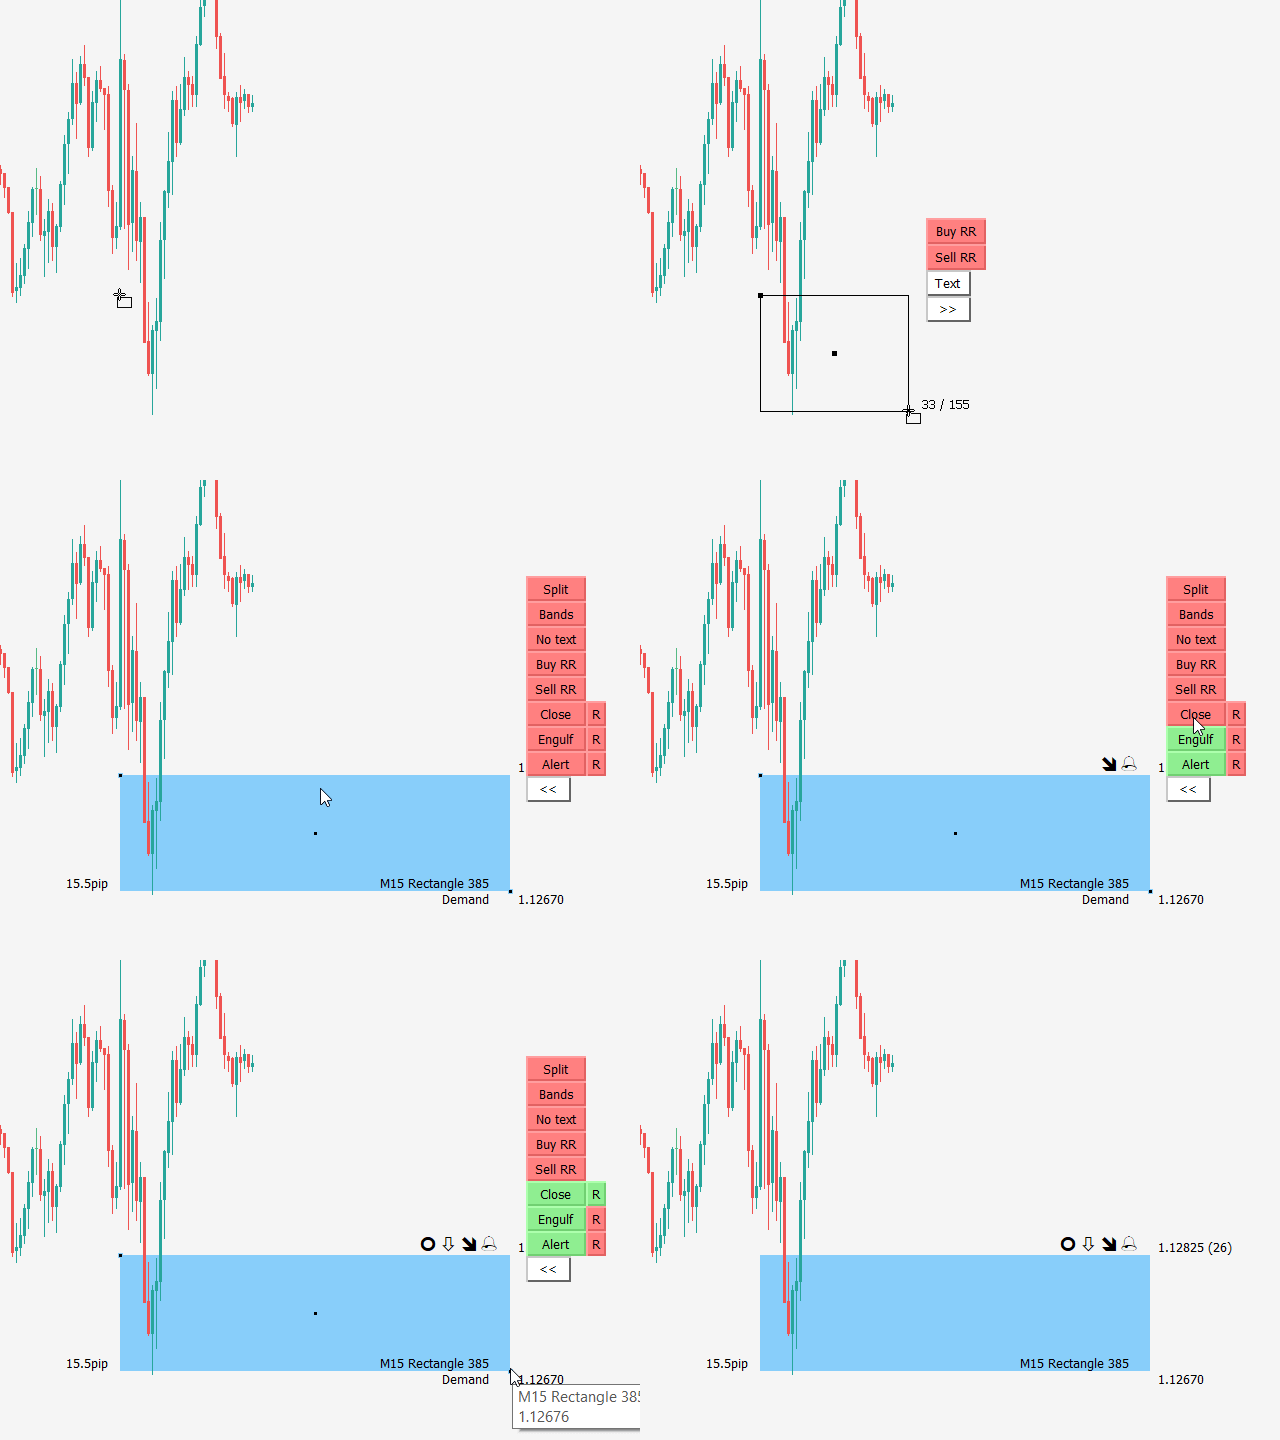
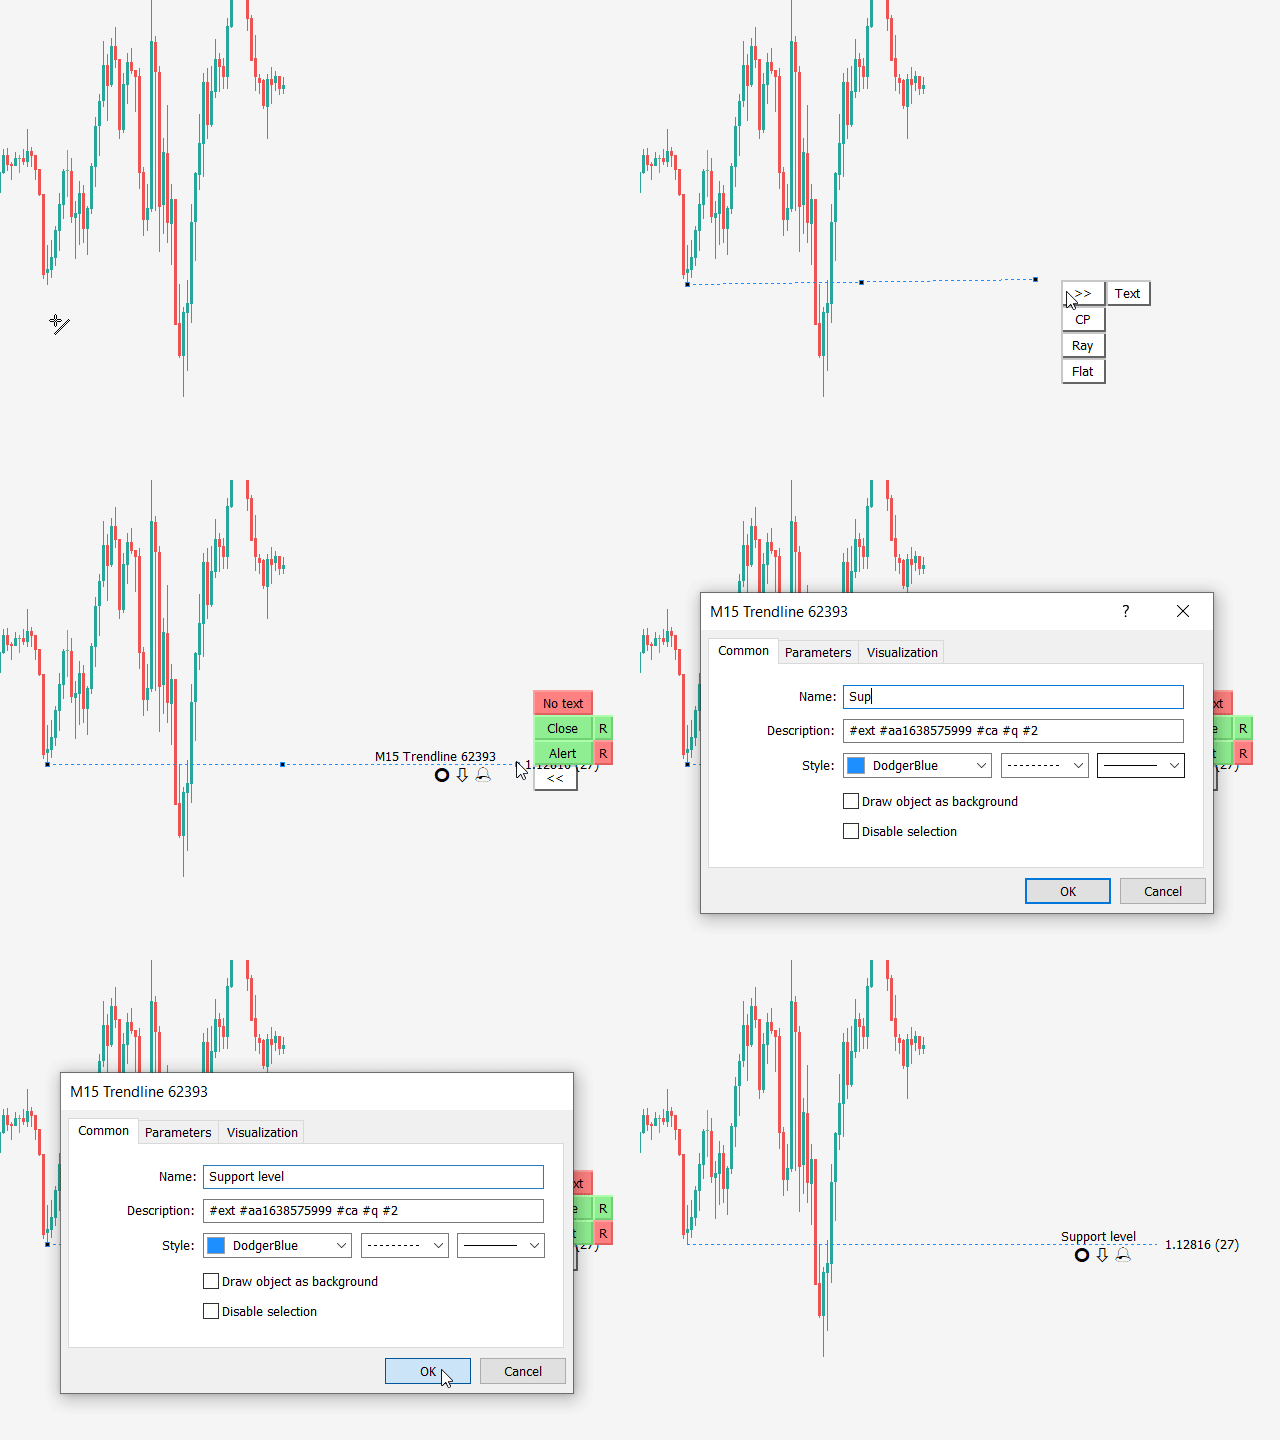
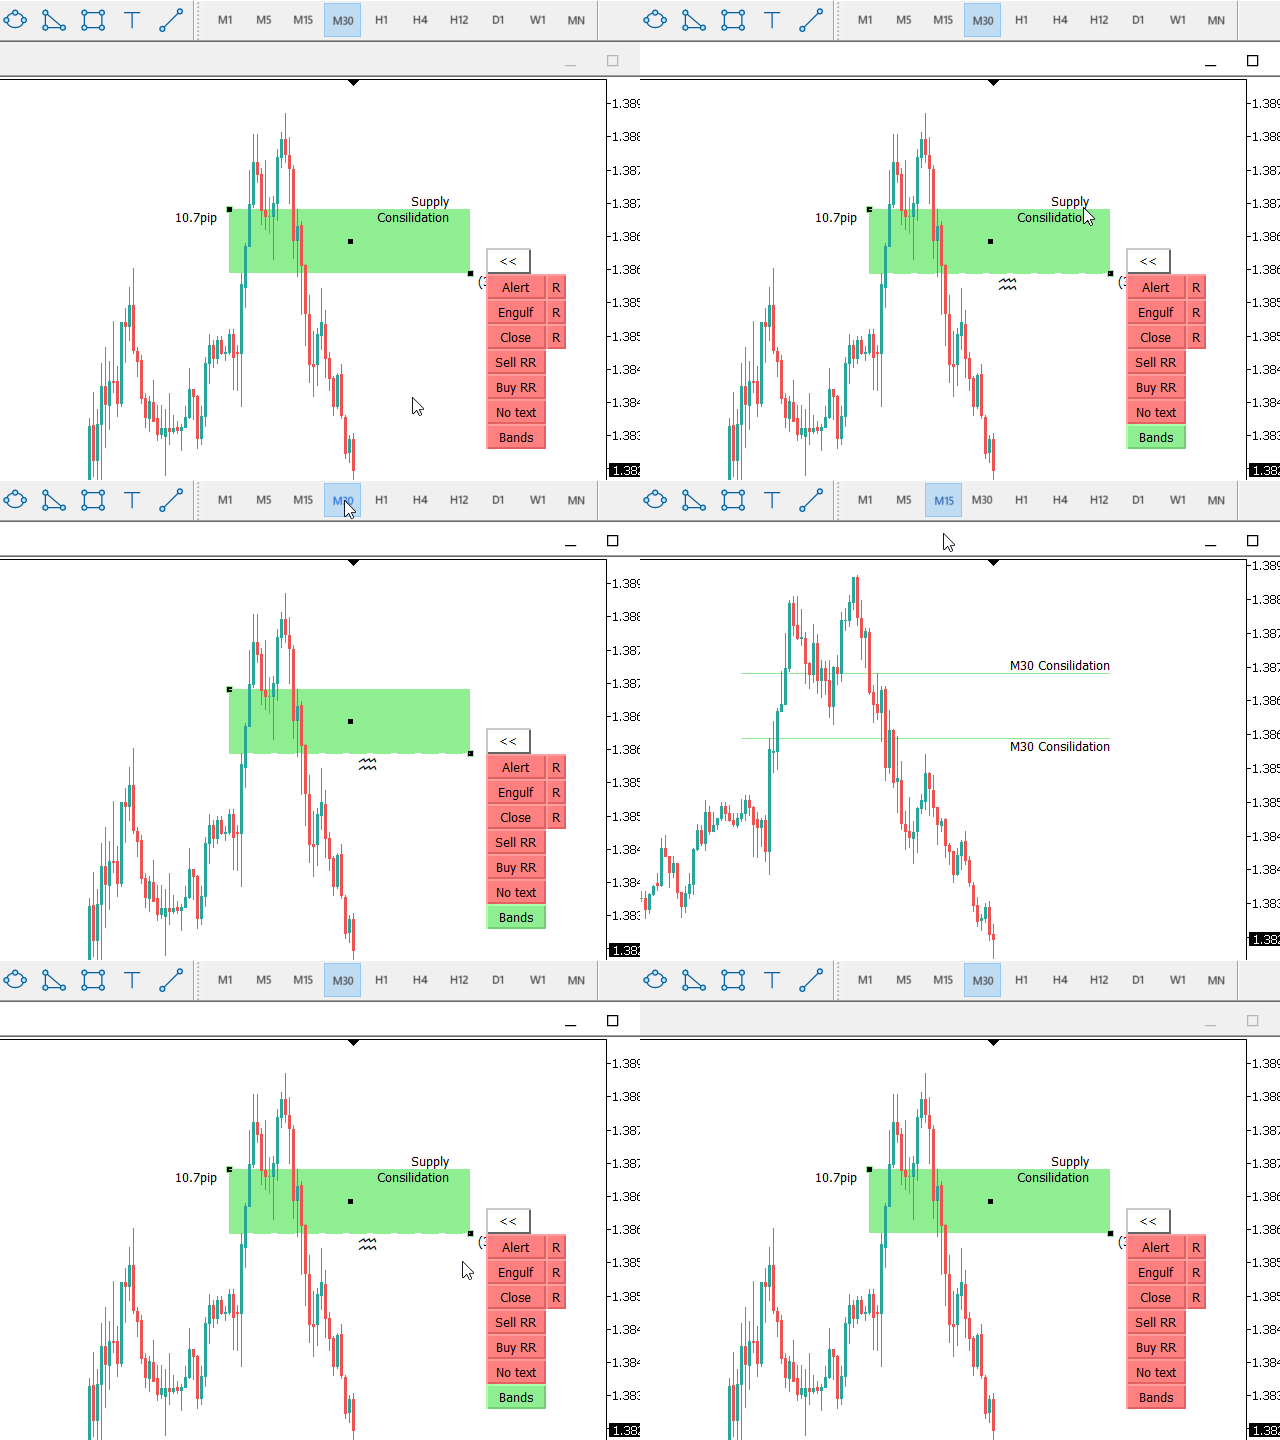
1. Extended rectangles and trendlines

Object will be extended to the right edge of the chart when price will draw new candles on chart. This is rectangle extender or trendline extender.

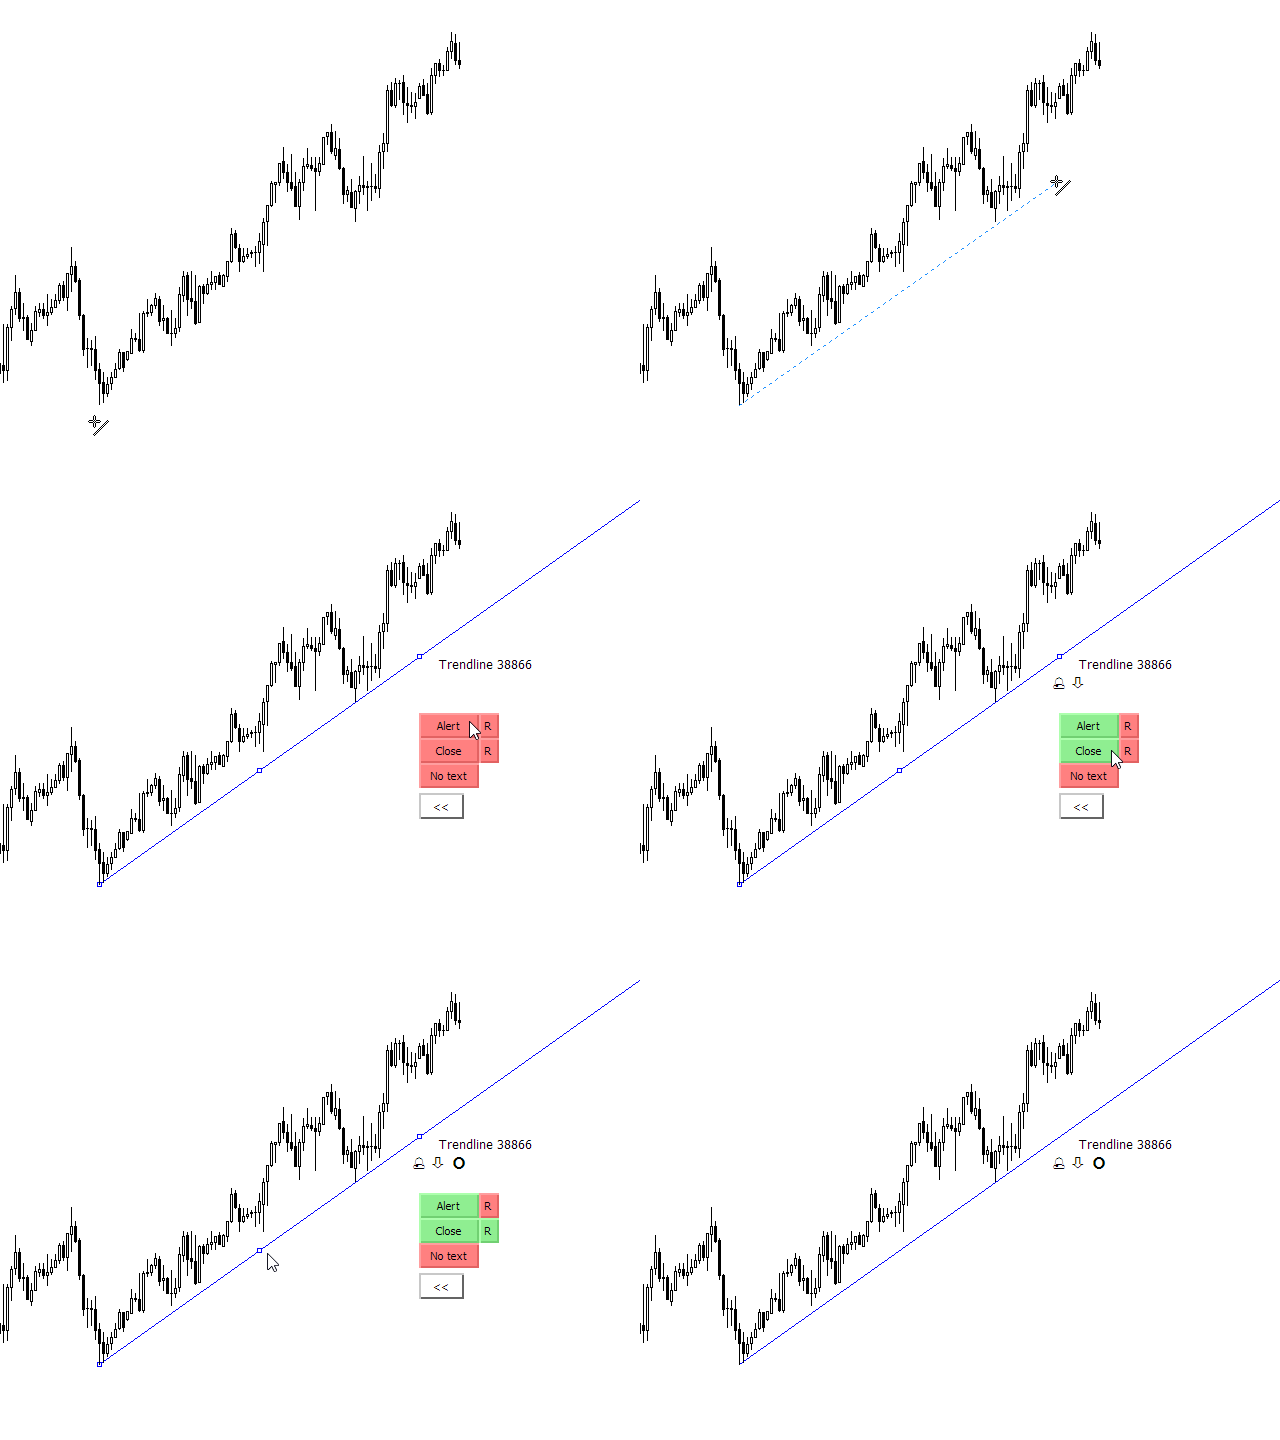
2. Price touch alert

  1. Alert will be triggered when price will touch extended rectangle or extended trendline
  2. Trendline alert is also available for rayed angled trendline
  3. Alerts can be sent to mobile push notification, email and MetaTrader popup alert

3. Engulf alert

Alert will be triggered when price will break rectangle supply demand zone

4. Candle Close alert
Alert will be triggered when candle will close outside of the rectangle or trendline
    5. Trendline Retest alert

    Button "Retest" is used for breakout and retest strategy. Breakout Retest triggers an alert if the candle closes beyond trendline and then price touches trendline for retest

    6. Sound repeat after Alert, Engulf, Close, Retest

    R button will enable you repeat alert sound every few seconds. Audible alert, text alert

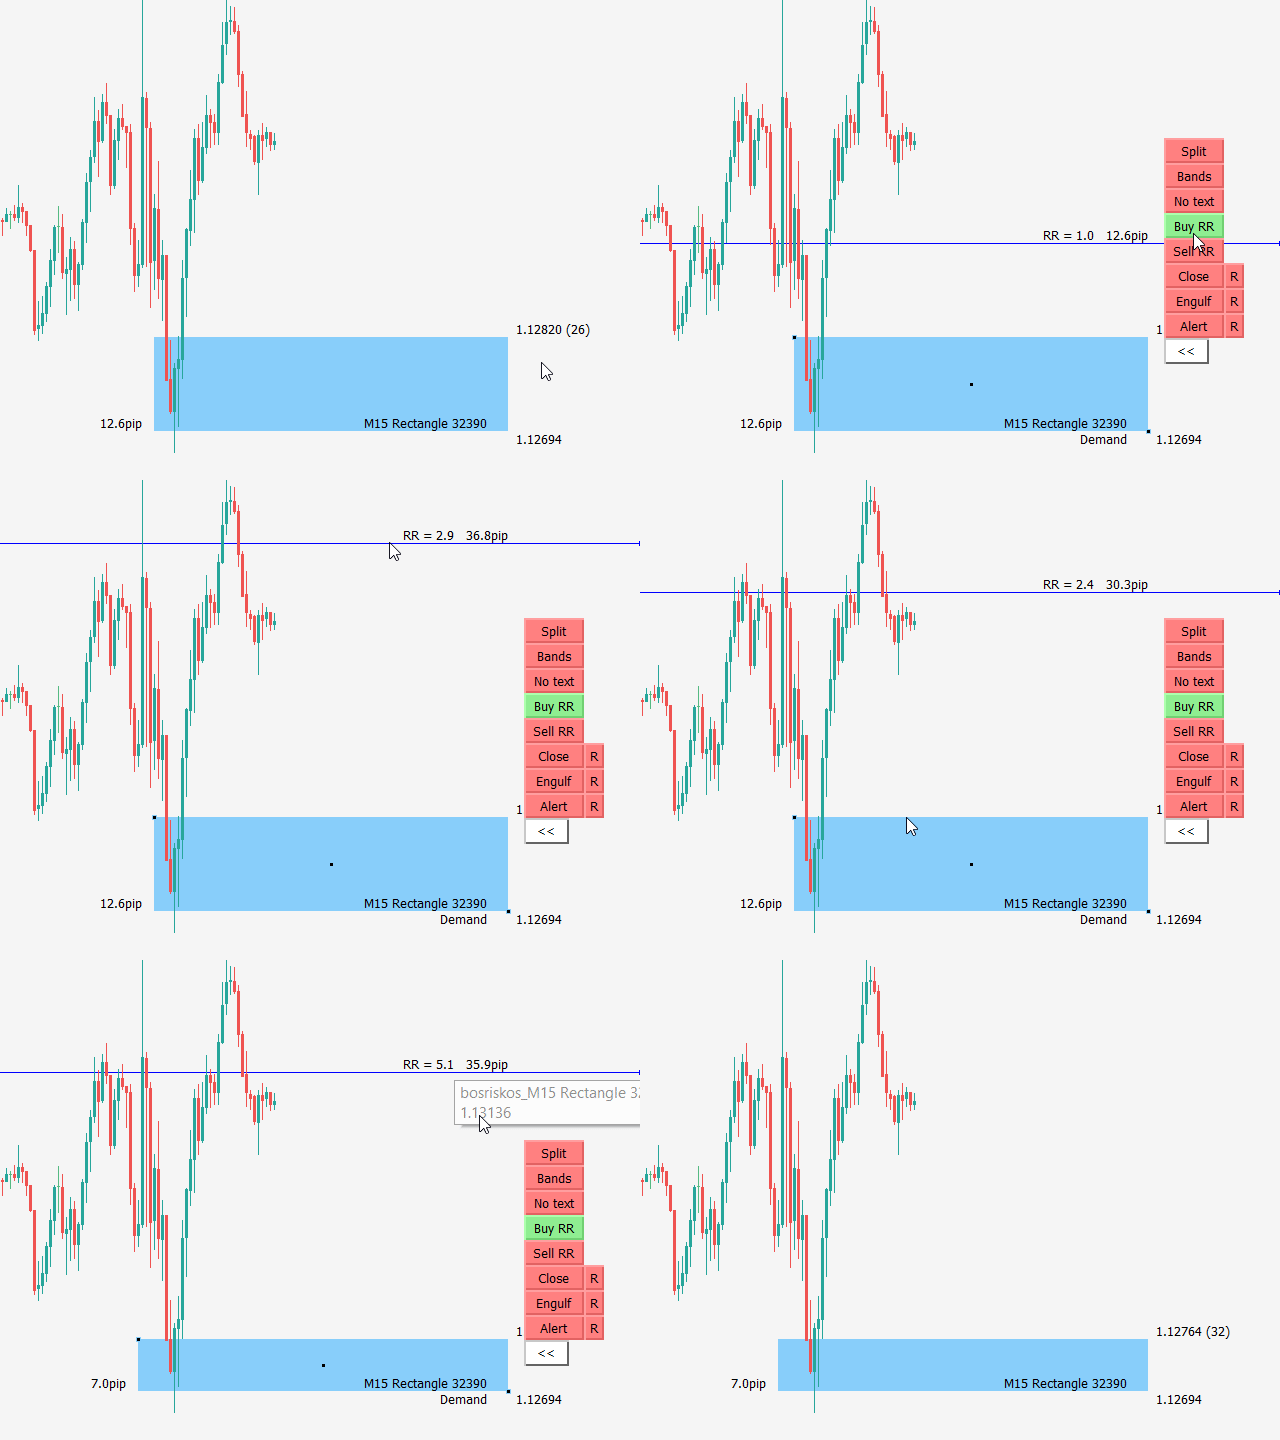
    7. Risk reward ratio calculation tool

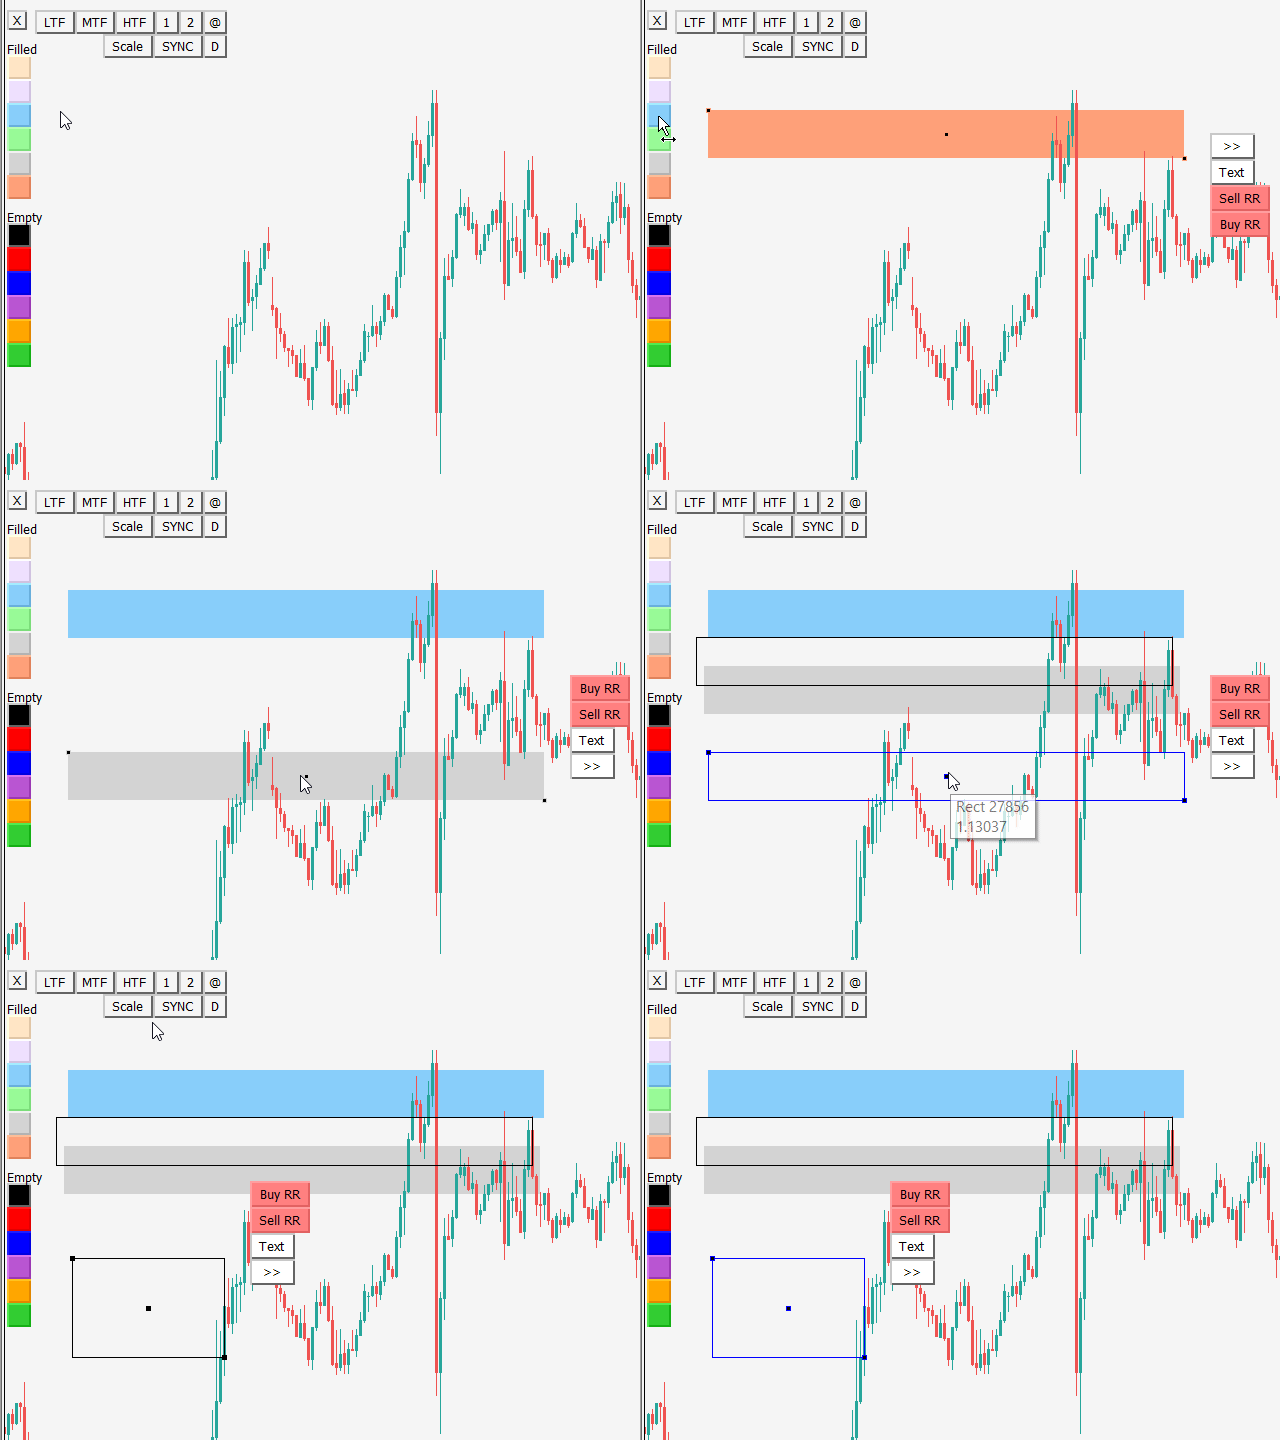
    Risk reward ratio calculation for rectangles

    8. Color change buttons

    Quickly change color for selected object with color button click. If no object is selected then color buttons will create a new rectangle

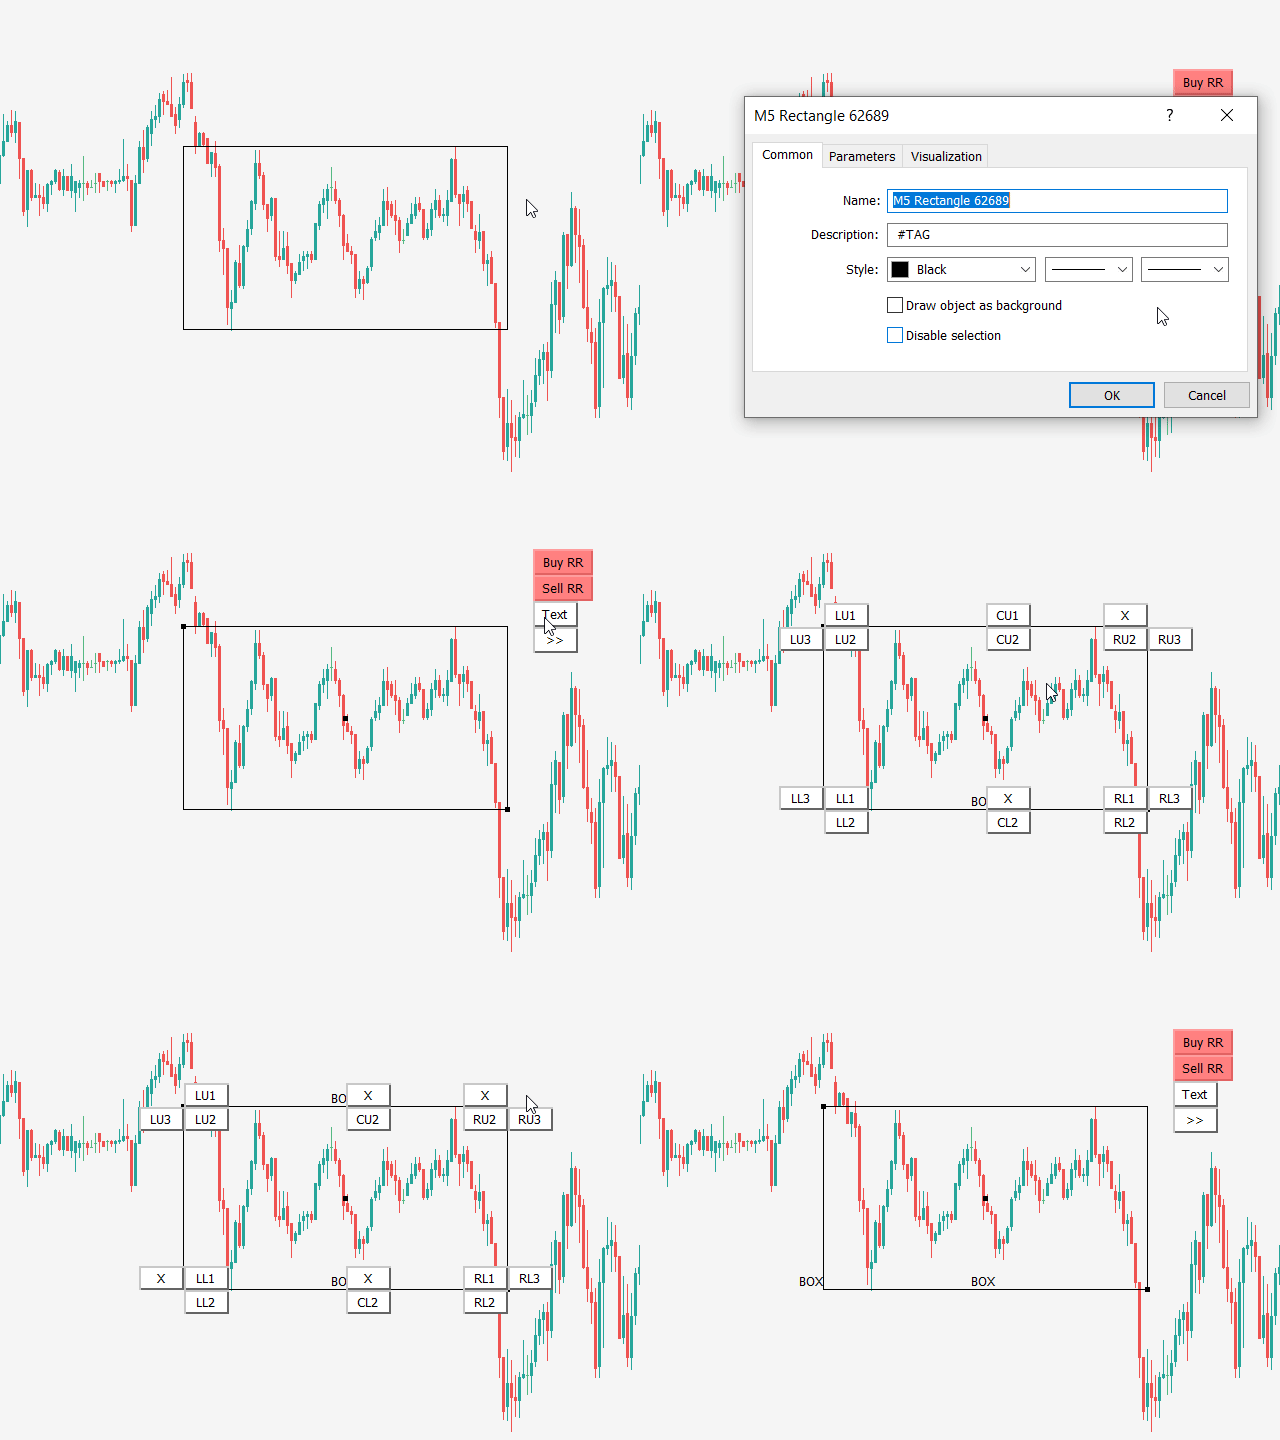
    9. Text button - object name text position

    Display rectangle or trendline text in all possible spots around or inside object. This works for non-extended rectangles and trendlines

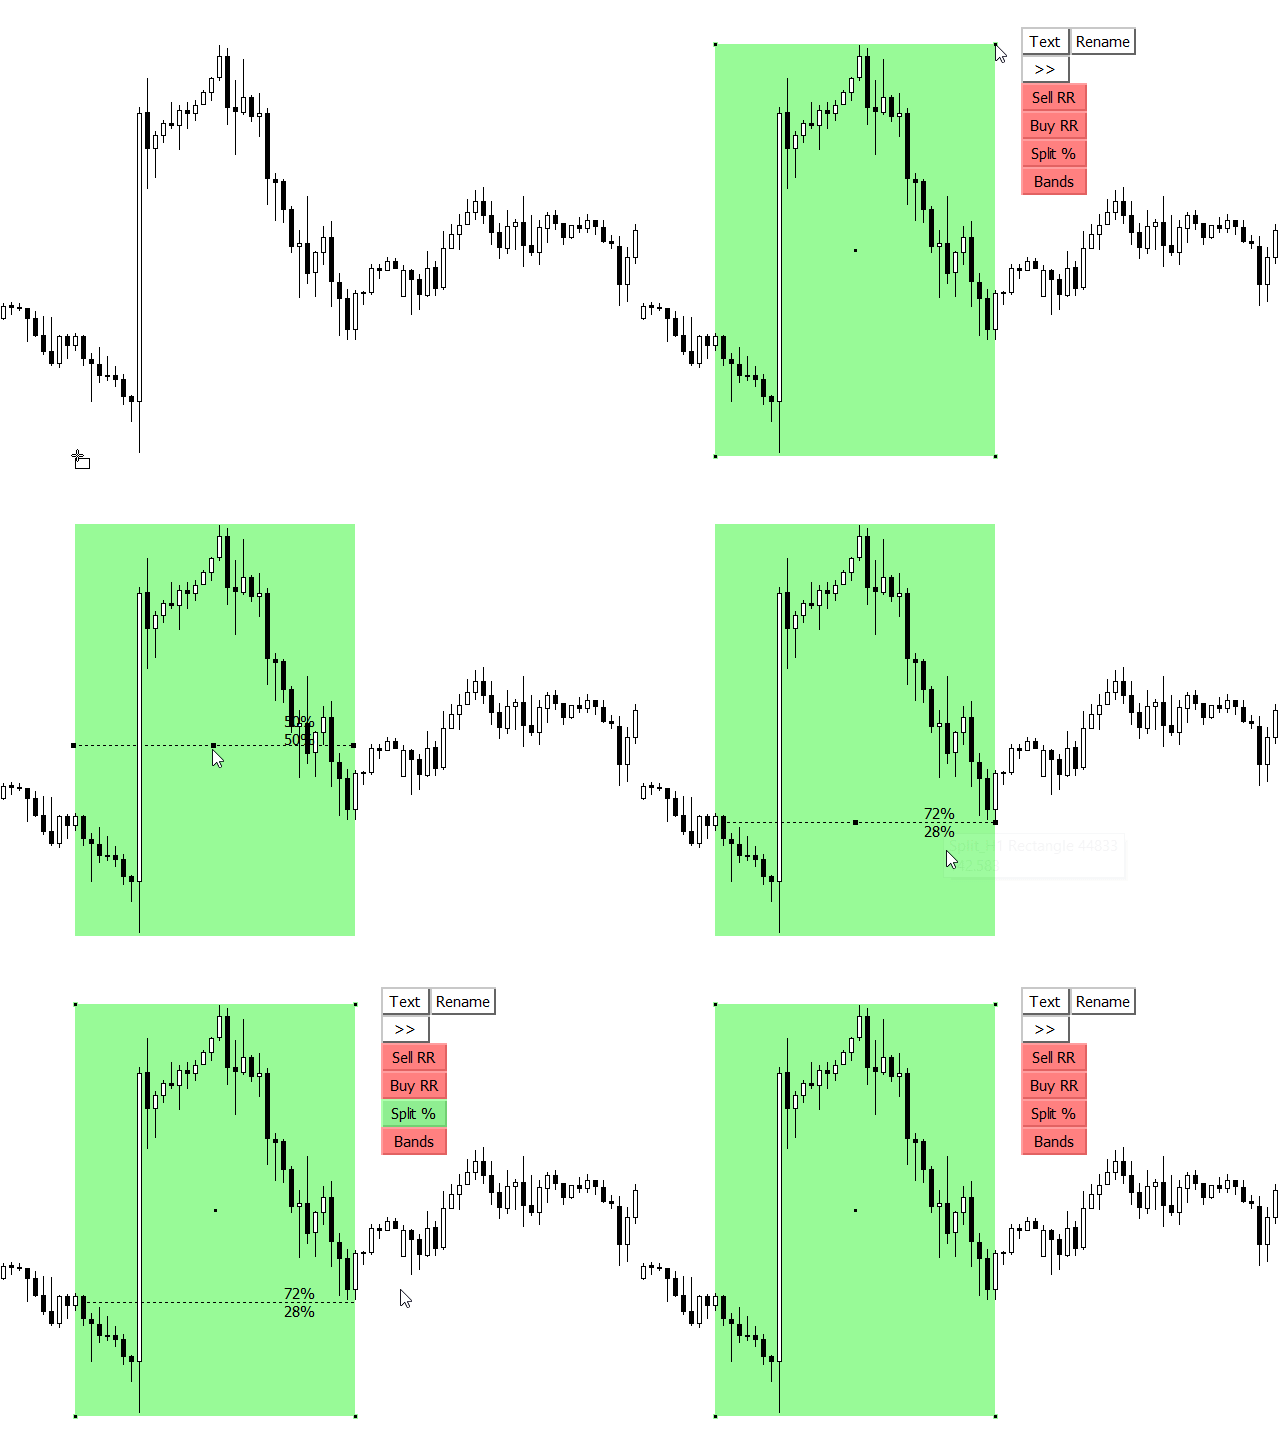
    10. Rectangle Split with % trendline

    Rectangle will be split with extended trendline by 50% of rectangle height. When you move split trendline, then % (percentage) will recalculate

    11. Rectangle Fibonacci retracement tool

    Non-extended rectangle have option to split by % and give option to see discount or premium price of the rectangle

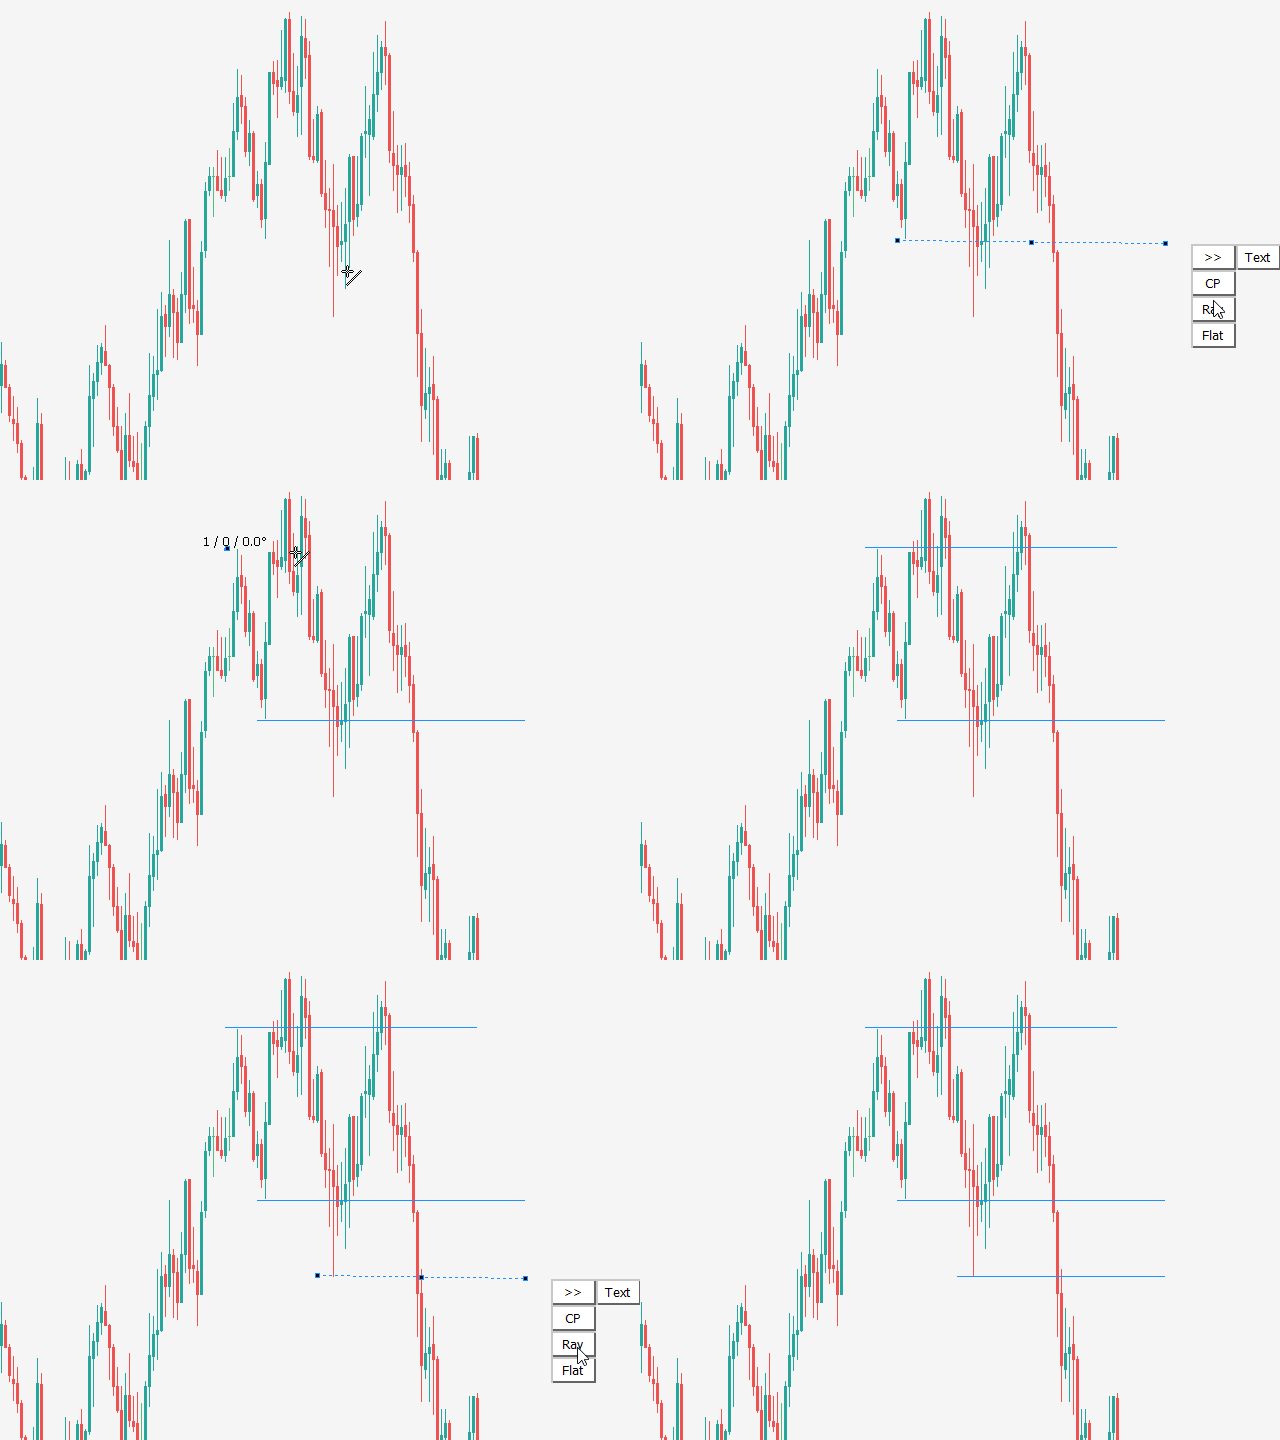
    12. Trendline compression tool and Flat trendline button

    Mark compression zone on the chart, like price action zone. If you click on Flat button then trendline will become horizontal flat

    13. Chart synchronization - chart sync object

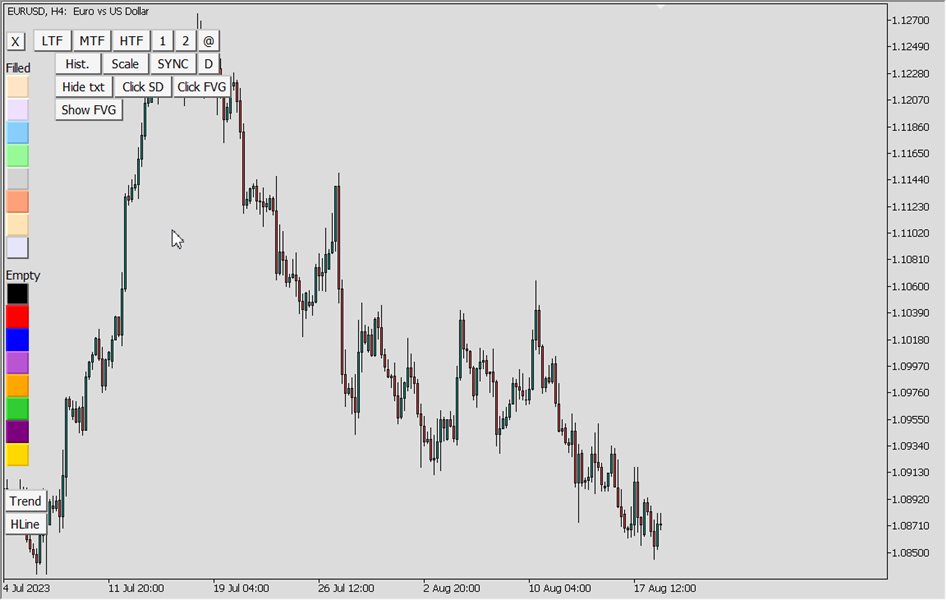
    "SYNC" button function for rectangle, trendline, horizontal line, vertical line and Fibonacci retracement of the same symbol

    14. Multiple timeframes analysis with nested zones  

    Bands button will create top and bottom rectangle lines visible on all TF but filled rectangle will be visible only on current TF. This will help you to see HTF levels on lower timeframes

    15. Auto scale TF visibility for newly created rectangle & trendline 

    This function will set timeframe visibility for current and lower timeframes. This will give bigger importance to objects on higher timeframes

    16. Object timeframe visibility buttons

    Set object timeframe visibility with LTF, MTF and HTF buttons

    17. Navigate chart to Rectangle origin position focus

    Function that will show origin of selected rectangle in the middle of the chart when button @ is clicked

    18. Horizontal break line price

    Function will search first horizontal line break in chart history on the left

    19. Hist. button

    History button that will show the time of last alert in the label. Information is transferred to Technical analysis dashboard where you can see last alerts of all charts in one list

    20. Rename the rectangle and trendline from the suggested list

    Button Rename gives options to rename the rectangles and trendlines from the suggested list

    21. Time Frame colors for new created objects

    User can define special color for each standard time frame

    22. Candle click to create SD zone

    Button Click SD with ON//OFF logic for extended rectangle creation when user click on candle. Zone is based on candle High and Low price

    23. Hotkeys for drawing Support Resistance levels and Supply Demand zones

    Last clicked candle Hotkeys for Support and Resistance levels (extended trendline):

    • H - High
    • L - Low
    • O - Open
    • C - Close

    Last clicked candle Hotkeys for Supply and Demand zones (extended rectangle):

    • S - Supply zone
    • D - Demand zone


    TRADING BOX group chat and channel.

    #SEO and Keywords: Consolidation, breakout alert, break alert, rend alert, Line alert, Horizontal Ray, Smart Ruler, Order Block Breaker, Quick Order Tool, email price alert, Smart Rectangle Extender, RR ratio, RR tool, RR indicator, risk reward indicator, risk reward tool, Risk Reward Ratio Calculation, TBTA, FX Trend, FX Power, Entry Points, FX Volume, Advanced Supply Demand, pip counter, breakout alert, Market Reversal, true price action, pipfinite, candle timer, pivot points. ICT, SMC, Smart Money Concept, Trend Analysis, Price Action, Market Structure, Order Blocks, BOS, CHoCH, Fibonacci Retracement, Multiple Time Frame, Market Structure, Liquidity Voids, Fractals, ZigZag, Time Zone, Market Sessions, Break of Structure, Change of Character,  Smart Market Structure Concepts, timeframe colors, sync chart object or chart sync object, charts synchronizer, phone alert, email alert, angled trendline, trend alert, trend break alert, trendline break alert, line alert, Trend Support Resistance, supply demand zone, Trend line alert, rectangle indicator, rectangle zone, Advanced Dashboard for Currency Strength and Speed, Smart Order Block Indicator, market reversal, Color Levels, Zone Extender, rectangle alert, trading tools, day trading, order flow tool, charting software, trading view, tradingview, scanner, Smart Trader Tools, Alarm Manager, Candle Countdown, High Low Indicator, trading toolkit, Trading alerts


    리뷰 20
    dip_
    35
    dip_ 2023.05.11 16:45 
     

    Trading Box technical Analysis is an amazing product! It allows really fast chart annotation and greatly facilitates chart navigation. It practically turns Mt4/5 into TradingView! Here are my favourite functions: The “Scale” function allows you to navigate charts at a set scale. The “@“ function allows you to locate specific areas on the chart (from high timeframes to low timeframes) The “Sync” function allows you to sync your chart annotations on multiple charts. Since the last update, you can very quickly annotate the Open, Close, Low, High and Candle Bodies (Supply or Demand) with simple keyboard shortcuts! I am very happy that I purchased Trading Box Technical Analysis, my charts look great and my analysis is greatly accelerated. One last thing, Igor, the creator of Trading Box Technical Analysis is amazing and very helpful, he answers emails and offers regular updates. In my opinion, Trading Box Technical Analysis is a MUST HAVE if you use Mt4 or Mt5.

    18104
    297
    18104 2023.04.18 12:49 
     

    Great indicator, but I would like it to also be able to synchronize the Fibonacci retracement.

    ako to
    70
    ako to 2023.01.08 14:32 
     

    I TRIED IT. One of the best tools I used. it made things much easier. must give it a try. it's all you need in your trading.

    추천 제품
    Description  Fibo Retracement  is an indicator that automatically plots  Fibonacci  levels in the main chart based on Close prices , which distinguishes it from the Fibo Levels indicator that plots levels based on High/Low prices. Thus, using both indicators provides the trader with the opportunity of determining support and resistance zones by Fibonacci! The levels are calculated and plotted over a certain interval using the number of bars specified by the user. The user can display Fibonacci l
    30 USD
    Relaxi
    Samandar Huseynov
    Relaxi is a robot for the Forex market. The author of the strategy and algorithm belongs to the professional trader and programmer AQSHİN POLADLİ with more than 14 years of experience in the Forex market. The robot analyzes the market using a unique proprietary indicator, the robot has many algorithms for all situations in the Forex market. The robot's algorithm is secret, so I can't write a lot of information. You don't need to change anything in the robot's settings, choose a risk of 1-2% of
    250 USD
    Hello all The expert works on the Renko chart Bars Range 10  Watching the  video explains how Renko works With expert work. Work like expert image settings as shown in the image First, the Renko chart generation expert only works with the market Wait for the market to work and try like explaining the video Parameters: Lot1: Manual Lot Size Auto_Lot: Set true to automatically calculate optimal Lot Size based on risk preferences, Set False if you want to use manual lot size. Max_Risk: Max Risk
    300 USD
    Introduction to Smart Renko The main characteristics of Renko Charting concern price movement. To give you some idea on its working principle, Renko chart is constructed by placing a brick over or below when the price make the movement beyond a predefined range, called brick height. Therefore, naturally one can see clear price movement with less noise than other charting type. Renko charting can provide much clearer trend direction and it helps to identify important support and resistance level
    80 USD
    Linker
    Roman Lipatov
    5 (1)
    "LINKER" is an indicator that links any number of windows of the charts it is running on. A synchronized crosshair is also available, toggled by the (Ctrl) key or the (L) button. The visibility of the trade levels can be toggled on each chart separately using the (Shift) key or the (V) button. The buttons and the crosshair have customizable settings and colors. For instance, you need to analyze a trading instrument on different timeframes, for example, on H1, H4 and D1. Doing this in a single ch
    15 USD
    표시기는 Dynamic ZigZag( https://www.mql5.com/en/market/product/5356   )를 기반으로 차트에 고조파 패턴을 표시하며 잘 알려진 korHarmonics 버전 중 하나와 거의 완전한 아날로그입니다. 표시기는 ABCD, Gartley(Butterfly, Crab, Bat), 3Drives, 5-0, Batman, SHS, One2One, Camel, Triangles, WXY, Fibo 및 Vibrations와 같은 패턴과 그 종류를 인식합니다. ABCD 및 Gartley 패턴의 표시만 기본적으로 설정에서 활성화됩니다. 역선은 반대 정점을 고정하는 순간을 정의할 수 있습니다. 다양한 사용자 정의 매개변수가 제공됩니다. 메타트레이더 5 버전:   https://www.mql5.com/en/market/product/5195 다운로드할   수 있는 매개변수에 대해 설명합니다.
    50 USD
    Before
    Nadiya Mirosh
    The Before indicator predicts the most likely short-term price movement based on complex mathematical calculations. Most of the standard indicators commonly used in trading strategies are based on fairly simple calculations. This does not mean that there were no outstanding mathematicians in the world at the time of their creation. It is just that computers did not yet exist in those days, or their power was not enough for the sequential implementation of complex mathematical operations. Nowa
    77 USD
    RenkoMaPriceChannel
    Sergey Deev
    1 (1)
    The indicator displays Renko bars on the chart, uses their data to calculate and display the moving average, PriceChannel and generates buy/sell signals. Renko is a non-trivial price display method. Instead of displaying each bar within a time interval, only the bars where the price moved a certain number of points are shown. Renko bars do not depend on a time interval, therefore the indicator works on any timeframe without losing its efficiency. The PriceChannel indicator displays the upper, lo
    30 USD
    Good Filtr
    Artem Kuzmin
    This is an indicator for additional signal filtering. It can be used as an additional filter in a trading system. The indicator does not redraw its data and can be used both in forex trading and with binary options. It has 3 operation modes and flexible sensitivity settings. The indicator uses multiple buffers, therefore it can be easily used in various Expert Advisors.
    30 USD
    KT Renko Live Chart MT4
    KEENBASE SOFTWARE SOLUTIONS
    KT Renko Live Chart utility creates the Renko charts on MT4 that can be further used for speculation or live trading. The Renko chart created by this utility supports most of the custom indicators and automated Expert Advisors. Fully compatible with our Renko Patterns indicator and Renko Patterns EA . To use an Expert Advisor on the generated Renko chart, make sure to untick the "Offline Chart" in the chart properties.  Features A simple and straightforward Renko utility that provides the Ren
    30 USD
    Renko Smart EA
    Salah Eddine Elkouchi
    Renko chart Removes a lot of the noise that is normally generated in the normal chart, and gives  a direct picture of the prices that being charged. This removes much of the noise from the candlestick charts and allows Traders to focus on actual market movements. It can also help Traders  trading larger or smaller price movements. For example, if you are using 50 point bricks, it takes a while to form a bullish or bearish brick. This tells Traders of the market that the it is moving, and that t
    299 USD
    Bermaui Channel
    Muhammad Elbermawi
    5 (26)
    This is a price channel that shows five important price levels on the chart. Those levels are: 1. The Highest High (HH) of the previous x bars. 2. The Highest Low (HL) of the previous x bars. 3. The Center Line. 4. The Lowest High (LH) of the previous x bars. 5. The Lowest Low (LL) of the previous x bars. How does Bermaui Channels Captures Overbought  area Think of the distance between HH and HL levels as an overbought area. When the price candles or bars crosses the HL to the upside this
    50 USD
    Demark mtf
    Sergey Fionin
    The indicator shows De Mark patterns and gives trading signals in the form of arrows and alerts. Shows De Mark lines on the history of quotes. Has a multiframe., Can show DeMark patterns of higher timeframes on lower timeframes. Has a switchable function for displaying fractals. Trading signals are accompanied by sound alerts, as well as sending them to mail and mobile devices.
    69 USD
    The professional line break chart generator is used to create live line break charts (i.e. 3 line break ). The chart is plotted using MT4's offline charging facility thus making it possible to trade* directly from the chart as well as attach any of the standard or custom indicators to perform technical analysis. The line break chart can be displayed as the most widely used 3 line break chart or a custom variation such as 2 or 5 line break chart . Wicks can be displayed or hidden on the chart - t
    45 USD
    Price Trend Light
    Chantal Sala
    4 (1)
    Price Trend Light indicator is a beautiful indicator that shows purchasing areas and sales areas. This indicator is designed to follow the movement of the price which rounds on the opening price. It also provides information of trend follow on the break of the minimum and maximum. The indicator has a very simple graphic but effective, above the opening price you will have a light green color and under the opening price there is a red light. On every Break Out of the minimum or maximum sets in in
    50 USD
    The FX Indicators Alert is a Scanner Tool that allow you to set up alerts for any Indicator, and display or send notifications to your email box and/or mobile device. It will monitor your rules in the selected TimeFrames and Symbols. The tool can manage the standard indicators and the Custom one (7 buffers for the custom indicators). You can create your alerts by combining different indicators. Please note that this tool is not supported in the strategy tester due to multi Symbols, TimeFrames,
    50 USD
    Holy Renko PRO
    Bianca Seara
    3.5 (2)
    About  Holy Renko is a trend identifier capable of identify small and long market movements. This indicator should be use in Renko Charts. VIDEO (information and tips) [HERE] How to install Renko Charts [HERE] Features Developed for Renko Charts Easy to analyze Fast signals Not repaint (when candle close)  Statistics panel Filters false signals Alerts, emails and push notifications  Advantages of Renko Chart Easy to install Easy to analyze Filter out the noise of wicks  Easy identif
    58 USD
    Bigger chart labels would allow the user to be entirely aware of which chart he/she is on.  Each chart window is unique, containing different patterns and economic motives.  There are essential Time Zones included in clear view.  Mainly,  the Chart Symbol and current, utmost Price Point ,  is shown in a bigger size(Customizable).  Bigger chart labels for the chartist.                 Specifications:   Any   Language   and   Style   can be added or already available, for satisfaction. In ord
    FREE
    PipMaster is built using a powerful trend + momentum following algorithm. Made after years of testing and with market noise filtering built-in.  Aggressive traders can enter a trade as soon as an arrow appear. Conservative traders should wait for a visual alert after a closed candle bar. This indicator is a great tool to be used with your most trusted trend/momentum trading strategy and with solid money management rules. Key Benefits: -Super easy to use by following color coded arrow pointing
    49 USD
    <LOGIC> The EMA RENKO EA should run in Renko chart to show the best performance. The EA will entry based on 2 EMA line cross. (it is changeable in parameter.) As a result of FT , the best box size for XAUUSD (GOLD) is BOX 60 to 100.  Renko box size should be larger than spread value. Normally 3 times of spread. Please decide your box size with yourself. The EA will place addtional order as Grid if the trend move  to xxx pips from the last order. You can turn on/off in the parameter. T
    50 USD
    KT Renko Patterns Robot MT4
    KEENBASE SOFTWARE SOLUTIONS
    In manual trading, many of the trading setups and opportunities provided by the KT Renko Patterns indicator are missed due to sudden price movements on the Renko charts. KT Renko Patterns EA solves this problem by implementing a 100% automated trading strategy based on the "KT Renko Patterns indicator". After fetching the patterns formation and signals directly from the indicator, it performs some pre-checks and assessments to efficiently execute the trading positions. All the dependencies
    145 USD
    Atlon
    Roman Kucher
    Signal complex Atlon is a ready-made trading system that sends signals in the form of arrows to e-mail and push notifications to your phone. Atlon also displays ready-made TP levels in the form of red squares. The system works on any chart (currency pairs, stocks, cryptocurrencies, metals, oil). Timeframe H1. The system does not redraw and the arrows do not disappear anywhere. The set includes ready-made settings that must be loaded before installing on the chart. Download settings System parame
    379 USD
    Ultimate pattern builder Scanner (multi time frame and currency pair) Allows you to build any pattern with up to 3 candlesticks. This Scanner is basically indicator with scanning feature,  you can now create your own candlestick patterns and scan them in real time at any time frame and currency pair (stocks, energies, crypto...). Now you can use full potential of indicator in real time trading. If you dont know yet what is so special about this ultimate pattern builder software collection: it
    70 USD
    Analitic RSI
    Yvan Musatov
    A professional expert analyzes the market using the relative strength index. The basic principle is that the bot takes the indicated prices for a certain period of time and calculates the strength and amplitude of the price. This can show when the trend will lose strength and reverse. The signal from the exit from the overbought/oversold zones is analyzed, the levels of these zones will be the levels with LEVEL_MAX and LEVEL_MIN values. We buy when the signal first falls below a certain level (
    599 USD
    "Bitcoin indicator" is a ready-made mechanical trading system for Bitcoin. The system is implemented as an indicator that shows the trader on the chart the price reversal points and the current trend direction. This information is enough to effectively trade in the market. The "Bitcoin indicator" consists of a complex analytical block that constantly analyzes the market and shows the trader where the trend is heading. The indicator also shows with dots on the chart, the price reversal points. S
    247 USD
    ZigZag Nrp
    Yaroslav Varankin
    Zigzag indicator with removed redrawing open a deal Stands when the price crossed the zigzag line If the price crosses  the line from the bottom up, then this is a buy signal If the price crosses the line from top to  bottom then this is a sell signal Stoploss is set at the bend of the Exit the deal by the opposite signal or take profit  Zigzag nrp indicator is easy to set up In it you can choose a  suitable period for yourself Recommended period 3. This is an individual development This tool  
    100 USD
    Power Renko MT4
    Pierce Vallieres
    Power Renko is an indicator which plots Renko bricks underneath the chart using a histogram. You can select the brick size and the timeframe of the Renko bricks as well as whether or not to use the close price or the high/low price of the candles. Renko bricks are based on price alone, not time, therefor the Renko bricks will not be aligned with the chart's time. They are extremely useful for trend trading and many different strategies can be formed from them. Buffers are provided allowing you t
    30 USD
    MyTraderEA
    Khayelihle Tosh
    AutoTraderEA Description As the name says, this is an autotrading robot.   It trades on H1 timeframe.  It looks for clear trades, and is very accurate, yet still will take a couple of trades per week. Otherwise losses are minimised through a 130 pip StopLoss which can be modified. AutoTrader gives the user the ability to choose whether to keep trading volumes the same or change in direct proportion to the change in the account equity.   The EA has been backtested only on the EURUSD pair over a
    450 USD
    MT4 EA - FOREX Challenger Plus This unique automated trading system adopted 3 Layers of difference entry at two different price positions. The pre-defined lot size is actually divided into 3 trades and enters different price positions once the entry condition is fulfilled. If a drawdown occurs, the EA will open an additional position based on the pre-defined strategy, and when the total profit of all orders is greater than a certain value, all orders, including unprofitable ones, are closed. It
    99 USD
    MT4 EA - FOREX Scorer Plus This unique automated trading system adopted 3 Layers of difference entry at two different price positions. The pre-defined lot size is actually divided into 3 trades and enters different price positions once the entry condition is fulfilled. If a drawdown occurs, the EA will open an additional position based on the pre-defined strategy, and when the total profit of all orders is greater than a certain value, all orders, including unprofitable ones, are closed. It is n
    99 USD
    이 제품의 구매자들이 또한 구매함
    Trade Assistant MT4
    Evgeniy Kravchenko
    4.5 (161)
    거래당 위험 계산, 라인을 사용한 손쉬운 신규 주문, 부분 청산 기능을 통한 주문 관리, 7가지 유형의 트레일링 스탑 및 기타 유용한 기능을 제공합니다. 주의, 응용 프로그램은 전략 테스터에서 작동하지 않습니다. Manual, Description, Download demo 라인 기능       - 차트에 개시선, 손절매, 차익실현을 표시합니다. 이 기능을 사용하면 새로운 주문을 쉽게 하고 개봉 전에 추가 특성을 볼 수 있습니다. 위기 관리       -       위험 계산 기능은 설정된 위험과 손절매 주문의 크기를 고려하여 새 주문의 볼륨을 계산합니다. 이를 통해 손절매 크기를 설정하고 동시에 설정된 위험을 존중할 수 있습니다. 로트 계산 버튼 - 위험 계산을 활성화/비활성화합니다. 필요한 위험 값은 위험 필드에 0에서 100 사이의 백분율 또는 예금 통화로 설정됩니다. 설정 탭에서 위험 계산 옵션을 선택합니다. $ 통화, % 잔액, % 지분, % 자유 마진, % 사용
    100 USD
    가격이 순식간에 변할 수 있는 시장에서 주문은 가능한 한 간단해야 한다고 생각하십니까? Metatrader에서는 주문을 열 때마다 시작 가격, 손절매 및 이익실현 및 거래 규모를 입력하는 창을 열어야 합니다. 금융 시장 거래에서 자본 관리는 초기 예금을 유지하고 곱하기 위해 필수적입니다. 따라서 주문을 하고 싶을 때 얼마나 큰 거래를 열어야 하는지 궁금할 것입니다. 이 단일 거래에서 위험을 감수해야 하는 예치금의 비율은 얼마입니까? 이 거래에서 얼마나 많은 이익을 얻을 수 있으며 위험 대비 이익 비율은 얼마입니까? 거래 규모를 설정하기 전에 거래 규모가 어떻게 되어야 하는지에 대한 질문에 대한 답을 얻기 위해 필요한 계산을 수행합니다. 이 모든 작업을 자동으로 수행하는 도구가 있다고 상상해 보십시오. 차트를 열고 시장 분석을 하고 진입점, 방어점(손절매) 및 목표(이익 실현)를 수평선으로 표시하고 마지막에 위험 수준을 정의합니다. 이 거래에서 감당할 수 있는 가용 자본의 %로, 이
    99 USD
    Mentfx Mmanage
    Anton Jere Calmes
    5 (16)
    Drag and Drop Trade Manager. Draw your entry and have the tool calculate the rest. Advanced targeting and close portions of a trade directly available in tool (manage trades while you sleep). Market order or limit order on either side with factored spread. Just draw the entry, the tool does the rest. Hotkey setup to make it simple. Draw where you want to enter, and the stop loss, the tool calculates all necessary risk with your desired % risk. Check out the video for a breakdown of how it looks
    300 USD
    The product will copy all telegram signal to MT4   ( which you are member  ) , also it can work as remote copier.  Easy to set up, copy order instant, can work with almost signal formats, image signal, s upport to translate other language to English Work with all type of channel or group, even channel have "Restrict Saving Content", work with  multi channel, multi MT5 Work as remote copier: with signal have ticket number, it will copy exactly via ticket number. Support to backtest signal. How to
    219 USD
    구매 후에 저에게 연락 주시면 무료로   Trade Republic 을 보내 드리겠습니다 GPT Assistant는 고급 분석과 포괄적인 통찰력을 통해 거래를 다음 수준으로 이끄는 혁신적인 유틸리티입니다. 이 독특한 도구는 시장에 접근하는 방식을 혁신하여 전례 없는 이점을 제공합니다. 설정 과정은 빠르고 쉽습니다. 알고리즘 거래를 활성화하고 목록에 나열된 URL에 대한 WebRequest를 허용하는 것만으로도 이 강력한 유틸리티의 전체 잠재력을 발휘할 수 있습니다. chatGPT와 신뢰할 수 있는 뉴스 소스와의 연결을 통해 실시간 데이터를 제공하여 최신 정보를 제공합니다. 어떤 차트에든 연결된 후, GPT Assistant는 GPT Assistant 창과 주문 목록의 두 개의 주요 창을 제공합니다. 이 창들은 거래의 전체적인 개요를 제공하며 다양한 분석 옵션에 편리하게 접근할 수 있습니다. GPT 탭 내에서 분석을 사용자 정의할 수 있습니다. 선호하는 언어를 선택하고 원하는 시간
    125 USD
    Advanced trading tool: One click smart orders that execute under your conditions Developed by trader for trading community:  position size calculator (lot size), open position after price action, strategy builder, set and forget trading, mobile notifications... Risk Management -  Risk percentage position size calculator, gain percentage, target risk reward ratio, spread and commissions are included in calculations 7 Advanced order types   - Set and forget trading with price action automation
    118 USD
    The product will copy all  Discord  signal   to MT4   ( which you are member  ) , also it can work as remote copier.  Easy to set up. Work with almost signal formats, support to translate other language to English Work with multi channel, multi MT4. Work with Image signal. Copy order instant, auto detect symbol. Work as remote copier: with signal have ticket number, it will copy exactly via ticket number. How to setup and guide: Let read all details about setup and download Discord To MetaTrade
    199 USD
    FiboPlusWaves
    Sergey Malysh
    5 (1)
    FiboPlusWave Series products Ready-made trading system based on Elliott waves and Fibonacci retracement levels . It is simple and affordable. Display of the marking of Elliott waves (main or alternative option) on the chart. Construction of horizontal levels, support and resistance lines, a channel. Superposition of Fibonacci levels on waves 1, 3, 5, A Alert system (on-screen, E-Mail, Push notifications).    Features: without delving into the Elliott wave theory, you can immediately open one of
    875 USD
    Trade Assistant Pro 36 in 1
    Makarii Gubaydullin
    4.94 (16)
    다기능 도구: 로트 계산기, 가격 조치, R/R 비율, 무역 관리자, 공급 및 수요 영역을 포함한 65개 이상의 기능 데모 버전   |   사용자 매뉴얼   |   MT5 버전 이 유틸리티는 전략 테스터에서 작동하지 않습니다. 여기에서 데모 버전을 다운로드하여 제품을 테스트할 수 있습니다. Contact me   질문/개선 아이디어가 있는 경우/버그가 발견된 경우 저에게 연락 하십시오. 거래 프로세스를 간소화, 가속화 및 자동화하십시오. 이 대시보드로 표준 터미널 기능을 확장하십시오. 유틸리티는 외환, 주식, 지수, 암호화폐 등 모든 거래 수단에서 작동합니다. 1. 새로운 거래 열기 : 로트/리스크/RR 계산: 1. Lot 계산기 (리스크 규모에 따른 거래량 계산) 2. 리스크 계산기 (로트 규모에 따른 리스크 금액) 3. 위험/보상 비율(RR) 4. 주문에 대한 활성화 트리거 + StopLimit 구매 / StopLimit 판매 5. 가상 SL / TP 레벨 (숨겨진 SL
    139 USD
    Trade Copier Pro
    Vu Trung Kien
    4.54 (13)
    Trade Copier Pro is a tool to copy trade remotely between multiple MT4/MT5 accounts at different computers/locations over internet. This is an ideal solution for signal provider, who want to share his trade with the others globally on his own rules. One provider can copy trades to multiple receivers and one receiver can get trade from multiple providers as well. The provider can even set the subscription expiry for each receiver, so that receiver will not be able to receive the signal after that
    149 USD
    TakePropips TradePad Pro
    Eric John Pajarillaga Aldana
    5 (4)
    TakePropips TradePad Pro 에는 강력한 거래 관리자, 통화 강도 측정기, 계정 보고 도구, 위험 관리 도구 등이 포함되어 있습니다! 그것은 당신이 만나게 될 가장 진보된 외환 거래 관리자이자 거래 도우미 중 하나입니다! 보다 효율적인 무역 거래 관리 방법을 원하는 트레이더를 위한 완벽한 솔루션입니다. 다음 블로그 게시물에서 사용 설명서를 다운로드할 수 있습니다.   https://www.mql5.com/en/blogs/post/751180 Strategy Tester에서 이 거래 시스템을 테스트할 수 있습니다(비주얼 모드 활성화). 실시간 차트에서 테스트하고 싶다면 저에게 메시지를 보내 7일 평가판을 받을 수도 있습니다. 자세한 내용은 설명 아래에 비디오 자습서도 제공됩니다. 질문이 있거나 도움이 필요한 경우 언제든지 저에게 연락해 주시면 기꺼이 도와드리겠습니다. TradePad Pro는 모든 Forex 쌍, 금속, 상품, 지수 및 암호화폐에서 작동합니다.
    299 USD
    매우 강력한 도구 주의!! 당신이 여기 있다면, 그것은 당신이 Forex 도구를 실행하는 것에 대해 궁금하기 때문입니다. 이 도구는 변동에 기반한 실제 수학적 계산을 사용하여 Forex 시장의 실제 움직임에 있습니다. Forex는 수학이기 때문입니다. 좋아요, 당신은 증거를 원합니다. 저에게 연락하십시오. 수학은 의견이 아닙니다. Forex 도구의 실행은 다양한 통화 쌍 사이에 존재하는 이 수학적 관계를 정확하게 기반으로 합니다. 가장 많은 수익을 올리기 위해 어떤 통화 쌍에 집중할 수 있는지 미리 알 수 있습니다. 대부분의 트레이더는 차트에서 동일한 것을 보고 동일한 정보를 연구하기 때문에 Forex에서 90%가 손실되는 것입니다. 그렇지 않나요? 나는 대다수의 아이디어가 아니라 Forex 시장을 지배하는 실제 기반에 기반한 도구를 가지고 있습니다. 이 도구는 이해하기 쉽고 사용하기 쉬운 시각적 도구입니다. 구매하시는 분들은 원하시면 제
    1 999 USD
    What Exactly Is A Smart Trading Tool? Smart Trading Tool was developed for fast and comfortable trading of the financial markets especially for ORDER BLOCKS TRADERS . It provides traders functionalities, such as: A Drawing Tool One-Click Trading Panel Automated Lot Sizes Calculation based on your risk appetite & Money Management ( Watch this video , how this tool can help manage your risk per trade better!) Built in PRICE LEVELS (Fibonacci, Round Numbers, Daily hi-low, etc) Shows Trading Informa
    150 USD
    Equity Protection EA
    CARLOS ALBERTO VALLOGGIA
    5 (2)
    Equity Protection EA MT4 General Features: Full control over the results of a trading session.- Controls the overall result, for all forex symbols, indices, metals, stocks, etc. Control is done over the global equity.- Close all trades, on all symbols, when reaching a profit or loss rate.- Changeable configurations in both amount and percentages.- Protection of results by trailing stop global.- Record of results achieved for the session (greater equity and lower equity).- All calculations a
    99.90 USD
    EA Hedger
    Sergej Chukhista
    4.67 (3)
    거래 고문을 구입했습니까, 신호를 구독했습니까, 아니면 수동으로 거래하고 있습니까?! 위험 관리를 잊지 마십시오. EA Hedger   는 헤징을 사용하여 위험을 관리할 수 있는 다양한 설정이 있는 전문 거래 유틸리티입니다. 헤징은 이미 열려 있는 포지션의 반대 포지션을 여는 거래 기법입니다. 헤징을 통해 위치를 완전히 또는 부분적으로 차단(잠금)할 수 있습니다. 이 제품을 사는 것이 유익한 이유: 신뢰성   - 어드바이저가 철저히 점검 및 테스트되었습니다. 유용성 -전문가 고문은 실제 거래에 사용되며 그 작업에 효과적입니다 성능 -위험 회피와 거래의 결과는 위험 회피없이 거래의 결과보다 훨씬 낫다 가용성 -고문의 비용은 한 달에$4.91 또는 하루에$0.17 입니다-이것은 1-2 스프레드입니다 지원   – 토론에서 판매자에게 질문하고 조언을 얻을 수 있습니다. 개발   - 제품에 대한 희망 사항을 작성할 수 있으며 가능한 경우 추가됩니다. 업데이트   - 예정된 업데이트를
    199 USD
    Telegram MT4 Signal Trader는 Telegram 채널, 그룹, 채팅을 통해 수신되는 신호를 거래하는 데 도움이 되는 EA입니다. 채널의 소유자일 필요도 없습니다. 텔레그램 계정에서 시그널 텍스트를 읽을 수 있다면 모두 거래할 수 있습니다. EA는 Telegram API를 통해 Telegram 채널, 그룹, 개인 채팅에서 신호 텍스트를 읽는 데 도움이 되는 Telegram Reader 응용 프로그램인 멋진 무료 도구가 필요합니다. 설정 방법 여기에서 사용자 가이드를 읽고 EA가 어떻게 작동하는지 설정하고 이해하십시오. * 주요 특징: 10개의 라이선스: 10개의 VP, 데스크톱, 노트북에서 EA를 실행할 수 있습니다. 무제한 MT4 계정 및 텔레그램 채널: 무제한 MT4 계정(데모 및 실제), 무제한 텔레그램 채널(모든 채널, 그룹, 채팅), 무제한 텔레그램 계정(귀하의 계정 및 다른 사람의 계정)에 대해 EA를 사용할 수 있습니다. 모든 신호
    199 USD
    The Expert Advisor will help you forward all pop-up alert with screenshot from  MetaTrader 4 to Telegram channel/ group, also forward all notifications to Telegram. Parameters  -  Telegram Bot Token - create bot on Telegram and get token.  -  Telegram Chat ID  - input your Telegram user ID,  group / channel ID  -  Forward Alert - default true, to forward alert.  -  Send message as caption of Screenshot - default false, set true to send message below Screenshot  How to setup and guide  - Telegram
    100 USD
    FX28 Trader
    Tsvetan Tsvetanov
    5 (1)
    Multifunctional dashboard for currency traders. Simple and Intuitive Trading Interface. Separate lists with Individual trades and combined net positions for each symbol. Open, close and manage positions with one click. Ability for semi-automated grid trading with stealth orders. Multiple options to preset automated pyramiding strategies up or down. Track and manage large number of open trades across multiple symbols. Bulk modification of SL and TP orders. Modify unlimited number of SL/TP le
    139 USD
    이 맞춤형 Ultimate Sniper 대시보드는 원래 Ultimate Sniper 대시보드 지표에 대한 EA 업그레이드입니다. 최대 98개의 서로 다른 알고리즘과 함께 작동하여 작업하는 자산 클래스에 대한 추세의 진정한 특성을 포착합니다. 이는 몇 달 동안 대부분의 고객으로부터 받은 많은 제안과 조언에 대한 직접적인 응답입니다. 이 사용자 정의 버전은 완전히 사용자 정의할 수 있습니다. 98개의 개별 맞춤형 알고리즘으로 구동됩니다. 매우 멋진 시각적 인터페이스로 모든 쌍 또는 기간에 대한 전체 시장 추세를 쉽고 자신 있게 따를 수 있습니다. 텔레그램에 실시간 알림을 보낼 수 있습니다. 거래 쌍에 따라 자신의 인덱스를 만들 수 있습니다. 휴대폰으로 실시간으로 알림을 보낼 수 있으므로 움직임이 설정되고 있음을 알기 위해 PC에 있을 필요가 없습니다. 입력 설정에서 8개의 인덱스를 설정할 수 있습니다. 알림을 받을 인덱스 및 기간을 설정할 수 있습니다. 인터넷 연결이 감지되지 않으면 경
    299 USD
    Attention:  Demo version for review and testing can be downloaded   here . It does not allow trading and can only be run on one chart. Active Lines - a powerful professional tool for operations with lines on charts. Active Lines provides a wide range of actions for events when the price crosses lines. For example: notify, open/modify/close a position, place/remove pending orders. With Active Lines you can assign several tasks to one line, for each of which you can set individual trigger condi
    120 USD
    Comprehensive on chart trade panel with the unique ability to be controllable from mobile as well. Plus has a library of downloadable configuration, e.g. exit rules, extra panel buttons, pending order setup and more. Please see our product video. Works with all symbols not just currency pairs. Features On chart panel plus controllable from free app for Windows, iPhone and Android Built-in script engine with library of downloadable configuration, e.g. add 'Close All Trades in Profit' button, exit
    99 USD
    Ultimate Trailing Stop EA
    BLAKE STEVEN RODGER
    4.57 (14)
    This EA Utility allows you to manage (with advanced filtering) unlimited open orders (manual or EA) with 16 trailing stop methods: fixed, percent, ATR Exit, Chandelier Exit, Moving Average, Candle High Low Exit, Bollinger Bands, Parabolic, Envelope, Fractal, Ichimoku Kijun-Sen, Alligator, Exit After X Minutes or Bars, RSI and Stochastic. The trailing stop can be either real or virtual, and you can exit fully or with a partial close percent on touch or bar close.  Moreover, you can add (overr
    100 USD
    MT4 Alert Signal Trader  is an EA that helps you trade MT4 Alert popup. Some indicators can provide signals by showing an alert popup containing signal texts. This EA will read and trade these signal texts. The alert texts should contain at least 2 elements:  (1) a symbol text   (ex: "EURUSD") and  (2) a command type   (ex: "Buy", "Sell", "Close") that trigger EA's trading activities. Some other contents that may have or not are open price, stop loss, take profit values... The EA needs an aweso
    149 USD
    FTMO Adam AI 2
    Vyacheslav Izvarin
    ADAM AI 2 Special Version for FTMO 100k ACCOUNT MT4 No Martingale No GRID Our 2nd EA created using AI ChatGPT technology Trade only GOOD and checked PROP FIRMS  Default parameters for Challenge $100,000 Tested on EURUSD only  Use 15MIN Time Frame Close all deals and Auto-trading  before Weekend at 12:00GMT+3  Friday For Prop Firms MUST use special Protector   https://www.mql5.com/en/market/product/94362 -------------------------------------------------------------------------------------------
    1 800 USD
    Unlimited Binary Options Copier Remote is a powerful tool to copy binary options trades remotely between multiple accounts at different locations over internet. This is an ideal solution for signal provider, who want to share his binary options trades with the others globally on his own rules. One provider can copy trades to unlimited receivers and one receiver can get trade from unlimited providers as well. The provider can set the subscription expiry for each receiver, so that receiver will no

    299 USD
    The  Easy Strategy Builder (ESB)  is a " Do It Yourself " solution that allows you to create a wide range of the automated trading strategies without any line of codes. This is the world’s easiest method to automate your strategies that can be used in STP, ECN and FIFO brokers. No drag and drop is needed. Just by set conditions of your trading strategy and change settings on desired values and let it work in your account. ESB has hundreds of modules to define unlimited possibilities of strategi
    299 USD
    The product is used to trade base on Alert signal from Tradingview with support of an application "Tradingview To MetaTrader". Easy to setup, simple format with custom keyword, do not need to open Internet browser to get alert Allow g et   popup alert from one or more   Tradingview account All option to management orders as trailing stop, breakeen, partial close, time filter, news filter ... Option to auto open grid orders How to setup and guide: Let read all details about setup and download " T
    149 USD
    MT4 Strategy Builder
    Jacobus Van Schoor
    4.27 (15)
    MT4 전략 빌더('StratBuilder')는 MT4 플랫폼에서 실행되는 그리드 거래 주문 관리 유틸리티입니다. 이 제품은 이제 MT5 플랫폼에서도 사용할 수 있습니다. https://www.mql5.com/en/market/product/68858 MQL5에서 가상 사설 서버(VPS)를 임대하고 거래자의 컴퓨터 설정을 VPS로 마이그레이션하여 StratBuilder가 연중무휴로 실행할 수 있도록 하는 것이 좋습니다. 고유한 StratBuilder 개념: 거래 바스켓은 미리 결정된 가격 수준(심볼 및 거래 방향별로 링 펜스)에서 열리고 계정 잔액 또는 자본에 대한 목표 비율 이익이 달성되면 이익 실현이 발생합니다. 이 시점에서 모든 포지션이 동시에 마감되고 새로운 바스켓이 거래가 열립니다. YouTube 소개 동영상을 보려면 이 링크를 선택하세요. https://www.youtube.com/watch?v=4IgkdZKk25k 샘플 전략 매개변수 .set 파일은
    340 USD
    Strategy Builder offers an incredible amount of functionality. It combines a trade panel with configurable automation (covert indicators into an EA), real-time statistics (profit & draw down) plus automatic optimization of SL, TP/exit, trading hours, indicator inputs. Multiple indicators can be combined into an single alert/trade signal and can include custom indicators, even if just have ex4 file or purchased from Market. The system is easily configured via a CONFIG button and associated pop-up
    199 USD
    RedFox Copier Pro
    Rui Manh Tien
    5 (9)
    FREE SIGNAL CHANEL:  https://t.me/redfox_daily_forex_signals Time saving and fast execution Whether you’re traveling or sleeping, always know that Telegram To Mt4 performs the trades for you. In other words, Our   Telegram MT4 Signal Trader  will analyze the trading signals you receive on your selected Telegram channels and execute them to your Telegram to MT4 account. Reduce The Risk Telegram To Mt4   defines the whole experience of copying signals from   Telegram signal copier to mt4  p
    149 USD
    제작자의 제품 더 보기
    Advanced trading tool: One click smart orders that execute under your conditions Developed by trader for trading community:  position size calculator (lot size), open position after price action, strategy builder, set and forget trading, mobile notifications... Risk Management -  Risk percentage position size calculator, gain percentage, target risk reward ratio, spread and commissions are included in calculations 7 Advanced order types  - Set and forget trading with price action automation (O
    148 USD
    Advanced trading tool: One click smart orders that execute under your conditions Developed by trader for trading community:  position size calculator (lot size), open position after price action, strategy builder, set and forget trading, mobile notifications... Risk Management -  Risk percentage position size calculator, gain percentage, target risk reward ratio, spread and commissions are included in calculations 7 Advanced order types   - Set and forget trading with price action automation
    118 USD
    Everything for chart Technical Analysis indicator mt5 in one tool Draw your supply demand zone with rectangle and support resistance with trendline and get alerts to mobile phone or email alert -  Risk reward indicator mt5 Video tutorials and manuals   here .  Find contacts on my   profile . 1.   Extended rectangles and trendlines Object will be extended to the right edge of the chart when price will draw new candles on chart. This is rectangle extender or trendline extender. 2. Price touch a
    118 USD
    Display rectangles and trendlines list  from Trading box  Technical analysis tool. Objects are ordered in the list by   pip distance   that is difference between object price and Bid price. With this tool you will know which chart to look for next trading opportunity. No more switching between charts and searching for trades where price is close to rectangle zone or trendline support resistance level. Sorted Rectangles and Trendlines by pip distance -  If you are trading on multiple charts, the
    FREE
    Place price Alerts on extended  Rectangles and Trendlines -  Risk reward indicator mt4 Extend Rectangles & Trendlines to the right edge Mark your supply demand zones with extended rectangle and draw support resistance lines with extended trendline. Find detailed manuals   here . Find contacts on my   profile . MT4 Rectangle extender indicator will simplify and make it easier for you to analyze markets and stay notified about important events. When you extend rectangle or trendline the action bu
    48 USD
    Place price Alerts   on  extended  Rectangles   and   Trendlines -  Risk reward indicator mt5 Extend Rectangles & Trendlines to the right edge Mark your supply demand zones with extended rectangle and draw support resistance lines with extended trendline. Find detailed manuals   here .  Find contacts on my   profile . MT4 Rectangle extender indicator will simplify and make it easier for you to analyze markets and stay notified about important events. When you extend rectangle or trendline the a
    58 USD
    Display Order box list from  Trading box  Order Management tool. Find contacts and manual links on my   profile . This dashboard gives you an edge in forex trading because in few seconds you can decide which pair and timeframe is worth to watch more closely. This is how you will not be distracted by all other forex pairs that you trade, and you will not miss great opportunities to trade the best price. Trading Dashboard  (order box overview panel and Trading box Order management extension) Tr
    FREE
    Rectangle position changer   tool is used for precise/accurate rectangle positioning by time or price only.   You can move each side of rectangle separately with lines created around selected rectangle. This tool will replace classical grid because it is like dynamical chart grid for rectangle grid. This tool allows you to adjust your rectangles, from all 4 sides, with ease and makes your technical analysis that much faster. This tool is handy when corner points for changing rectangle position a
    FREE
    Display rectangles and trendlines list from  Trading box  Technical analysis tool. Objects are ordered in the list by pip distance that is difference between object price and Bid price. With this tool you will know which chart to look for next trading opportunity. No more switching between charts and searching for trades where price is close to rectangle zone or trendline support resistance level. Sorted Rectangles and Trendlines by pip distance -  If you are trading on multiple charts, then th
    FREE
    Rectangle position changer  tool ( rectangle indicator) is used for precise/accurate rectangle positioning by time or price only. You can move each side of rectangle separately with lines created around selected rectangle. This tool will replace classical grid because it is like dynamical chart grid for rectangle grid. This tool allows you to adjust your rectangles, from all 4 sides, with ease and makes your technical analysis that much faster. This tool is handy when corner points for changi
    FREE
    Display Order box list from  Trading box  Order Management tool. Find contacts and  manual   links on my   profile . This dashboard gives you an edge in forex trading because in few seconds you can decide which pair and timeframe is worth to watch more closely. This is how you will not be distracted by all other forex pairs that you trade, and you will not miss great opportunities to trade the best price. Trading Dashboard  (order box overview panel and Trading box Order management extension)
    FREE
    Save time placing orders and automate entry with Advanced Smart orders. Managing open trade with TBOM is easy Video tutorials and manuals   here .   Find contacts on my   profile .   FREE Order box Dashboard  tool  here FREE version works for CHFJPY and AUDCAD Money Management -  Risk percentage position size calculator, gain percentage, target risk reward ratio, spread and commissions are included in calculations Safe Trading -  Protect orders before big news spikes and Monday opening gaps
    FREE
    Everything for chart Technical Analysis in one tool Draw your supply demand zone with rectangle and support resistance with trendline and get alerts to mobile phone or email alert Video tutorials and manuals   here .  Find contacts on my   profile . FREE version works for CHFJPY and AUDCAD 1.   Extended rectangles and trendlines Object will be extended to the right edge of the chart when price will draw new candles on chart. This is rectangle extender or trendline extender. 2. Price touch a
    FREE
    This tool will remove buttons and text labels from the chart, after you remove Trading box Order management or Trading box Technical analysis . You just need to drag this tool to your chart and after cleanup of objects is finished, the tool will remove itself from the chart. Please check images below that present Before and After using the Removal tool. There is also a short YouTube video at the bottom to show how easy it is to clean your chart after using Trading box tools. - input var
    FREE
    This tool will remove buttons and text labels from the chart, after you remove Trading box Order management or Trading box Technical analysis. You just need to drag this tool to your chart and after cleanup of objects is finished, the tool will remove itself from the chart. Please check images below that present Before and After using the Removal tool. There is also a short YouTube video at the bottom to show how easy it is to clean your chart after using Trading box tools. - input variable "
    FREE
    필터:
    dip_
    35
    dip_ 2023.05.11 16:45 
     

    Trading Box technical Analysis is an amazing product! It allows really fast chart annotation and greatly facilitates chart navigation. It practically turns Mt4/5 into TradingView! Here are my favourite functions: The “Scale” function allows you to navigate charts at a set scale. The “@“ function allows you to locate specific areas on the chart (from high timeframes to low timeframes) The “Sync” function allows you to sync your chart annotations on multiple charts. Since the last update, you can very quickly annotate the Open, Close, Low, High and Candle Bodies (Supply or Demand) with simple keyboard shortcuts! I am very happy that I purchased Trading Box Technical Analysis, my charts look great and my analysis is greatly accelerated. One last thing, Igor, the creator of Trading Box Technical Analysis is amazing and very helpful, he answers emails and offers regular updates. In my opinion, Trading Box Technical Analysis is a MUST HAVE if you use Mt4 or Mt5.

    18104
    297
    18104 2023.04.18 12:49 
     

    Great indicator, but I would like it to also be able to synchronize the Fibonacci retracement.

    ako to
    70
    ako to 2023.01.08 14:32 
     

    I TRIED IT. One of the best tools I used. it made things much easier. must give it a try. it's all you need in your trading.

    RNP
    44
    RNP 2022.10.10 03:52 
     

    Truly the closest MT4/5 indicator you can have to match the features of TradingView. With alerts, ability to sync between charts, label and much more, Igor (the developer) continues to expand the features with time. He is also very responsive to questions and has an extensive website that explains in detail all the features. Great indicator from a great developer.

    netguru007
    31
    netguru007 2022.08.25 06:49 
     

    Trading Box Technical Analysis tool is one of the most comprehensive tool available on MetaTrader. I have been using it for a month now and been totally loving all its features. Its an ultimate tool if you are price action trader/Supply and demand trader or a SMC based trader. The alerts & recurring alerts and the Sync option for MTF analysis are some of my favorite functionalities of this tool. Great one time investment for setting up alerts for your charts & MTF analysis and a much cheaper alternative for Tradingview for which you would end up paying close to $300 annually (black friday offer else double the price at $600) for 400 alerts

    Timothy Charlton
    75
    Timothy Charlton 2022.08.17 18:01 
     

    This is a very good tool. Everything you need for trading S/D, really good customer service aswell

    Martin Tuke
    245
    Martin Tuke 2022.07.10 21:19 
     

    Great tool, would not be without it now.

    goncalo009
    135
    goncalo009 2022.04.26 23:39 
     

    Hi guys. Really love this indicator. Everything you need on one click. The only thing i think you need add it's auto split rectangle. If i pick rect from color pick will become already split. If this happen i will give you 10 stars

    Retroool
    38
    Retroool 2022.04.26 02:00 
     

    Great indicator, great functionality, ease of access, chart simplicity, supportive creator, etc... What more could one ask? But really, if you are looking to make your charting faster and more efficient, look no further. Just try the demo! (I mean, REALLY test it out), you'll be hooked:)

    fxcommentary
    1877
    fxcommentary 2022.04.12 02:26 
     

    For people using lines/rectangles to alert them - a very good tool. Its main advantage is - it is user friendly to operate. It is highly probable you will be able to incorporate this tool in your routines and it then indeed makes description of your routine faster. Good job, thank you.

    UPDATE: 21.05.2022

    this tool has few exceptional features which are not manifested clearly.

    One of them is the ability to cut support/resistanve line at the point of its breaking by a candle. Example - if you find at 1:05 that the support is broken, and you will cut the support line at 1:07, than your supoort line will no longer extend to the last bar. after 1:07. Your chart on the right is clean and on the left you still have got history of breaking the line. Of course you can do it manually but this tool makes it as easy as possible. This feature alone is worth at least 1/3 or rather 1/2 of the price of the this great tool if you wanted it created to you by any developer. And this is just a tiny little feature, one of many. The cutting is made with [>>>] button.

    azim61
    44
    azim61 2022.03.28 01:55 
     

    This indicator saves my time doing analysis on the chart and be more efficient. Thanks Igor for creating this indicator!

    Devonish
    2614
    Devonish 2022.02.08 11:46 
     

    Very happy with this product. I have my own method of identifying S&R, using this tool is very helpful.

    CasiousD
    779
    CasiousD 2021.12.02 19:04 
     

    Absolutely amazing tool. I was only interested for one function that I couldn't find implemented in a good way in any other indicator. Once I started using it, I realized all the other great functionality that is available, and now this has replaced the job of 4, yes FOUR other indicators I no longer need because of this. Makes my charts cleaner and less cluttered, and I am much, much more efficient and effective with my analysis and decision making. It may seem a bit daunting, but it's so simple to learn and use, and you can quickly find use for things that you didn't even realize you needed. Also love that it has a check for compatibilty, or rather incompatibility with other indicators...I'm not sure how it works because I don't have many other indicators on my chart anymore since I started using this, so I haven't run into any conflicts. But I'm sure there is a video or documentation that explains it somewhere among the many instructional videos provided by the author, which is an absolute plus! Finally, author is very responsive and helpful! Thank you Igor!

    nk79
    338
    nk79 2021.11.15 19:03 
     

    If you wanne bring your analysis to the MT4 plattform with alerts and charting thats the tool for it.

    Atari
    31
    Atari 2021.10.15 06:28 
     

    The Trading Box Technical Analysis indicator is by far the BEST tool for Price Action, Supply /Demand, Support/ Resistance, and RTM / RTM Academy Trading Methodology or a style similar to it. It practically has all the functionality you will ever need and much much more if you are trading any of the above mentioned methodologies. I am so glad that I was able to discover this indicator. It is truly a remarkable, time saver, and most efficient tool for marking up your charts and creating alarms and alerts when your parameters are met. Using this tool will help you focus on your trading... I can't imagine trading without it. Additionally, Igor, the programmer, is constantly looking for ways to improve and update this tool to make it even better. Recently he added a dashboard that is simple genius on his part to track all the pairs/market you are trading and gives you a insight to where price is in relations to your marked up zones or levels. I highly recommend this tool for anyone who is serious about trading and don't want to waste time. Once you've experienced it for the first time, you will likely drop your other indicators. Thank you so much Igor!!!

    earlyretirement
    309
    earlyretirement 2021.10.08 18:03 
     

    Trading Box Technical Analysis Tool Short Version Product Quality - 5 Stars Service - 5 Stars Innovation - 5 Stars Education - 5 Stars Ease of Use - 5 Stars Longer Version I found this excellent product quite by accident. While it is meant as a utility (which it most certainly is) the coder has taken the time to outline not only the features of the tool but also some strategies for its use. There are a number of short 'training' videos that fully explain its working. That said, when I had questions (before purchase) Igor was prompt and most helpful in his response. I have already received a number of updates which indicates to me the seller is continually improving this product. On a side note, once serious traders master this tool, using the Trading Box Order Management Tool is a natural progression.

    khiem nguyen
    39
    khiem nguyen 2021.09.15 11:26 
     

    Please check your email. I have sent an email to you. Thanks

    ambho
    69
    ambho 2021.08.11 21:02 
     

    This is a fantastic tool. Literally everything you need

    Aguss Mahardikaa
    34
    Aguss Mahardikaa 2021.08.07 03:44 
     

    Very nice :)

    Henry Arifin
    384
    Henry Arifin 2021.07.12 06:16 
     

    The best products are authors who listeners to customer needs and help them improve the product to their needs. This is one. Extremely Satisfied

    12
    리뷰 답변
    버전 9.88 2023.05.28
    - NEW trendline button "Retest" used for breakout and retest strategy. Breakout Retest function triggers an alert if the candle closes beyond trendline and then price touches trendline for retest in trading.
    VIDEO: https://www.youtube.com/watch?v=A_JOXfpo2Eg
    버전 9.87 2023.05.27
    - NEW trendline button "Retest" used for breakout and retest strategy. Breakout Retest function triggers an alert if the candle closes beyond trendline and then price touches trendline for retest in trading.
    VIDEO: https://www.youtube.com/watch?v=A_JOXfpo2Eg
    버전 9.85 2023.05.24
    - Fibonacci retracement indicator Multi chart SYNC
    VIDEO: https://www.youtube.com/watch?v=QgvL1lcOigY

    - NEW input "Show hotkeys S,D,H,L,O,C"
    버전 9.84 2023.05.24
    - Fibonacci retracement indicator Multi chart SYNC
    VIDEO: https://www.youtube.com/watch?v=QgvL1lcOigY
    버전 9.83 2023.05.19
    - input variable "TimeFrame colors for created Rectangle, Trend, HLine, VLine" will change color only for objects created with Trading box Technical analysis indicator
    버전 9.82 2023.05.12
    - NEW input variables:
    Extended trendline width - Hotkeys High, Low
    Extended trendline width - Hotkeys Open, Close
    버전 9.81 2023.05.06
    - Separate TimeFrame colors for created Rectangles and Lines(Trend, Horizontal, Vertical)
    버전 9.8 2023.05.05
    Hotkeys for drawing Support Resistance levels and Supply Demand zones
    Last clicked candle Hotkeys:
    S - Supply
    D - Demand
    H - High
    L - Low
    O - Open
    C - Close

    VIDEO: https://www.youtube.com/watch?v=DAldGe6hO24
    버전 9.7 2023.05.01
    - NEW input "Use TimeFrame colors for new created objects" and color selection for each standard timeframe
    VIDEO: https://www.youtube.com/watch?v=OFLsZOWXDhM

    - NEW button "Click SD" with ON//OFF logic for extended rectangle creation when user click on candle. Zone is based on candle High and Low price
    VIDEO: https://www.youtube.com/watch?v=nPRR-_yHfCg

    - Horizontal line "<< Break line" button display optimization for faster history search
    VIDEO: https://www.youtube.com/watch?v=ZxxxSy5bwMc
    버전 9.6 2023.04.09
    - button display optimization for non extended rectangles and trendlines
    버전 9.5 2023.04.01
    - bug fix for hiding buttons on selected rectangle when using "Rectangle position changer" indicator on same chart

    - input "Extended object text position" replaced by 2 NEW inputs: "Extended rectangle name position" and "Extended trendline name position"
    버전 9.4 2023.02.08
    - NEW option "Shift to rectangle & trendline engulf" for input variable "Rectangle << button function"
    - NEW input "Button text color"
    버전 9.3 2023.02.05
    - NEW input variable "Rectangle << button function" with option "Shift to rectangle engulf"
    VIDEO: https://www.youtube.com/watch?v=tyAEXGoAyYE
    버전 9.2 2023.01.15
    - Vertical Line added to Chart SYNC function
    버전 9.1 2022.12.26
    - new input variable "Engulf alert un-fill rectangle"
    버전 9.0 2022.12.10
    - SYNC rectangle function now works with Rectangle position changer indicator
    버전 8.9 2022.11.19
    - rectangle and trendline alert buttons visible within chart when scrolling left
    버전 8.8 2022.11.07
    - bug fixed after renaming object
    버전 8.7 2022.11.05
    - CPU usage reduced and chart freeze bug fixed
    버전 8.6 2022.11.03
    - performance upgrade that will lower CPU usage on MetaTrader terminal
    버전 8.4 2022.10.07
    - NEW option "Right outside" for input variable "Extended object text position"
    버전 8.3 2022.10.02
    - NEW input variable "Show 5 additional rename buttons"
    버전 8.2 2022.09.26
    - NEW input "Empty rectangle width"

    VIDEO: https://www.youtube.com/watch?v=P8eME8csQZY
    버전 8.1 2022.09.17
    - new input variable "Extended object text position" with options (Right, Left)
    버전 8.0 2022.09.15
    - new Split % button for rectangles to show premium or discount price like Fibonacci retracement
    - Bands button added for non-extended rectangles

    VIDEO: https://www.youtube.com/watch?v=VNPYUSUUdaA
    버전 7.9 2022.09.12
    - object extension bug fix when MetaTrader opens
    버전 7.8 2022.09.09
    - NEW inputs added:
    Unfilled extended rectangle style
    Unfilled extended rectangle width

    - 4 NEW color buttons for filled and empty rectangles
    버전 7.7 2022.09.02
    - bug fix for Rename button and Timeframe visibility
    버전 7.6 2022.08.21
    - new input variable "Chart, alerts and drawings refresh speed"
    버전 7.5 2022.08.12
    - new button "Hide text" that hides all texts and alerts on chart
    - "Rename" button now works with SYNC
    - Text position is copied when SYNC button is used for non-extended rectangle or trendline
    버전 7.4 2022.08.04
    - "Bands" rectangle function upgraded with (Upper) and (Lower) tag for rectangle Upper and Lower edge
    버전 7.3 2022.08.03
    - Rename button added for extended rectangle and trendline
    버전 7.1 2022.08.01
    - bug fix for "Trend" and "Hline" button with input variable "TF visibility for newly created rectangle & trendline"
    버전 7.0 2022.07.30
    NEW button Rename gives option to rename the zones from the suggested list

    VIDEO: https://www.youtube.com/watch?v=-_5njoa0etk
    버전 6.7 2022.05.28
    - update to sync with TBOM tool new functions
    See the new function added to Trading box Order management that allow automation price action within a trading scale:
    VIDEO: https://www.youtube.com/watch?v=Mdw211-Y9b0
    버전 6.6 2022.05.09
    - performance upgrade
    버전 6.4 2022.04.28
    - NEW button "Trend" and "HLine" that will create trendline and horizontal line in the middle of the chart

    - NEW input variables:
    Show Trend and HLine button (object create)
    Create trendline color - Trend button
    Create trendline style - Trend button
    Create trendline width - Trend button
    Create horizontal line color - HLine button
    Create horizontal line style - HLine button
    Create horizontal line width - HLine button

    Upgrade VIDEO: https://www.youtube.com/watch?v=ScEICIIEEKI
    버전 6.2 2022.04.09
    - bug fix and recompile for new Metatrader terminal version
    버전 6.1 2022.01.30
    - NEW input variable "Show Filled color buttons"

    - NEW History button that will show the time of last alert in the label. This information is transferred to Technical analysis dashboard where you can see last alerts of all charts in one list

    ***UPGRADE VIDEO: https://www.youtube.com/watch?v=LsTozwEajpk
    버전 6.0 2022.01.02
    - NEW input variable "Candle close alert settings" with 2 options:
    1. Current chart TF alert
    2. Alert in TF when Close is clicked
    버전 5.9 2021.12.23
    - compliance upgrade for the NEW tool "Rectangle position changer"

    Download: https://www.mql5.com/en/market/product/75865

    VIDEO: https://www.youtube.com/watch?v=IYW1dgOWwRg
    버전 5.8 2021.12.06
    - bug fix for input variable "TF visibility for newly created rectangle & trendline" when rectangle is created with click on color button
    버전 5.7 2021.11.28
    - Color button rectangle creation improved, after extended color will stay the same
    버전 5.6 2021.11.27
    - bug fix for creating rectangles with color buttons when market is closed
    버전 5.5 2021.11.27
    - CPU usage reduced that will allow more charts with TBTA in MetaTrader terminal
    버전 5.4 2021.11.16
    - bug fix for non extended rectangle Risk Reward tool
    - bug fix when rectangle name is changed and Split function is ON
    - CPU performance improvement when using TBTA on multiple charts
    버전 5.3 2021.11.01
    - risk reward tool for non-extended rectangles
    - adding more texts positions (object names) to rectangle and trendline. With button "X" you remove current text
    - if no object is selected then color buttons will create a new rectangle, otherwise the selected object color will be changed

    - NEW "Split" button added that will split extended rectangle with alert trendline (default 50% rectangle size)
    - NEW input "Default rectangle split % (0-100)"
    - NEW input "Split line color"
    - NEW input "Split line style"
    버전 5.2 2021.10.22
    - selecting object bug fixed
    버전 5.1 2021.10.07
    - upgrade for link with new BACK button on Dashboard tool
    버전 5.0 2021.10.07
    - NEW "D" button is added that will show chart with "Technical analysis Dashboard" tool

    FREE Dashboard: https://www.mql5.com/en/market/product/72876

    VIDEO: https://www.youtube.com/watch?v=qzC9jpNshw4
    버전 4.8 2021.08.29
    - SYNC button will copy Bands function (if enabled) from Master to Slave rectangle

    - SYNC function in combination with LTF, MTF, HTF buttons will copy timeframe visibility from Master to Slave object when LTF, MTF, HTF button will be assigned to Master object

    - bug fix for SYNC function with combination of input "Visibility for current and lower timeframes"
    버전 4.7 2021.08.22
    - NEW "Bands" button will create top and bottom rectangle lines visible on all TF but filled rectangle will be visible only on current TF. This will help you to see HTF levels on lower timeframes.
    Rectangle top and bottom lines will be dashed for higher timeframes and solid for lower timerames.
    When you disable "Bands" button it will restore rectangle TF visibility.

    - NEW "Scale" button that will switch chart to "Fixed scale mode" that gives you option to move freely around the chart vertical and horizontal. It also gives you opportunity to get feeling for price movements

    VIDEO: https://www.youtube.com/watch?v=OwfjWmBzPG8
    버전 4.6 2021.08.01
    - improved performance between Trading box tools (Order management, Technical analysis, Rectangle extender, Order box Dashboard)
    버전 4.5 2021.08.01
    - bug fix for "X" button display when TBTA is loaded on new chart
    - extended rectangle and trendline buttons display correction for high resolution displays
    버전 4.3 2021.07.31
    - bug fix for chart clean up after indicator is removed
    버전 4.2 2021.07.29
    - removed input variable "Set larger button text"

    - NEW input variable "Button font size"
    - NEW input variable "Button size scale


    - NEW input "TF visibility for newly created rectangle & trendline"
    1. No automatic timeframe visibility
    2. Visibility for current and lower timeframes

    - SYNC button bug solved: Timeframe visibility was not copied from Master to Slave at object creation
    버전 4.1 2021.07.20
    - NEW input variable "Show pip distance in brackets"

    - button click lagging solved
    버전 4.0 2021.07.17
    - bug fix when Trading box Order management and Technical analysis are used on the same chart
    버전 3.9 2021.07.10
    - NEW input variable "Extended trendline width"
    - NEW input variable "Compression line width"
    - NEW input variable "Ray trendline width"
    버전 3.8 2021.07.07
    - larger color and line width buttons when input variable "Set larger button text" is set to TRUE
    버전 3.7 2021.07.06
    - NEW input variable "Set larger button text" that will create a little bigger buttons and font size +2
    - NEW input variable "Flat trendline width"
    - NEW input variable "Line width button 1"
    - NEW input variable "Line width button 2"
    버전 3.5 2021.06.20
    - NEW input variable "Bring Alerted chart to the top"

    - NEW input variable "Extend new created rectangle"
    - NEW input variable "Extend new created trendline"
    버전 3.4 2021.05.25
    - bug fix for button display
    버전 3.3 2021.05.16
    - NEW "Text" button that gives options to display rectangle or trendline text in all possible spots around or inside object. This works for non-extended rectangles and trendlines where we would like to have object name displayed in suitable place around or inside object. This is custom show object name function.

    - NEW "SYNC" button (sync chart object or chart sync object) function for selected rectangle, trendline and horizontal line object chart synchronization on the same symbol (charts synchronizer, object sync)
    The selected master object is copied to other charts of the same symbol.
    Object position location and color style is updated from master to slave object and vice versa.
    When you delete master object then slave objects will be deleted and NOT vice versa.
    If you rename master object then you broke connection with slave objects. If you rename slave object then is no longer synced with master object.
    "SYNC" button can also remove synchronization from selected master or slave object.

    - NEW input "Show extra color buttons" that will display 6 "Filled" color and 6 "Empty" color buttons

    - Bug fix: if you click on tickness buton "1" or "2", it will change object from filled to unfilled

    - Safety check warning for too many objects on chart (performance issues) + warning for incompatible indicators

    UPGRADE VIDEO: https://www.youtube.com/watch?v=asGmONlI4EY
    버전 3.2 2021.03.27
    - better sync with Trading box Order management v3.0 objects
    버전 3.1 2021.03.01
    New input variables added and used when you extend rectangle or trendline:
    - Alert enabled by default
    - Engulf enabled by default
    - Close enabled by default
    - No text enabled by default
    버전 2.9 2021.02.17
    - bug fix reported by users
    버전 2.8 2021.02.04
    - bug fix for full zoom chart label positions
    버전 2.7 2021.02.01
    - input variables description added

    - new input variables:
    - Selected object buttons position
    - Rectangle pip size position
    버전 2.6 2021.01.16
    - switching between timeframes bug solved
    버전 2.5 2020.12.27
    Important MAJOR performance upgrade and bug fix:
    - CPU load problems solved (better chart and object refresh logic)
    - Ignoring Trading box Order management objects
    - All user bug reports solved
    - Works better with other indicators
    버전 2.4 2020.12.09
    MAJOR UPGRADE:
    - added email alert option
    - added 3 new variables to manage alerts and notifications (send_mobile_push_notification, send_email_alert, show_popup_alert)
    - optimized chart refresh rate that will reduce CPU load from 30% up to 500%
    - minor bugs solved and added some additional safe checkups for drawing rectangles and trendlines
    버전 2.3 2020.11.06
    - minor bug fix for >> button when used on rectangle
    버전 2.2 2020.11.02
    - another bug solved when clicking << button
    버전 2.1 2020.11.02
    - bug fix for << button and when rename trendline
    버전 2.0 2020.10.30
    - added new input variable extend_if_auto_scroll_off that will give you option to have fixed extended object size if you have auto scroll option diabled
    버전 1.9 2020.10.29
    - minor bug fixed when Auto scroll is OFF. Objects are extended to the right side of the chart
    버전 1.8 2020.10.14
    - bug fix for Close button, when used on chart with no previusly loaded data on new switched timeframe
    버전 1.7 2020.10.04
    - minor bug fix for alert arrows timeframe visibility
    버전 1.6 2020.10.03
    - minor bug fix for @ button when search for trendline origin history
    버전 1.5 2020.09.27
    MAJOR upgrade
    - new Flat button for trendline (creates horizontal flat trendline)
    - new Close button for rectangle, trendline and ray (alert when current candle closes beyond object price)
    - new R button to enable you repeat alert sound every few seconds (you can set repeat interval in seconds with sound_repeat_seconds_interval)
    - new input parameters for sound repeat alerts for supply, demand, resistance and support (The file must be located in terminal_directory\Sounds. Only WAV files are played)
    - when you click on extended rectangle it shows you Demand or Supply type of rectangle
    - if you extend rectangle around price then you have option to decide if this rectangle is supply or demand
    버전 1.4 2020.09.07
    - minor preformance upgrades
    버전 1.3 2020.08.12
    - new input parameter button_position is added for placing buttons in different corner positions
    버전 1.2 2020.08.08
    - button fix for Demand extended rectangle
    버전 1.1 2020.08.04
    - Rectangle and trendline function buttons are now aligned on right side of charts, so they not overlay with other trendlines and rectangles
    - Button positions corrections