• 概要
  • レビュー (38)
  • コメント (69)
  • 最新情報

Trading box Technical analysis

5

-25% discount ($149 -> $111)

Everything for chart Technical Analysis indicator mt4 in one tool

Draw your supply demand zone with rectangle and support resistance with trendline and get alerts to mobile phone or email alert - Risk reward indicator

Video tutorials, manuals, DEMO download hereFind contacts on my profile.


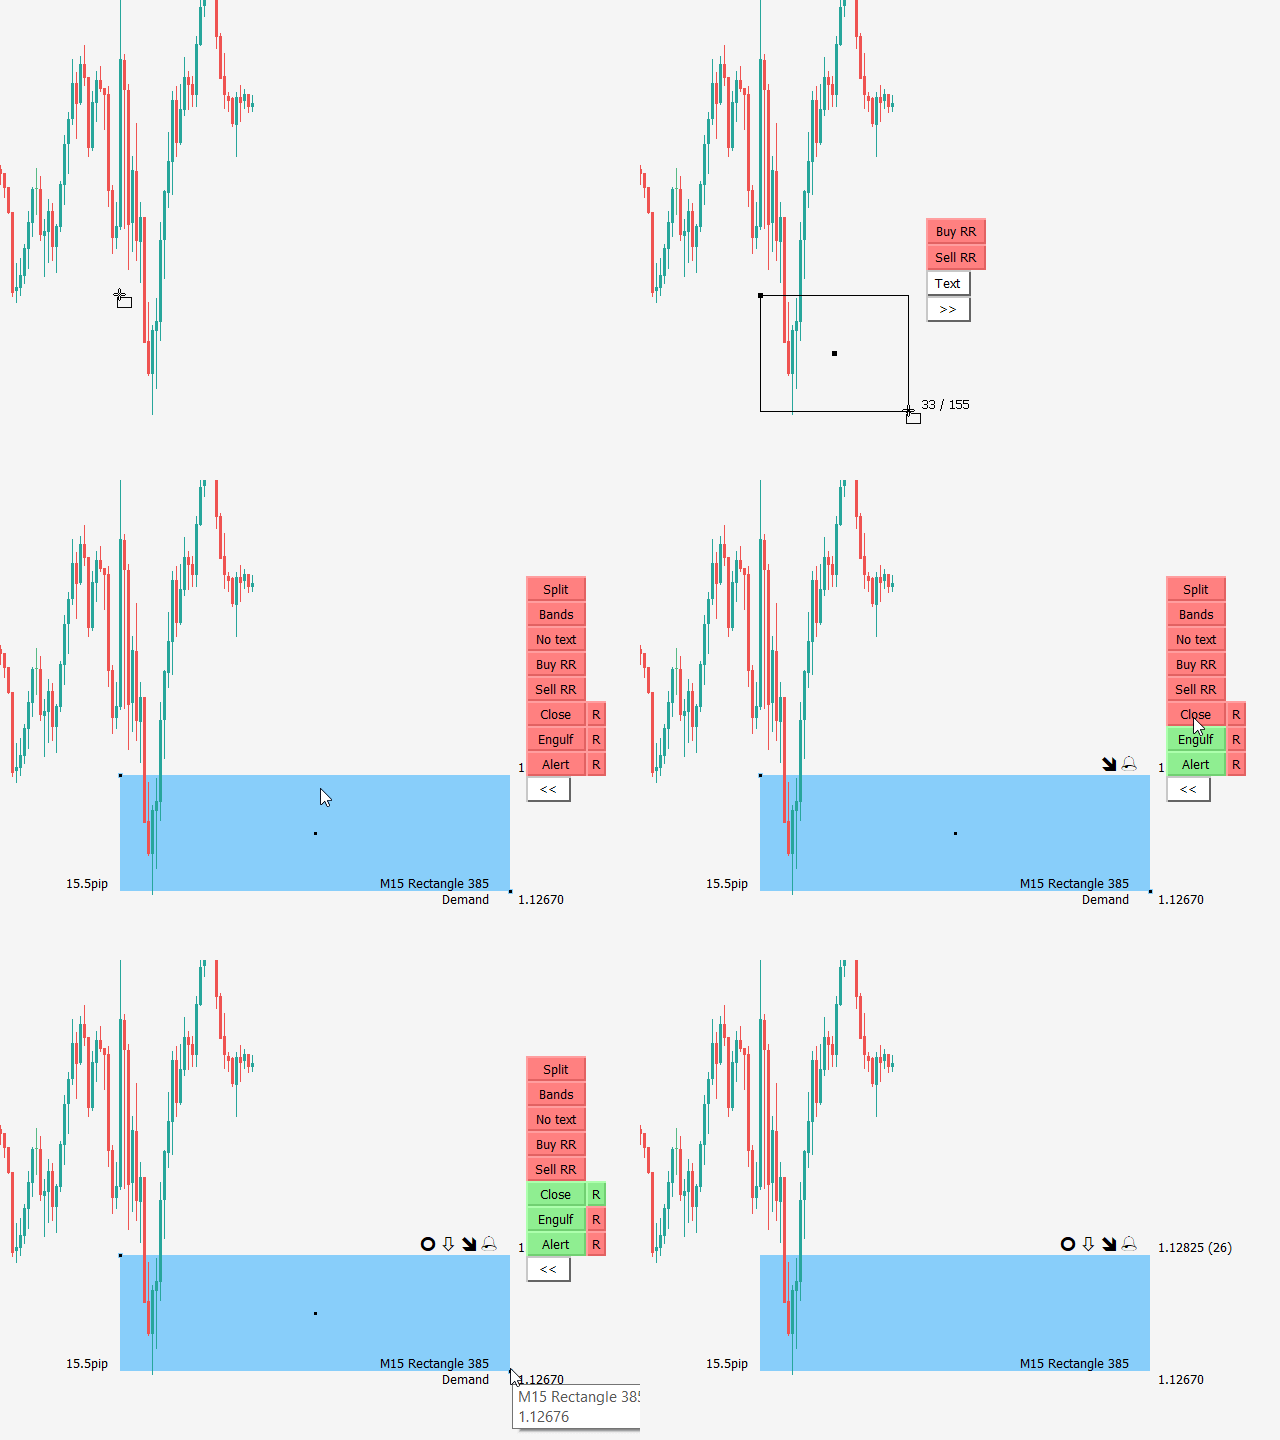
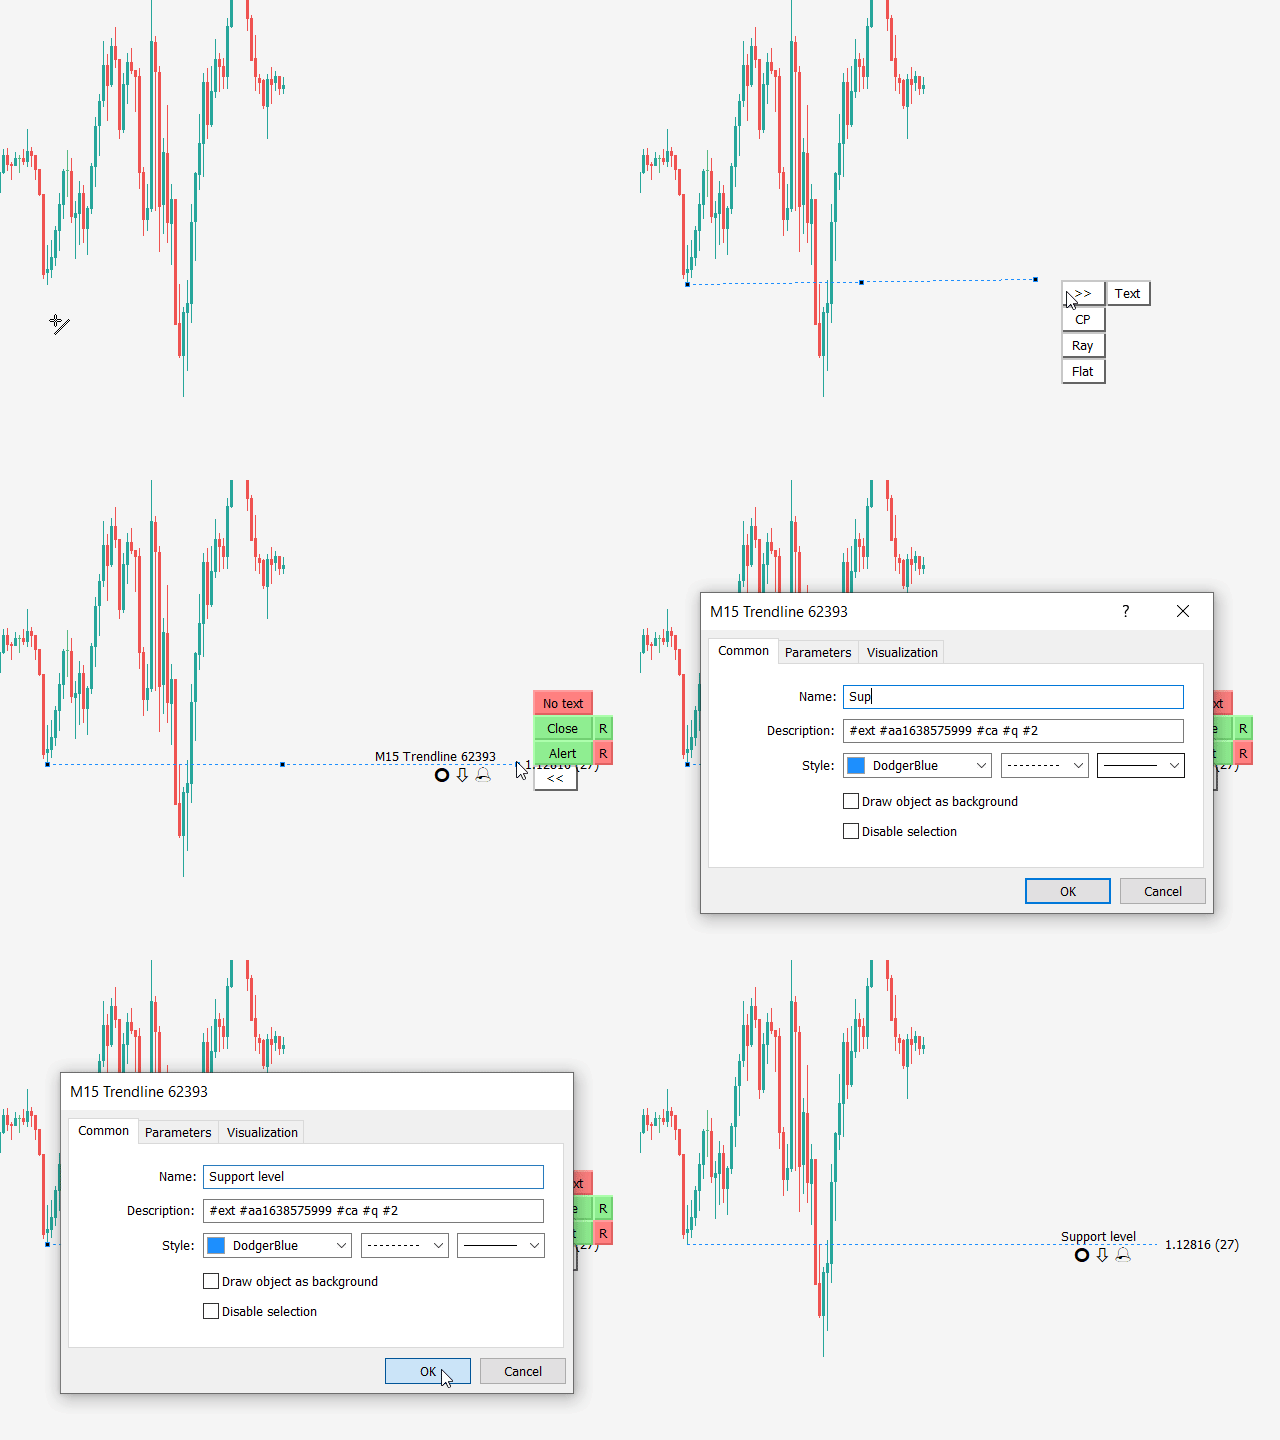
1. Extended rectangles and trendlines

Object will be extended to the right edge of the chart when price will draw new candles on chart. This is rectangle extender or trendline extender.

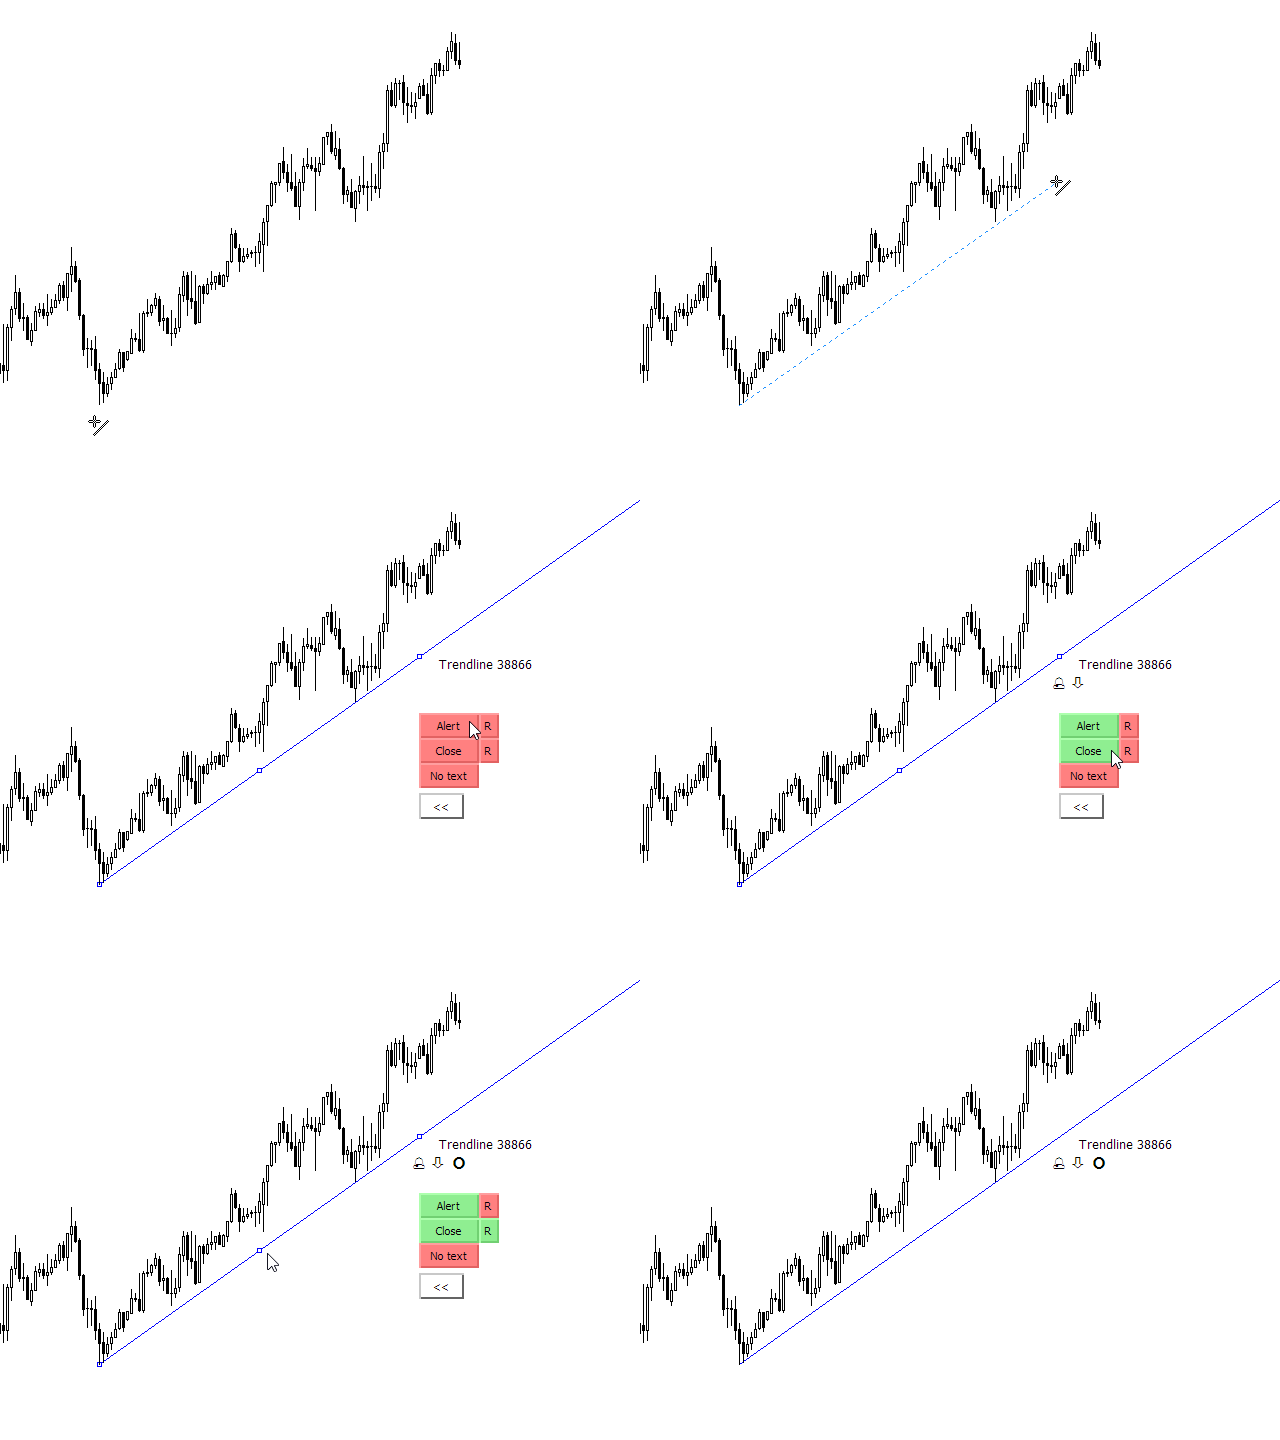
2. Price touch alert

  1. Alert will be triggered when price will touch extended rectangle or extended trendline
  2. Trendline alert is also available for rayed angled trendline
  3. Alerts can be sent to mobile push notification, email and MetaTrader popup alert

3. Engulf alert

Alert will be triggered when price will break rectangle supply demand zone

4. Candle Close alert
Alert will be triggered when candle will close outside of the rectangle or trendline
    5. Trendline Retest alert

    Button "Retest" is used for breakout and retest strategy. Breakout Retest triggers an alert if the candle closes beyond trendline and then price touches trendline for retest

    6. Sound repeat after Alert, Engulf, Close, Retest

    R button will enable you repeat alert sound every few seconds. Audible alert, text alert

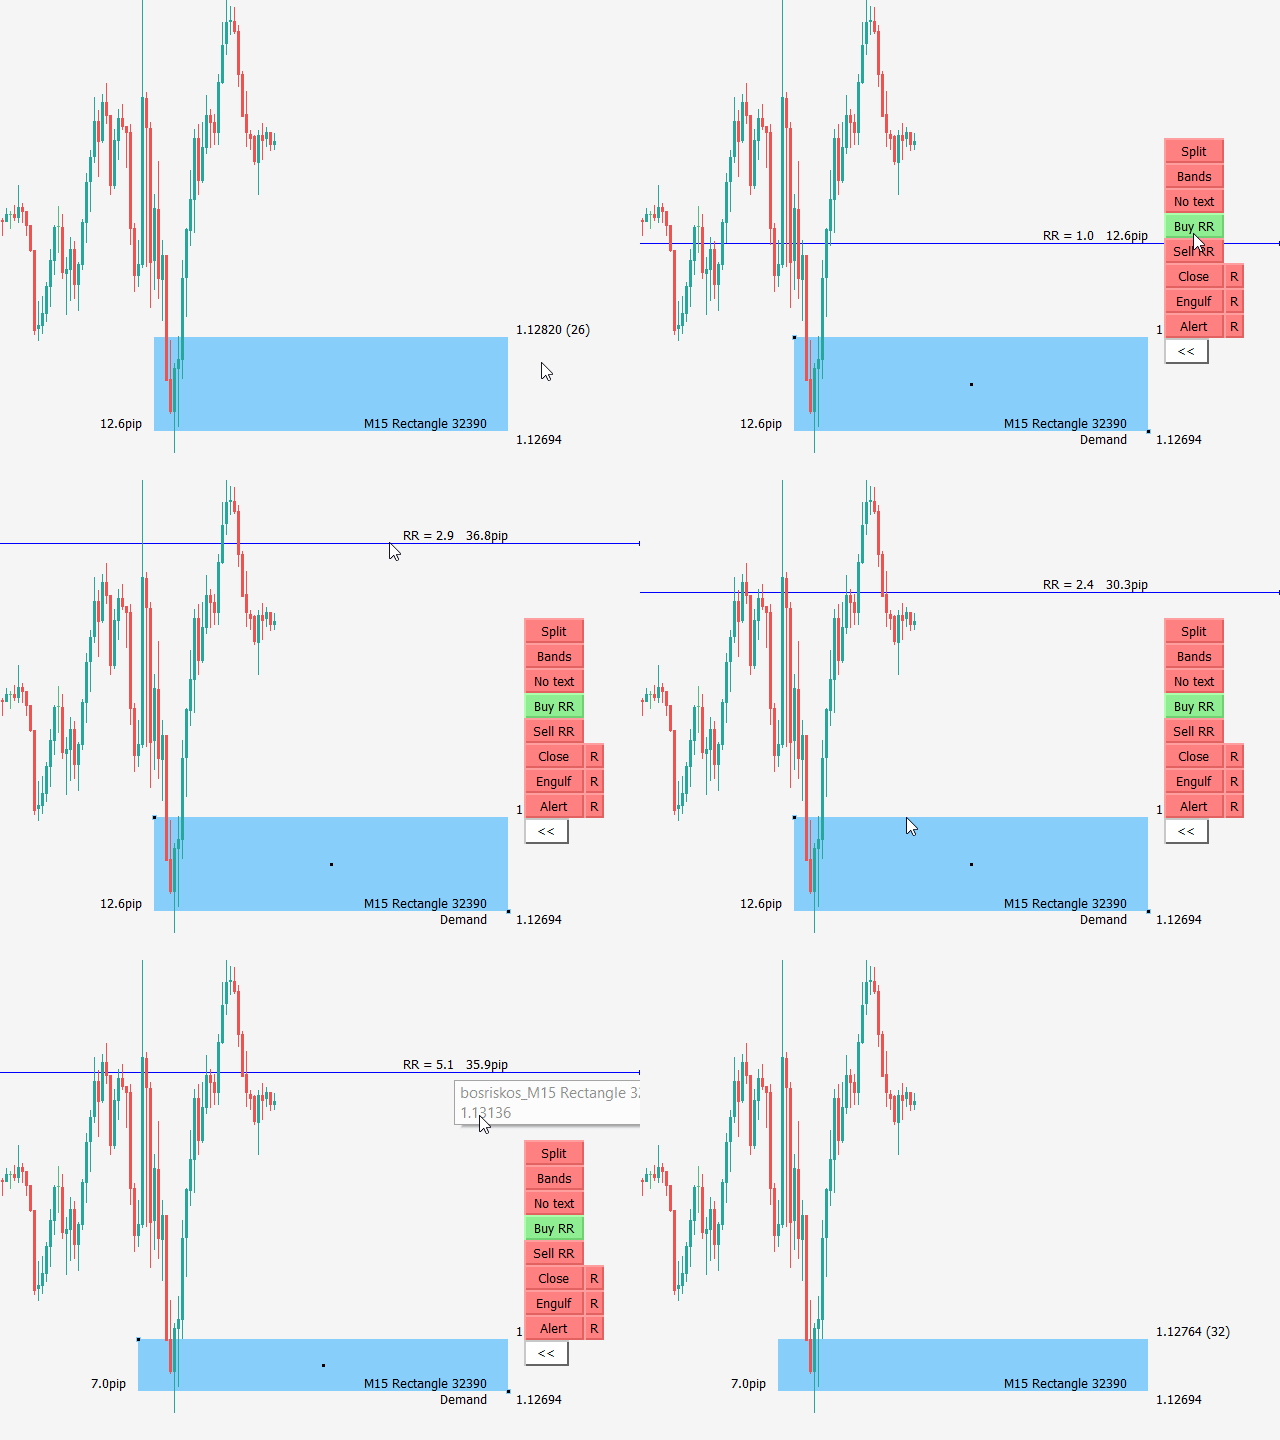
    7. Risk reward ratio calculation tool

    Risk reward ratio calculation for rectangles

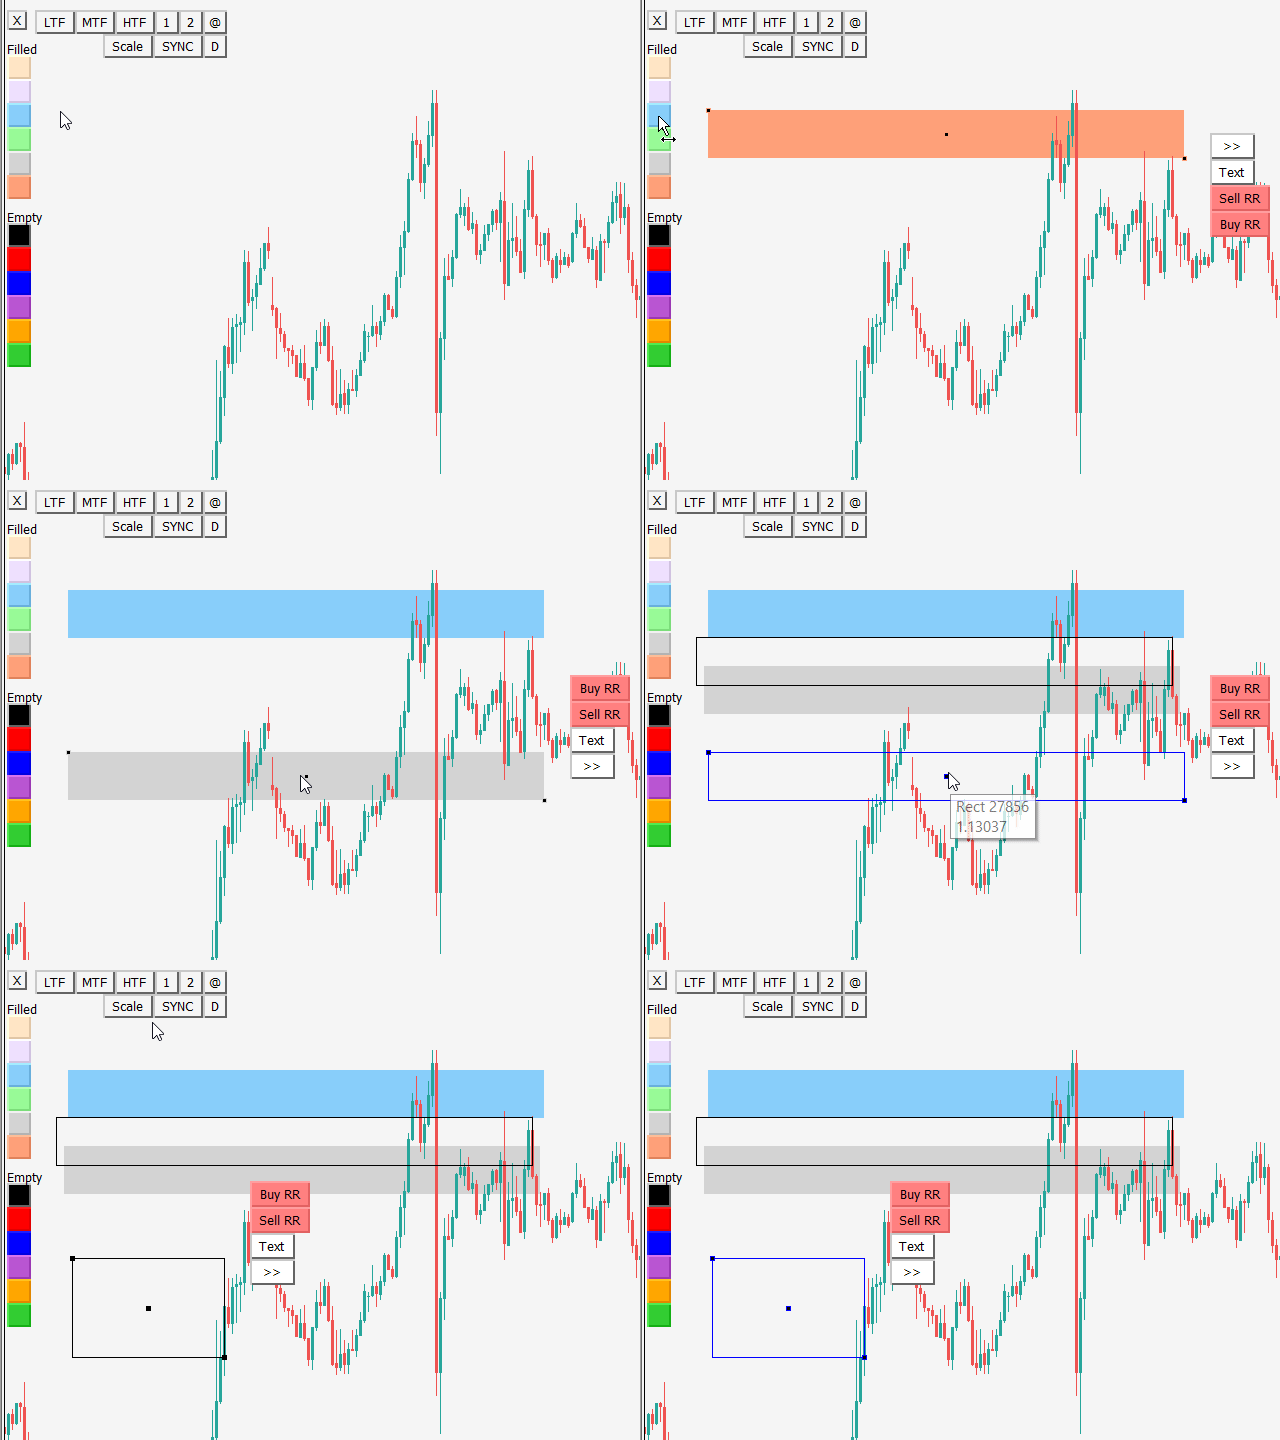
    8. Color change buttons

    Quickly change color for selected object with color button click. If no object is selected then color buttons will create a new rectangle

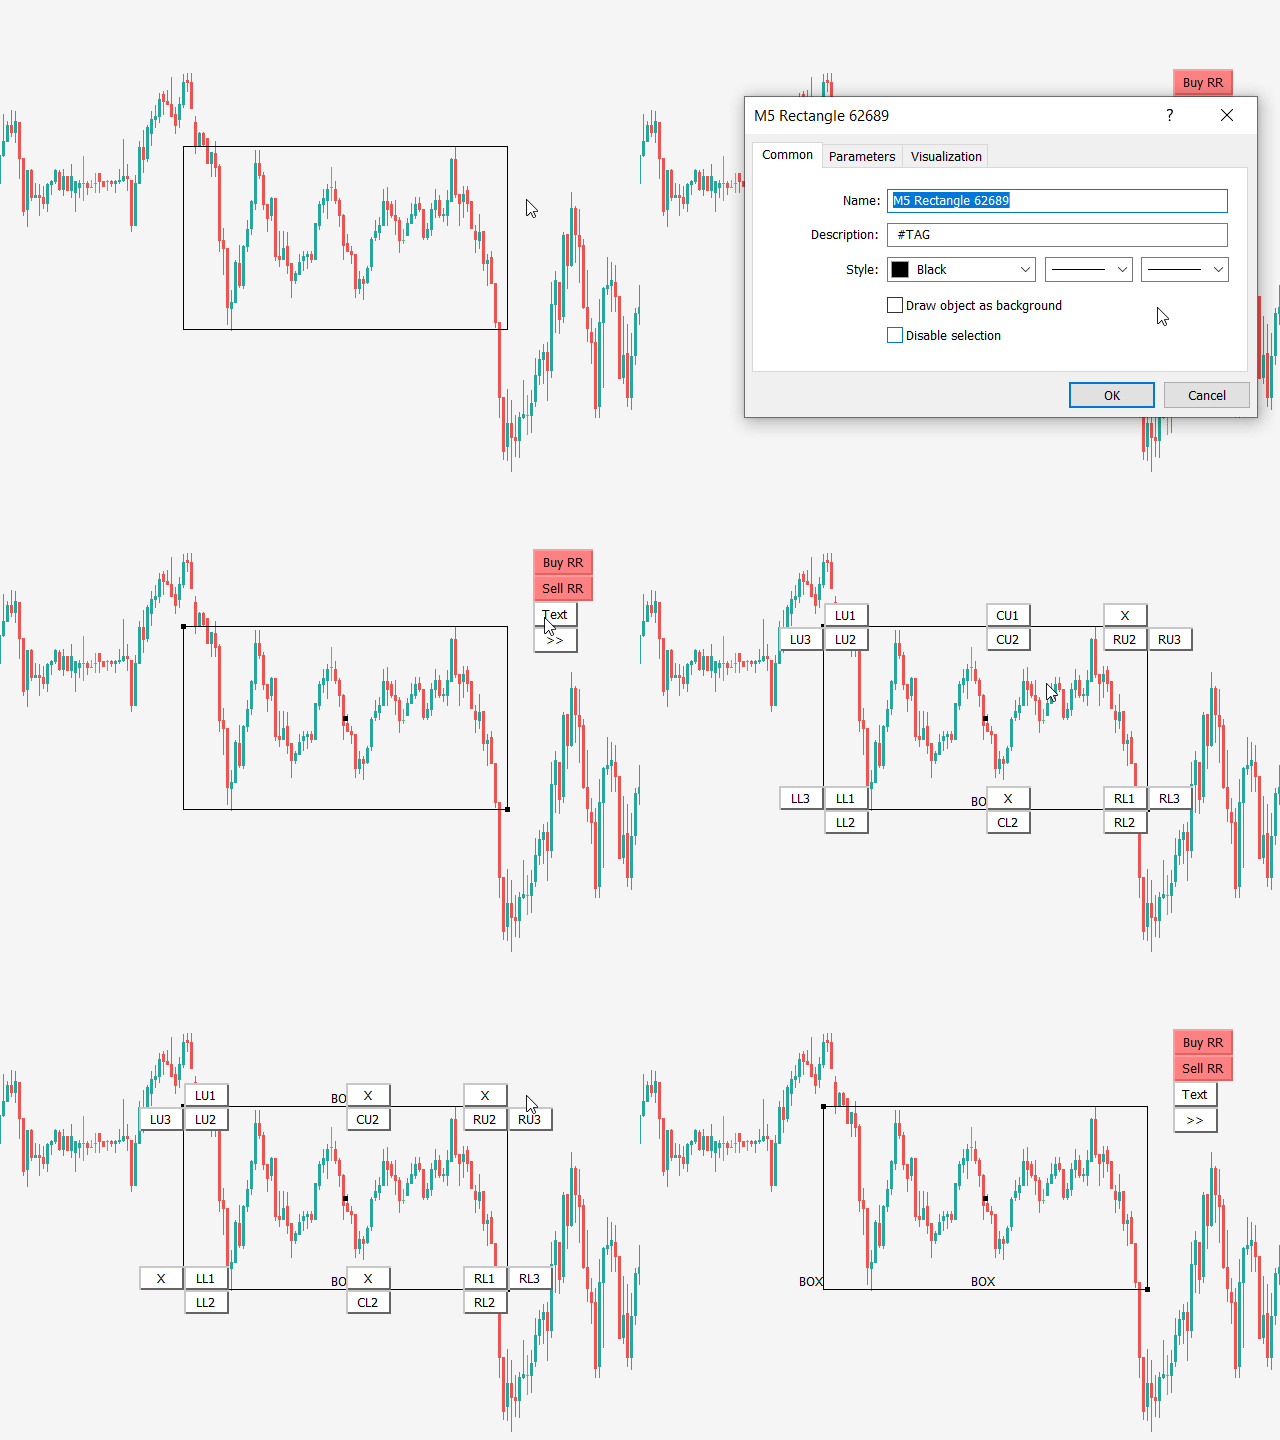
    9. Text button - object name text position

    Display rectangle or trendline text in all possible spots around or inside object. This works for non-extended rectangles and trendlines

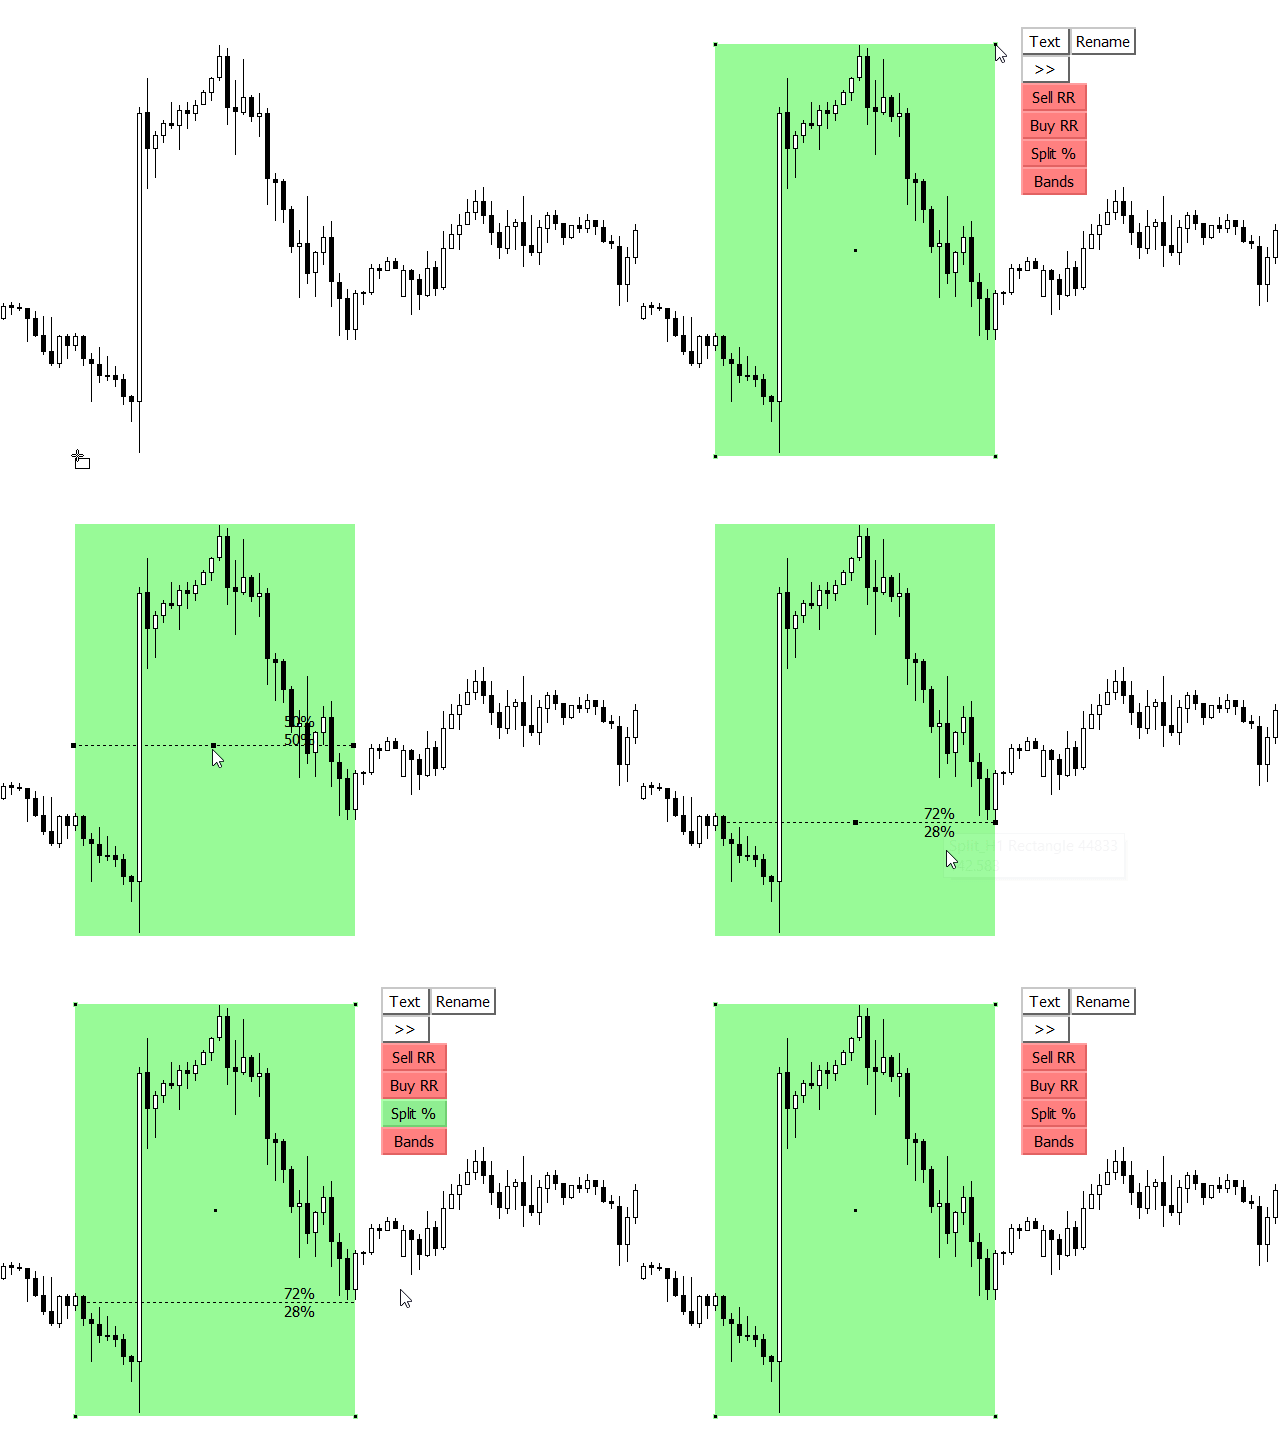
    10. Rectangle Split with % trendline

    Rectangle will be split with extended trendline by 50% of rectangle height. When you move split trendline, then % (percentage) will recalculate

    11. Rectangle Fibonacci retracement tool

    Non-extended rectangle have option to split by % and give option to see discount or premium price of the rectangle

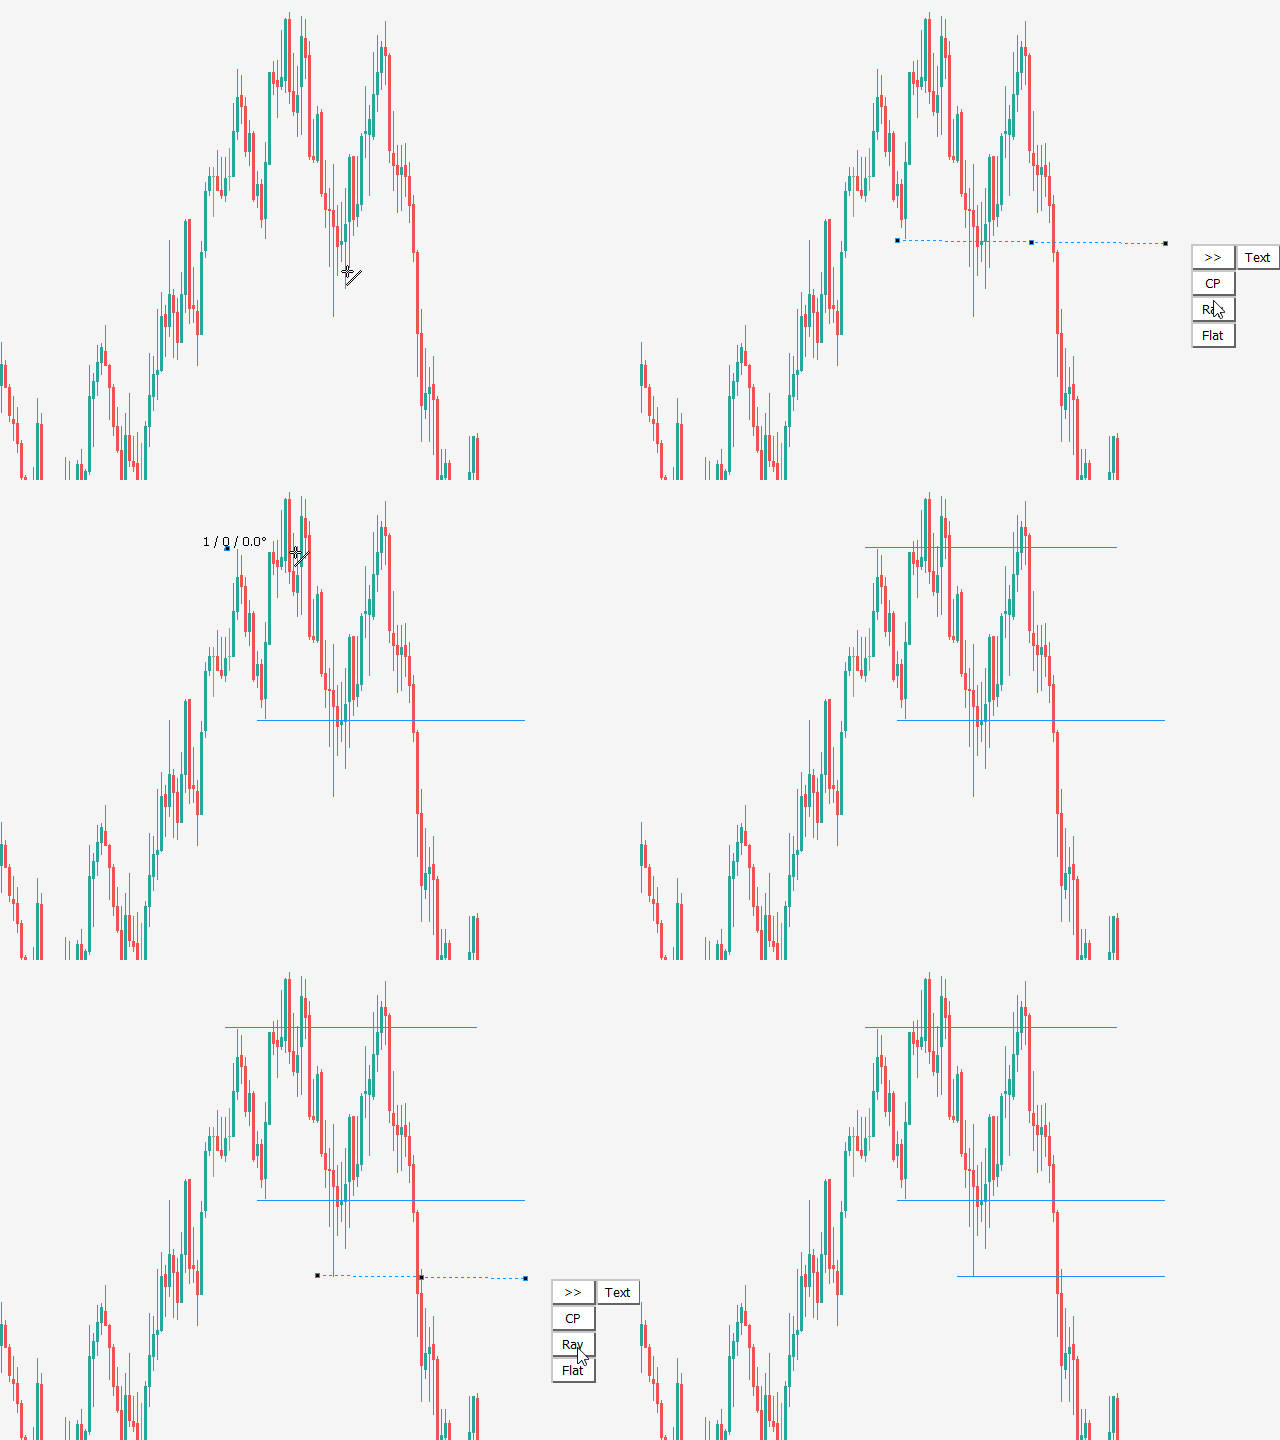
    12. Trendline compression tool and Flat trendline button

    Mark compression zone on the chart, like price action zone. If you click on Flat button then trendline will become horizontal flat

    13. Chart synchronization - chart sync object

    "SYNC" button function for rectangle, trendline, horizontal line, vertical line and Fibonacci retracement of the same symbol

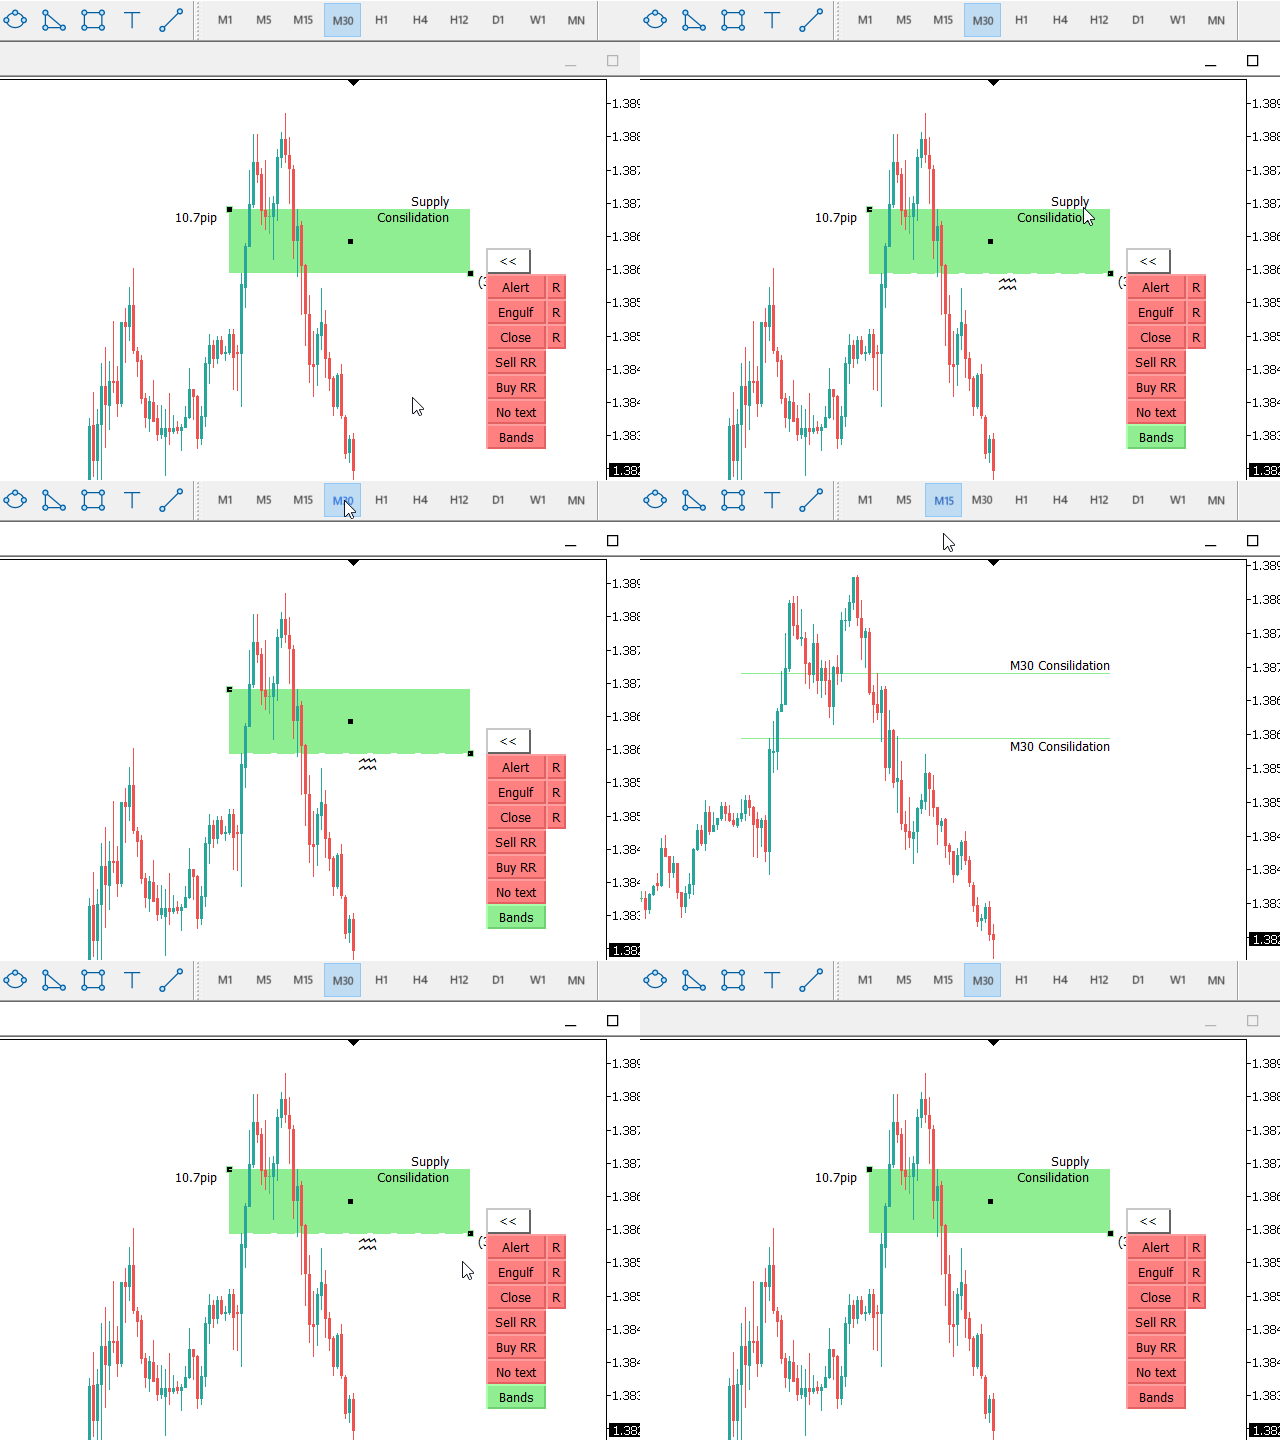
    14. Multiple timeframes analysis with nested zones  

    Bands button will create top and bottom rectangle lines visible on all TF but filled rectangle will be visible only on current TF. This will help you to see HTF levels on lower timeframes

    15. Auto scale TF visibility for newly created rectangle & trendline 

    This function will set timeframe visibility for current and lower timeframes. This will give bigger importance to objects on higher timeframes

    16. Object timeframe visibility buttons

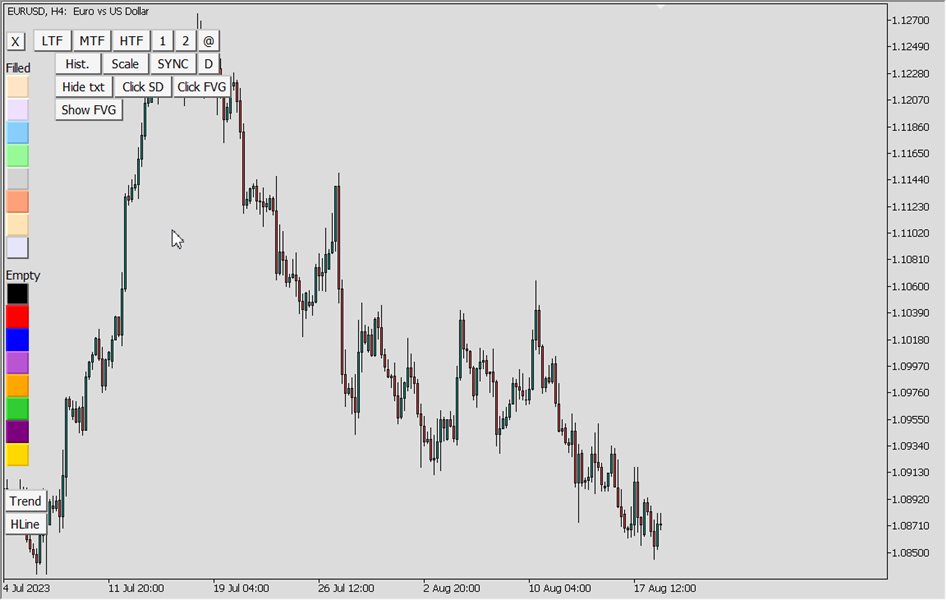
    Set object timeframe visibility with LTF, MTF and HTF buttons

    17. Navigate chart to Rectangle origin position focus

    Function that will show origin of selected rectangle in the middle of the chart when button @ is clicked

    18. Horizontal break line price

    Function will search first horizontal line break in chart history on the left

    19. Hist. button

    History button that will show the time of last alert in the label. Information is transferred to Technical analysis dashboard where you can see last alerts of all charts in one list

    20. Rename the rectangle and trendline from the suggested list

    Button Rename gives options to rename the rectangles and trendlines from the suggested list

    21. Time Frame colors for new created objects

    User can define special color for each standard time frame

    22. Candle click to create SD zone

    Button Click SD with ON//OFF logic for extended rectangle creation when user click on candle. Zone is based on candle High and Low price

    23. Fair Value Gaps (ICT FVG indicator)

    Button Click FVG with ON//OFF logic for extended rectangle creation when user click on Fair Value Gap zone candle

    24. Button to show ALL Fair Value Gaps

    Show all fair value gaps on chart with Show FVG button

    Input settings:

    • Show FVG - Search bars in history (0 = default)
    • Show FVG rectangle color - Untouched/Untested
    • Show FVG rectangle color - Touched/Tested

    25. Hotkeys for drawing Support Resistance levels and Supply Demand zones

    Last clicked candle Hotkeys for Support and Resistance levels (extended trendline):

    • H - High
    • L - Low
    • O - Open
    • C - Close

    Last clicked candle Hotkeys for Supply and Demand zones (extended rectangle):

    • S - Supply zone
    • D - Demand zone
    • F - Fair Value Gap


    レビュー 20
    ionut_34
    169
    ionut_34 2023.12.01 20:55 
     

    since i have this tool i don't use tradingview anymore, it has everything you need.

    riad mansee
    25
    riad mansee 2023.10.16 22:58 
     

    I purchased this product and when I changed the platform it no longer worked why ?

    01.dcalantes
    71
    01.dcalantes 2023.09.20 22:12 
     

    This indicator being an MT4 add on that provides it almost a TradingView level of power isn't just hype. A rectangle with a built in Fib level (Split %), RR tool, adding in text, text placement, alerts (for both rectangle and lines)... I was in search of a tool for MT4 to do JUST EVERY SINGLE THING I DO ON TRADINGVIEW. And this delivered all I needed. This tool almost instantly made me fall in love with my MT4 mark ups once again. There's a lot of moving parts, sure, and it might take a while to get used to it, but good thing is the author made a tutorial video to walk me through each function. Amazing. I can see myself using this indicator for as long as I trade. Thank you for creating this masterpiece.

    おすすめのプロダクト
    RRBCTC uses real Tick data to create custom Range, Time, Renko and Volume bar charts for MT4. Tick data use is RRBCTC unique feature, which allows highest quality charting of current and historical price movement. Custom inputs provide option to create range bars with sizes from 0.1 pip all the way to 100+ pip and time bars periods from second all the way to a month. Charts are updated with new data in real time, allowing user use of MT4 indicators and advisors (EA). RRBCTC greatly extends MT4 c
    Introducing the Tether Angle MT4 EA (T-Angle EA)  Unlock the full potential of the forex market with the cutting-edge T-Angle EA . Designed to capitalize on the dynamic movements of the EUR/USD currency pair, this expert advisor combines the power of Tether Line Angle Trend to deliver consistent and optimized trading outcomes. Key Features: EUR/USD Focus: The T-Angle EA is effectively tailored for the EUR/USD currency pair, ensuring a highly specialized approach. By concentrating on this
    The indicator shows De Mark patterns and gives trading signals in the form of arrows and alerts. Shows De Mark lines on the history of quotes. Has a multiframe., Can show DeMark patterns of higher timeframes on lower timeframes. Has a switchable function for displaying fractals. Trading signals are accompanied by sound alerts, as well as sending them to mail and mobile devices.
    Description  Fibo Retracement  is an indicator that automatically plots  Fibonacci  levels in the main chart based on Close prices , which distinguishes it from the Fibo Levels indicator that plots levels based on High/Low prices. Thus, using both indicators provides the trader with the opportunity of determining support and resistance zones by Fibonacci! The levels are calculated and plotted over a certain interval using the number of bars specified by the user. The user can display Fibonacci l
    The Find Levels utility scans the range of prices and bars indicated by you on the chart, finds the levels most often related to High and Low prices and provides a full report. The color of the level line depends on the number of touches and changes in the program settings. The level is drawn in the event that if the shadow of the High or Low candle was at least two touches during the period specified in the parameters. The characteristics of the candle, namely, what should be its parameters for
    MT4 EA - FOREX Challenger Plus This unique automated trading system adopted 3 Layers of difference entry at two different price positions. The pre-defined lot size is actually divided into 3 trades and enters different price positions once the entry condition is fulfilled. If a drawdown occurs, the EA will open an additional position based on the pre-defined strategy, and when the total profit of all orders is greater than a certain value, all orders, including unprofitable ones, are closed. It
    MT4 EA - FOREX Scorer Plus This unique automated trading system adopted 3 Layers of difference entry at two different price positions. The pre-defined lot size is actually divided into 3 trades and enters different price positions once the entry condition is fulfilled. If a drawdown occurs, the EA will open an additional position based on the pre-defined strategy, and when the total profit of all orders is greater than a certain value, all orders, including unprofitable ones, are closed. It is n
    シグナルコンプレックスAtlonは、矢印の形でシグナルを電子メールに送信し、通知を携帯電話にプッシュする既製の取引システムです。 Atlonは、既製のTPレベルも赤い四角で表示します。 システムは任意のチャート(通貨ペア、株式、暗号通貨、金属、石油)で動作します。 時間枠H1。 システムは再描画されず、矢印はどこにも消えません。 セットには、チャートにインストールする前にロードする必要がある既製の設定が含まれています。 設定をダウンロードする システムパラメータ: バー単位のスペクトルサイズ-バー単位のスペクトルサイズ。 ポイント単位のスペクトルサイズ-ポイント単位のスペクトルサイズ。 ノイズ-ノイズ 最大バー-バーの最大数 TPを表示-TPを表示するかどうか。 フィルタTF-選択した時間枠を分析に使用します。 ディスプレイでのアラート-チャートにシグナルを表示します モバイルMT4にプッシュ-電話に信号を送信する メールを送信-電子メールに信号を送信します 
    Random trade Random Buy Random Sell Random profit Random Take profit Random Stoploss Crayzy strategy [Important] 0.01 LOT with 10k balance ------------------------------------------------------------------ Contact Us now Do you want have a EA that trade with your strategy?  We will finish the EA in 1-3 working days  Prime Capital Viet Nam primecapitalvn@gmail.com
    A professional expert analyzes the market using the relative strength index. The basic principle is that the bot takes the indicated prices for a certain period of time and calculates the strength and amplitude of the price. This can show when the trend will lose strength and reverse. The signal from the exit from the overbought/oversold zones is analyzed, the levels of these zones will be the levels with LEVEL_MAX and LEVEL_MIN values. We buy when the signal first falls below a certain level (
    A Powerful Solution That Analyze The Renko And The Standard Charts And Filters Out The Noise Or The Narrow Range Moves And Gives Entry And Exit Signals. A statistics window is included to show the net points gained from these signals taking into considerations the spread of the pair and to evaluate accurately the overall performance. Advantages It Provides A Clear Buy and Sell signals with take profit and stoploss levels. A Statistical analysis that offers an accurate image of net gained point
    Bermaui Channel
    Muhammad Elbermawi
    5 (27)
    This is a price channel that shows five important price levels on the chart. Those levels are: 1. The Highest High (HH) of the previous x bars. 2. The Highest Low (HL) of the previous x bars. 3. The Center Line. 4. The Lowest High (LH) of the previous x bars. 5. The Lowest Low (LL) of the previous x bars. How does Bermaui Channels Captures Overbought  area Think of the distance between HH and HL levels as an overbought area. When the price candles or bars crosses the HL to the upside this
    The indicator displays Renko bars on the chart, uses their data to calculate and display the moving average, PriceChannel and generates buy/sell signals. Renko is a non-trivial price display method. Instead of displaying each bar within a time interval, only the bars where the price moved a certain number of points are shown. Renko bars do not depend on a time interval, therefore the indicator works on any timeframe without losing its efficiency. The PriceChannel indicator displays the upper, lo
    MultiFiboDynamicMT4 is a powerful, professional indicator for estimating the most important support and resistance levels. The main advantage is that it plots the Fibonacci levels at all timeframes simultaneously, which allows the trader to see the full picture of the possible price movement of the trading instrument! Advantages of the indicator The indicator is perfect for scalping and trading binary options. Suitable for beginners and experienced traders. Works on all timeframes. Works on an
    FREE
    About  Holy Renko is a trend identifier capable of identify small and long market movements. This indicator should be use in Renko Charts. VIDEO (information and tips) [HERE] How to install Renko Charts [HERE] Features Developed for Renko Charts Easy to analyze Fast signals Not repaint (when candle close)  Statistics panel Filters false signals Alerts, emails and push notifications  Advantages of Renko Chart Easy to install Easy to analyze Filter out the noise of wicks  Easy ide
    Auto Order Block with break of structure based on ICT and Smart Money Concepts Futures Break of Structure ( BoS )             Order block ( OB )            Higher time frame Order block / Point of Interest ( POI )    shown on current chart           Fair value Gap ( FVG ) / Imbalance   ,  MTF      ( Multi Time Frame )    Volume Imbalance     ,  MTF          vIMB Gap’s Equal High / Low’s     ,  MTF             EQH / EQL Liquidity               Current Day High / Low           HOD /
    FVG Master EA: A High-Probability Trading Solution FVG Master EA is an advanced trading system designed to leverage Fair Value Gaps (FVGs) in the Forex market. Unlike traditional EAs, it doesn't rely on a Martingale grid system; instead, it focuses on identifying and exploiting high-probability FVGs for entries. BEST RESULTS (for 1k and up accounts) GOLD on the 5m chart Lot Size Of First Position: 0.01 Max Lot Size: 5.0 Candle Body Size: 20 Take Profit  In Pips: 5000 Step Distance In Pips: 10
    Big Forex Players MT4
    Marzena Maria Szmit
    4.64 (22)
    We proudly present our cutting-edge robot, the  Big Forex Players EA  designed to maximize your trading potential, minimize emotional trading, and make smarter decisions powered by cutting-edge technology. The whole system in this EA took us many months to build, and then we spent a lot of time testing it. This unique EA includes three distinct strategies that can be used independently or in together. The robot receives the positions of the   biggest Banks   (p ositions are sent from our databa
    Linker
    Roman Lipatov
    5 (1)
    "LINKER" is an indicator that links any number of windows of the charts it is running on. A synchronized crosshair is also available, toggled by the (Ctrl) key or the (L) button. The visibility of the trade levels can be toggled on each chart separately using the (Shift) key or the (V) button. The buttons and the crosshair have customizable settings and colors. For instance, you need to analyze a trading instrument on different timeframes, for example, on H1, H4 and D1. Doing this in a single ch
    Alpha Striker SMC KING is unique Expert Advisor that continues the Alpha Striker series of  expert advisors. Innovative methods of the programme's approach to trading, and promising performance results are possible thanks to the use of modern technologies and methods. The Alpha Striker SMC KING is a fully automated EA designed to trade currencies only. Working pairs recommended EURUSD. Expert showed stable results on currencies in 2022-2024 period. No dangerous methods of money management used,
    Hello all The expert works on the intersection of moving averages with a digital method of opening deals With closing deals on a profit of a number of points programmatically With opening deals with the trend and closing some deals together for a profit until all are closed together for a profit The expert works on regular candles. It is possible to experiment on the timing of five minutes, quarter-hour, half-hour or hour parameters: Lot1: Manual Lot Size Auto_Lot: Set true to automatically c
    専門家が技術分析を行い、分析を見ることができます。 分析は、日中に更新されます。 メタトレーダーによるワンクリック分析が画面に表示されます。 これらの分析の保留中の注文がある場合は、ワンクリックでトランザクションを開きます。 それは非常に簡単で使いやすいです。 関連の分析、期間および情報はあなたのコンピュータに型板として救われる。 きをダウンロードしてからファイルフォルダです。 それは非常に教育的であり、あなたがお金を稼ぐのに役立つ製品です。 専門家が技術分析を行い、分析を見ることができます。 分析は、日中に更新されます。 メタトレーダーによるワンクリック分析が画面に表示されます。 これらの分析の保留中の注文がある場合は、ワンクリックでトランザクションを開きます。 それは非常に簡単で使いやすいです。 関連の分析、期間および情報はあなたのコンピュータに型板として救われる。 きをダウンロードしてからファイルフォルダです。 それは非常に教育的であり、あなたがお金を稼ぐのに役立つ製品です。
    Professional forex expert   Black Angel   (for EURUSD, GBPUSD pairs) alyzing the market using the Elliot Wave Index. Elliott wave theory is the interpretation of processes in financial markets through a system of visual models (waves) on price charts. The author of the theory, Ralph Elliott, identified eight variants of alternating waves (of which five are in the trend and three are against the trend). The movement of prices in the markets takes the form of five waves. Three of them (1, 3, 5)
    Darwin Swing MT4
    Guillaume Duportal
    4.79 (14)
    ダーウィン・スイング 発売価格999ドル、将来価格1490ドル DESCRIPTIONS : -- このEAは、私のFXトレードの哲学を反映しています。 時間をかけてやるんだ! (FXはレースではない): https://www.mql5.com/en/blogs/post/745790 -- 過去のパフォーマンスを見るには、以下のシグナルへのリンクが必要です。 ライブとデモのシグナル: https://www.mql5.com/en/users/tradedeal/seller EXPLANATION(説明)。 Darwin Evolutionの大成功を受け、同時に使用できるDarwin Swingを紹介します。 このExpertは、手動取引に限りなく近い形で設計されています。 長期的な視点で作られたExpertであり、高速スキャルパーでもなく、夜間スキャルパーでもない。 基本戦略はスイングトレードで、支持線と抵抗線を利用してポジションを建てる。 このシステムの革新性は、バーチャルポジションを組み込んでいることです。このEAは、各
    The Before indicator predicts the most likely short-term price movement based on complex mathematical calculations. Most of the standard indicators commonly used in trading strategies are based on fairly simple calculations. This does not mean that there were no outstanding mathematicians in the world at the time of their creation. It is just that computers did not yet exist in those days, or their power was not enough for the sequential implementation of complex mathematical operations. Nowa
    License required to run all EAs created by Forex Forensics 101 LLC.  How to use: - Download from marketplace - Move to 'Indicators' folder, can not be in folders within the 'Indicators' folder Disclaimer: Forex Forensics 101 LLC is not affiliated with anyone selling an EA created through Forex Forensics 101 LLC. As such, the buyer is responsible for all wins and losses they may experience. Trading the forex market is high risk. You should always consult an expert before risking any capital. 
    If you do not have your own trading strategy yet, you can use our ready-made trading strategy in the form of this indicator. The Your Trends indicator tracks the market trend, ignoring sharp market fluctuations and noise around the average price. The indicator is based on price divergence. Also, only moving averages and a special algorithm are used for work. It will help in finding entry points in the analysis and shows favorable moments for entering the market with arrows. Can be used as a f
    Bigger chart labels would allow the user to be entirely aware of which chart he/she is on.  Each chart window is unique, containing different patterns and economic motives so acknowledging the chart window would be absolutely essential!  There are well known Economic Time Zones included in clear view, by choice!    Simple does it! Use your computing mouse scroller, clicking with the right finger on the label, in order to customize the label properties. From there, choose your preferred color,
    FREE
    The PUA MultiType Pivot indicator is built on the daily chart of the previous day. The PUA MultiType Pivot indicator is one of the most popular tools in technical analysis, used by traders to identify potential reversal points in financial markets. This indicator constructs three types of Pivot points: Classic, Fibonacci, and Camarilla, each offering its unique approach to market analysis. The advantages of this indicator include: Simplicity and Clarity PUA MultiType Pivot provides clearly defi
    このインジケータは、横ばいを検出し、検出された領域を色の付いた四角形で塗りつぶします。 このインディケータの主なアイデアは、価格がチャート上の特定の領域を埋 めたときにフラットを検出することです。 入力パラメータ Color rectangle - 影を付ける矩形の色。 Bars in rectangle - 長方形内のバーの最小許容数。 Density in % - 平坦の密度。矩形の面積に対するパーセンテージで設定。 __________________________________________________________________ __________________________________________________________________
    このプロダクトを購入した人は以下も購入しています
    The product will copy all telegram signal to MT4   ( which you are member  ) , also it can work as remote copier.  Easy to set up, copy order instant, can work with almost signal formats, image signal, s upport to translate other language to English Work with all type of channel or group, even channel have "Restrict Saving Content", work with  multi channel, multi MT5 Work as remote copier: with signal have ticket number, it will copy exactly via ticket number. Support to backtest signal. How to
    Unlimited Trade Copier Pro is a tool to copy trade remotely between multiple MT4/MT5 accounts at different computers/locations over internet. This is an ideal solution for signal provider, who want to share his trade with the others globally on his own rules. One provider can copy trades to multiple receivers and one receiver can get trade from multiple providers as well. The provider can even set the subscription expiry for each receiver, so that receiver will not be able to receive the signal
    Dedicated for FTMO and other Prop Firms Challenges 2020-2023 Trade only GOOD and checked PROP FIRMS  Default parameters for Challenge $100,000 Best results on GOLD and US100  Use any Time Frame Close all deals and Auto-trading  before  US HIGH NEWS, reopen 2 minutes after Close all deals and Auto-trading  before Weekend at 12:00 GMT+3  Friday Recommended time to trade 09:00-21:00 GMT+3 For Prop Firms MUST use special Protector  https://www.mql5.com/en/market/product/94887 -------------------
    -25% discount ($199 -> $149) Advanced trading tool: One click smart orders that execute under your conditions Developed by trader for trading community:  position size calculator (lot size), open position after price action, strategy builder, set and forget trading, mobile notifications... Risk Management -  Risk percentage position size calculator, gain percentage, target risk reward ratio, spread and commissions are included in calculations 7 Advanced order types   - Set and forget trading
    Trade Copier Agent は、複数の MetaTrader(4/5) アカウント/端末間で取引をコピーするように設計されています。 このツールを使用すると、プロバイダー (ソース) または受信者 (宛先) として機能できます。すべての取引アクションは、遅延なくプロバイダーからレシーバーにコピーされます。 このツールを使用すると、0.5 秒未満の超高速のコピー速度で、同じコンピューター上の複数の MetaTrader ターミナル間で取引をコピーできます。 Trade Copier Agent インストール & 入力ガイド コピーを開始する前、または注文がないうちに、プロバイダー アカウントで設定を適用してください。 注文中の変更は、受取人のアカウントに影響します。 例: プロバイダー アカウントが買い注文を適用し、その後、受信者アカウントのすべての買い注文を無効にすると、決済されます。 EA追加URL(   http://autofxhub.com   )MT4端末(スクリーンショット参照) に関する通知を受け取りたい場合 。 MT5 バージョン https://w
    あなたがメンバーである任意のチャンネル(プライベートおよび制限されたチャンネルを含む)からのシグナルを、直接あなたのMT4にコピーします。 このツールは、ユーザーを念頭に置いて設計されており、取引を管理および監視するために必要な多くの機能を提供しています。 この製品は、使いやすく視覚的に魅力的なグラフィカルインターフェースで提供されています。設定をカスタマイズして、数分で製品を使用開始できます! ユーザーガイド + デモ  | MT5版 | Discord版 デモを試したい場合は、ユーザーガイドを参照してください。 Telegram To MT5レシーバーは、ストラテジーテスターでは機能しません! Telegram To MT4の特長 一度に複数のチャンネルからシグナルをコピー プライベートおよび制限されたチャンネルからシグナルをコピー BotトークンやチャットIDは不要です(必要な場合は引き続き使用できます) リスク%または固定ロットを使用して取引 特定のシンボルを除外 すべてのシグナルをコピーするか、コピーするシグナルをカスタマイズするかを選択 すべてのシグナルを認識する
    Mentfx Mmanage
    Anton Jere Calmes
    5 (16)
    The added video will show you the full functionality, effectiveness, and simplicity of this trade manager. Drag and Drop Trade Manager. Draw your entry and have the tool calculate the rest. Advanced targeting and close portions of a trade directly available in tool (manage trades while you sleep). Market order or limit order on either side with factored spread. Just draw the entry, the tool does the rest. Hotkey setup to make it simple. Draw where you want to enter, and the stop loss, the tool c
    MT4 Alert Signal Trader  is an EA that helps you trade MT4 Alert popup. Some indicators can provide signals by showing an alert popup containing signal texts. This EA will read and trade these signal texts. The alert texts should contain at least 2 elements:  (1) a symbol text   (ex: "EURUSD") and  (2) a command type   (ex: "Buy", "Sell", "Close") that trigger EA's trading activities. Some other contents that may have or not are open price, stop loss, take profit values... The EA needs an aweso
    The product will copy all  Discord  signal   to MT4   ( which you are member  ) , also it can work as remote copier.  Easy to set up. Work with almost signal formats, support to translate other language to English Work with multi channel, multi MT4. Work with Image signal. Copy order instant, auto detect symbol. Work as remote copier: with signal have ticket number, it will copy exactly via ticket number. How to setup and guide: Let read all details about setup and download Discord To MetaTrade
    このカスタムアルティメットスナイパーダッシュボードは、オリジナルのアルティメットスナイパーダッシュボードインジケーターをEAでアップグレードしたものです。最大98種類のアルゴリズムで動作し、使用する資産クラスのトレンドの本質を確実に捉えます。 数ヶ月に渡り、多くのお客様から頂いたご提案やアドバイスに直接お応えしたものです。   このカスタムバージョンは、完全にカスタマイズ可能です。 98の独立したカスタムアルゴリズムによって支えられています。 非常に素晴らしいビジュアルインターフェースなので、どのペアやタイムフレームでも、簡単かつ自信を持って市場全体の動向を追うことができます。 テレグラムにリアルタイムのアラートを送ることができます。 取引するペアに応じた独自のインデックスを作成することができます。 携帯電話にリアルタイムでアラートを送ることができるので、PCの前にいなくても動きがあることを知ることができます。 入力設定から8つの指標を設定することができます。 アラートを受信する指標と時間枠を設定することができます。 インターネット接続が検出されなかった場合、アラ
    FREE SIGNAL CHANEL:  https://t.me/redfox_daily_forex_signals Time saving and fast execution Whether you’re traveling or sleeping, always know that Telegram To Mt4 performs the trades for you. In other words, Our   Telegram MT4 Signal Trader  will analyze the trading signals you receive on your selected Telegram channels and execute them to your Telegram to MT4 account. Reduce The Risk Telegram To Mt4   defines the whole experience of copying signals from   Telegram signal copier to mt4  p
    TakePropips TradePad Pro
    Eric John Pajarillaga Aldana
    5 (4)
    TakePropips TradePad Pro には、強力なトレード マネージャー、通貨強度メーター、アカウント レポート ツール、リスク管理ツールなどが含まれています。 これは、最も高度な外国為替取引マネージャーおよび取引アシスタントの 1 つです。これは、貿易取引をより効率的に管理したいトレーダーにとって完璧なソリューションです。 ユーザー マニュアルはブログ記事からダウンロードできます:   https://www.mql5.com/en/blogs/post/751180 このトレーディング システムは、ストラテジー テスターでテストできます (ビジュアル モードを有効にします)。ライブ チャートでテストしたい場合は、7 日間の試用版を入手するようにメッセージを送ることもできます。 詳細については、説明の下にあるビデオ チュートリアルも利用できます。 ご不明な点やサポートが必要な場合は、お気軽にお問い合わせください。喜んでお手伝いさせていただきます。 TradePad Pro は、すべての外国為替ペア、金属、コモディティ、指数、および仮想通貨で動作します。 主な特徴
    What Exactly Is A Smart Trading Tool? Smart Trading Tool was developed for fast and comfortable trading of the financial markets especially for ORDER BLOCKS TRADERS . It provides traders functionalities, such as: A Drawing Tool One-Click Trading Panel Automated Lot Sizes Calculation based on your risk appetite & Money Management ( Watch this video , how this tool can help manage your risk per trade better!) Built in PRICE LEVELS (Fibonacci, Round Numbers, Daily hi-low, etc) Shows Trading Informa
    ADAM EA Special Version for FTMO  Our 1st EA created using ChatGPT technology Trade only GOOD and checked PROP FIRMS  Default parameters for Challenge $100,000 Tested on EURUSD and GBPUSD only  Use 15MIN Time Frame Close all deals and Auto-trading  before Weekend at 12:00 GMT+3  Friday For Prop Firms MUST use special Protector  https://www.mql5.com/en/market/product/94887 Signal using ADAM  https://www.mql5.com/en/signals/2190554 --------------------------------------------------------------
    News Trader Pro is a unique robot that allows you to trade the news by your predefined strategy. It loads every piece of news from several popular Forex websites. You can choose any news and preset the strategy to trade it, and then News Trader Pro will trade that news by selected strategy automatically when the news comes. News release gives opportunity to have pips since the price usually has big move at that time. Now, with this tool, trading news becomes easier, more flexible and more exciti
    The  Easy Strategy Builder (ESB)  is a " Do It Yourself " solution that allows you to create a wide range of the automated trading strategies without any line of codes. This is the world’s easiest method to automate your strategies that can be used in STP, ECN and FIFO brokers. No drag and drop is needed. Just by set conditions of your trading strategy and change settings on desired values and let it work in your account. ESB has hundreds of modules to define unlimited possibilities of strategi
    50% off. Original price: $375 Reward Multiplier is a semi-automatic trade manager based on pyramid trading that opens additional orders with the running profit of your trades to maximize return exponentially without increasing the risk. Unlike other similar EAs, this tool shows potential profit/loss and reward to risk ratio before even entering the first trade! Download Demo here  (starting lot is fixed at 0.01) Guide + tips here MT5 version   here You only open the first order. When your t
    FX28 Trader
    Tsvetan Tsvetanov
    5 (1)
    FX28 Trader Dashboardをご紹介します - あなたの究極のトレードマネージャー FX28 Trader Dashboardは、あなたの外国為替(Forex)取引を新たな高みに押し上げるために設計された包括的で直感的なトレードマネージャーです。経験豊富なトレーダーでも、まだ金融の旅を始めたばかりの方でも、この強力なツールは取引活動を効率化し、意思決定プロセスを向上させるために開発されました。 主な特徴: ユーザーフレンドリーなインターフェース: FX28 Trader Dashboardは、あらゆるレベルのトレーダーに適したユーザーフレンドリーなインターフェースを備えています。さまざまな機能やツールを簡単にナビゲートし、わずか数クリックでトレードを完全にコントロールできます。 リアルタイムマーケットデータ: リアルタイムのマーケットデータフィードで先を見越してください。通貨ペア、トレンド、マーケットの変動に関する最新の情報を提供し、情報を元に自信を持ってトレードを実行できます。 高度なトレードアナリティクス: FX28 Trader Dashboardでは、高度なアナ
    AntiMartingale-Execution is a pyramidal Money Management system capable of increasing positions as equity increases using the positive margin of the transaction. It is possible to set the capital for each operation, the operating and maximum margins and the target level to be reached. Once the general trade settings have been made, it is possible to preview the grid of operations that will be activated by pressing the BUY / SELL button. If necessary, it is also possible to close all operations
    多機能ツール 搭載機能: ロット計算機、プライスアクション、リスク/リワードレシオ、トレードマネージャー、需要供給ゾーンなどをはじめ65以上の機能。 バージョ:デモ版   |   ユーザーマニュアル   |    MT5版 このユーティリティはストラテジー テスターでは機能しません。 ここからデモ バージョンをダウンロードして製品をテストできます。 ご不明な点や改善提案、バグの発見などございましたら、 連絡してください 。 取引プロセスを簡素化、高速化、自動化します。このダッシュボードで標準端末機能を拡張します 1. 新しい取引を開始します : ロット / リスク / RR の計算 1. Lot計算機(リスクサイズに基づく取引量計算 2. リスク計算機(ロットサイズに基づくリスク量) 3. リスク/リワードレシオ (R/R) 4. 注文のアクティベーション トリガー + Buy StopLimit / Sell StopLimit: MT4でも可  5. 仮想 SL / TP レベル (隠しSL、TP: ブローカーには見えない) 6.  Smart SL / エントリー レ
    FiboPlusWave Series products Ready-made trading system based on Elliott waves and Fibonacci retracement levels . It is simple and affordable. Display of the marking of Elliott waves (main or alternative option) on the chart. Construction of horizontal levels, support and resistance lines, a channel. Superposition of Fibonacci levels on waves 1, 3, 5, A Alert system (on-screen, E-Mail, Push notifications).    Features: without delving into the Elliott wave theory, you can immediately open one of
    This is exactly what the name says. Visual strategy builder . One of a kind. Turn your trading strategies and ideas into Expert Advisors without writing single line of code. Generate mql source code files with a few clicks and get your fully functional Expert Advisors, which are ready for live execution, strategy tester and cloud optimization. There are very few options for those who have no programming skills and can not create their trading solutions in the MQL language. Now, with Bots Build
    Telegram MT4 Signal Traderは、Telegramチャネル、グループ、チャットを介して受信するシグナルを取引するのに役立つEAです。 チャンネルの所有者である必要はありません。 Telegramアカウントのシグナルテキストを読むことができれば、それらすべてを取引することができます。 EAには、Telegram APIを介してTelegramチャネル、グループ、プライベートチャットから信号テキストを読み取るのに役立つTelegramReaderアプリケーションという素晴らしい無料ツールが必要です。 設定方法 EAの設定方法と理解方法については、こちらのユーザーガイドをお読みください。 * 主な特徴: 10ライセンス:10 VP、デスクトップ、ラップトップでEAを実行できます 無制限のMT4アカウントとテレグラムチャネル:無制限のMT4アカウント(デモとリアル)、無制限のテレグラムチャネル(すべてのチャネル、グループ、チャット)、無制限のテレグラムアカウント(自分のアカウントと他のアカウント)にEAを使用できます すべての信号タイプを取引でき
    Smart Channel M4
    Vahidreza Heidar Gholami
    The trend in the market can be predicted using trend lines but the problem is you don’t know where exactly the price is going to touch the trend line where you can put your pending orders on. Smart Channel Expert Advisor makes it possible to put an advanced channel around the price data, which can be configured to handle placing orders, opening and closing positions, managing risk per trade, spread, slippage, and trailing stop-loss and take-profit automatically. Features Money Management (Calcul
    Strategy Builder offers an incredible amount of functionality. It combines a trade panel with configurable automation (covert indicators into an EA), real-time statistics (profit & draw down) plus automatic optimization of SL, TP/exit, trading hours, indicator inputs. Multiple indicators can be combined into an single alert/trade signal and can include custom indicators, even if just have ex4 file or purchased from Market. The system is easily configured via a CONFIG button and associated pop-up
    Forex Market View Dashboard and CSM
    Opengates Success International
    5 (2)
    FFXMV Dashboard + CSM is a custom indicator combined with Currency Strength Meter . It is created to give the Traders a full view of what is going on in the market. It uses a real time data to access the market and display every bit of information needed to make a successful trading. Before attaching this Indicator to your window chart, go to your MT4's Market Watch panel and HIDE all the Currency pairs you don't need or trade and leave the rest there. The reason is that FFMV Dashboard will DISP
    MT4からテレグラムEAへのテキスト送信、MT4からテレグラムチャネルへ MT4 Telegram Signal Provider EAは、プロの電信信号プロバイダーになりたい人にとって、市場で最も優れた電信ユーティリティへのMT4です。 シンプルですが、強力でプロフェッショナル Metatrader 4プログラムでの注文に基づいて、シグナルとレポートをテレグラムチャネルに送信します Facebook、Twitter、Blogger、Wordpressなどの多くのプラットフォームに信号を送りたいですか?問題ありません。IFTTTを使用して、テレグラムチャネルをこれらのプラットフォームに接続し、信号を簡単に送信します。 * 主な特徴: 多くのチャンネルに信号を送信:マルチテレグラムチャネル、メール、モバイル端末へのプッシュ通知の送信 注文を非常に高速にスキャン:ティックではなく、数秒でスキャン すべての注文タイプの情報を送信:オープン(保留中の注文を含む)、キャンセル、クローズ(%部分的なクローズを含む)、トリガー、変更注文 送信オーダーをフィルタリングする
    Semi Automated EA for working as your trading assistant. Overview Trading planner will make you act like professional traders in real markets. Before entering markets, they make a plan for their trades, screening out all opportunities in all time frames. Trading Planner can be used for all Time Frames (M1 ~ MN). Simply draw trendline as a trend and Support/Resistance . At this version , market opportunities will be taken by trendline using strategy of 1, 2, 3 . Simply draw the trendline by defi
    HFT Prop Passer
    Faran Ataeiraveshti
    5 (1)
    HFT Prop Passer は、一部のプロップ (独自) 企業の HFT チャレンジ アカウントに合格するように設計されたエキスパートアドバイザーです。 取引戦略: このエキスパートアドバイザーは、1 分の時間枠でダウ ジョーンズ シンボルに作用し、高頻度取引を実行します。 この製品は、非常に短い時間 (多くの場合 30 分未満) で HFT アカウントのチャレンジ フェーズを通過できます。 ドローダウンも非常に低いため、プロップファームの口座条件に適しています。 ***製品の現在の価格は、最初の 5 人の購入者に対してのみ 150 ドルです。 5回購入すると最大200ドル値上がりしますので、この機会をお見逃しなく。 Expert Advisor のテスト結果: 以下の画像で、ドローダウンレベル、利益、およびこの利益が得られた期間の例を確認できます。  これらの結果に基づいて、私たちのチームが設計した HFT テクノロジーの能力を評価できます。 バックテストのやり方は? mt4ストラテジーテスターでデ モ版をバックテストする方法はこちらをご覧ください。 製品購入後、「
    Trade Copier Pro is a tool to copy trade remotely between multiple MT4/MT5 accounts at different computers/locations over internet. This is an ideal solution for signal provider, who want to share his trade with the others globally on his own rules. One provider can copy trades to multiple receivers and one receiver can get trade from multiple providers as well. The provider can even set the subscription expiry for each receiver, so that receiver will not be able to receive the signal after that
    作者のその他のプロダクト
    -25% discount ($199 -> $149) Advanced trading tool: One click smart orders that execute under your conditions Developed by trader for trading community:  position size calculator (lot size), open position after price action, strategy builder, set and forget trading, mobile notifications... Risk Management -  Risk percentage position size calculator, gain percentage, target risk reward ratio, spread and commissions are included in calculations 7 Advanced order types  - Set and forget trading w
    -25% discount ($149 -> $111) Everything for chart Technical Analysis indicator mt5 in one tool Draw your supply demand zone with rectangle and support resistance with trendline and get alerts to mobile phone or email alert -  Risk reward indicator mt5 Video tutorials, manuals, DEMO download   here .   Find contacts on my   profile . 1.   Extended rectangles and trendlines Object will be extended to the right edge of the chart when price will draw new candles on chart. This is rectangle extend
    -25% discount ($199 -> $149) Advanced trading tool: One click smart orders that execute under your conditions Developed by trader for trading community:  position size calculator (lot size), open position after price action, strategy builder, set and forget trading, mobile notifications... Risk Management -  Risk percentage position size calculator, gain percentage, target risk reward ratio, spread and commissions are included in calculations 7 Advanced order types   - Set and forget trading
    Place price Alerts on extended  Rectangles and Trendlines -  Risk reward indicator mt4 Extend Rectangles & Trendlines to the right edge Mark your supply demand zones with extended rectangle and draw support resistance lines with extended trendline. Find detailed manuals   here . Find contacts on my   profile . MT4 Rectangle extender indicator will simplify and make it easier for you to analyze markets and stay notified about important events. When you extend rectangle or trendline the action bu
    Place price Alerts   on  extended  Rectangles   and   Trendlines -  Risk reward indicator mt5 Extend Rectangles & Trendlines to the right edge Mark your supply demand zones with extended rectangle and draw support resistance lines with extended trendline. Find detailed manuals   here .  Find contacts on my   profile . MT4 Rectangle extender indicator will simplify and make it easier for you to analyze markets and stay notified about important events. When you extend rectangle or trendline the a
    Display rectangles and trendlines list  from Trading box  Technical analysis tool. Objects are ordered in the list by   pip distance   that is difference between object price and Bid price. With this tool you will know which chart to look for next trading opportunity. No more switching between charts and searching for trades where price is close to rectangle zone or trendline support resistance level. Sorted Rectangles and Trendlines by pip distance -  If you are trading on multiple charts, the
    FREE
    Rectangle position changer   tool is used for precise/accurate rectangle positioning by time or price only.   You can move each side of rectangle separately with lines created around selected rectangle. This tool will replace classical grid because it is like dynamical chart grid for rectangle grid. This tool allows you to adjust your rectangles, from all 4 sides, with ease and makes your technical analysis that much faster. This tool is handy when corner points for changing rectangle position a
    FREE
    Display Order box list from  Trading box  Order Management tool. Find contacts and manual links on my   profile . This dashboard gives you an edge in forex trading because in few seconds you can decide which pair and timeframe is worth to watch more closely. This is how you will not be distracted by all other forex pairs that you trade, and you will not miss great opportunities to trade the best price. Trading Dashboard  (order box overview panel and Trading box Order management extension) Tr
    FREE
    Display rectangles and trendlines list from  Trading box  Technical analysis tool. Objects are ordered in the list by pip distance that is difference between object price and Bid price. With this tool you will know which chart to look for next trading opportunity. No more switching between charts and searching for trades where price is close to rectangle zone or trendline support resistance level. Sorted Rectangles and Trendlines by pip distance -  If you are trading on multiple charts, then th
    FREE
    Rectangle position changer  tool ( rectangle indicator) is used for precise/accurate rectangle positioning by time or price only. You can move each side of rectangle separately with lines created around selected rectangle. This tool will replace classical grid because it is like dynamical chart grid for rectangle grid. This tool allows you to adjust your rectangles, from all 4 sides, with ease and makes your technical analysis that much faster. This tool is handy when corner points for changi
    FREE
    This tool will remove buttons and text labels from the chart, after you remove Trading box Order management or Trading box Technical analysis . You just need to drag this tool to your chart and after cleanup of objects is finished, the tool will remove itself from the chart. Please check images below that present Before and After using the Removal tool. There is also a short YouTube video at the bottom to show how easy it is to clean your chart after using Trading box tools. - input var
    FREE
    Display Order box list from  Trading box  Order Management tool. Find contacts and  manual   links on my   profile . This dashboard gives you an edge in forex trading because in few seconds you can decide which pair and timeframe is worth to watch more closely. This is how you will not be distracted by all other forex pairs that you trade, and you will not miss great opportunities to trade the best price. Trading Dashboard  (order box overview panel and Trading box Order management extension)
    FREE
    This tool will remove buttons and text labels from the chart, after you remove Trading box Order management or Trading box Technical analysis. You just need to drag this tool to your chart and after cleanup of objects is finished, the tool will remove itself from the chart. Please check images below that present Before and After using the Removal tool. There is also a short YouTube video at the bottom to show how easy it is to clean your chart after using Trading box tools. - input variable "
    FREE
    フィルタ:
    ionut_34
    169
    ionut_34 2023.12.01 20:55 
     

    since i have this tool i don't use tradingview anymore, it has everything you need.

    riad mansee
    25
    riad mansee 2023.10.16 22:58 
     

    I purchased this product and when I changed the platform it no longer worked why ?

    01.dcalantes
    71
    01.dcalantes 2023.09.20 22:12 
     

    This indicator being an MT4 add on that provides it almost a TradingView level of power isn't just hype. A rectangle with a built in Fib level (Split %), RR tool, adding in text, text placement, alerts (for both rectangle and lines)... I was in search of a tool for MT4 to do JUST EVERY SINGLE THING I DO ON TRADINGVIEW. And this delivered all I needed. This tool almost instantly made me fall in love with my MT4 mark ups once again. There's a lot of moving parts, sure, and it might take a while to get used to it, but good thing is the author made a tutorial video to walk me through each function. Amazing. I can see myself using this indicator for as long as I trade. Thank you for creating this masterpiece.

    mmsrect
    61
    mmsrect 2023.08.19 11:31 
     

    This is one indicator that adds everything that is missing from mt4. You may need a day get used to it, but once you do it is amazing. I don't need tradingview anymore. The best part of this tool is its dashboard. Unlike other tools, it does not show you precalculated entries, or setups or other useless stuff. Instead it shows you your own analysis. That is so powerful. Amazing job developers. You nailed it!

    livinglife44
    45
    livinglife44 2023.08.01 18:07 
     

    Game Changer, Using Mt4 all these years now not having to you Tradingview is awesome. A++ Tools here

    RvdHo
    185
    RvdHo 2023.06.11 08:00 
     

    This tool lifts Metatrader to an entirely different level. Seriously good software for the self-directed trader of levels, patterns, trend lines and more. Love the active development and support vids, too.

    dip_
    35
    dip_ 2023.05.11 16:45 
     

    Trading Box technical Analysis is an amazing product! It allows really fast chart annotation and greatly facilitates chart navigation. It practically turns Mt4/5 into TradingView! Here are my favourite functions: The “Scale” function allows you to navigate charts at a set scale. The “@“ function allows you to locate specific areas on the chart (from high timeframes to low timeframes) The “Sync” function allows you to sync your chart annotations on multiple charts. Since the last update, you can very quickly annotate the Open, Close, Low, High and Candle Bodies (Supply or Demand) with simple keyboard shortcuts! I am very happy that I purchased Trading Box Technical Analysis, my charts look great and my analysis is greatly accelerated. One last thing, Igor, the creator of Trading Box Technical Analysis is amazing and very helpful, he answers emails and offers regular updates. In my opinion, Trading Box Technical Analysis is a MUST HAVE if you use Mt4 or Mt5.

    18104
    344
    18104 2023.04.18 12:49 
     

    Great indicator, but I would like it to also be able to synchronize the Fibonacci retracement.

    ako to
    90
    ako to 2023.01.08 14:32 
     

    I TRIED IT. One of the best tools I used. it made things much easier. must give it a try. it's all you need in your trading.

    RNP
    44
    RNP 2022.10.10 03:52 
     

    Truly the closest MT4/5 indicator you can have to match the features of TradingView. With alerts, ability to sync between charts, label and much more, Igor (the developer) continues to expand the features with time. He is also very responsive to questions and has an extensive website that explains in detail all the features. Great indicator from a great developer.

    netguru007
    31
    netguru007 2022.08.25 06:49 
     

    Trading Box Technical Analysis tool is one of the most comprehensive tool available on MetaTrader. I have been using it for a month now and been totally loving all its features. Its an ultimate tool if you are price action trader/Supply and demand trader or a SMC based trader. The alerts & recurring alerts and the Sync option for MTF analysis are some of my favorite functionalities of this tool. Great one time investment for setting up alerts for your charts & MTF analysis and a much cheaper alternative for Tradingview for which you would end up paying close to $300 annually (black friday offer else double the price at $600) for 400 alerts

    Timothy Charlton
    75
    Timothy Charlton 2022.08.17 18:01 
     

    This is a very good tool. Everything you need for trading S/D, really good customer service aswell

    Martin Tuke
    265
    Martin Tuke 2022.07.10 21:19 
     

    Great tool, would not be without it now.

    goncalo009
    140
    goncalo009 2022.04.26 23:39 
     

    Hi guys. Really love this indicator. Everything you need on one click. The only thing i think you need add it's auto split rectangle. If i pick rect from color pick will become already split. If this happen i will give you 10 stars

    Retroool
    38
    Retroool 2022.04.26 02:00 
     

    Great indicator, great functionality, ease of access, chart simplicity, supportive creator, etc... What more could one ask? But really, if you are looking to make your charting faster and more efficient, look no further. Just try the demo! (I mean, REALLY test it out), you'll be hooked:)

    fxcommentary
    1887
    fxcommentary 2022.04.12 02:26 
     

    For people using lines/rectangles to alert them - a very good tool. Its main advantage is - it is user friendly to operate. It is highly probable you will be able to incorporate this tool in your routines and it then indeed makes description of your routine faster. Good job, thank you.

    UPDATE: 21.05.2022

    this tool has few exceptional features which are not manifested clearly.

    One of them is the ability to cut support/resistanve line at the point of its breaking by a candle. Example - if you find at 1:05 that the support is broken, and you will cut the support line at 1:07, than your supoort line will no longer extend to the last bar. after 1:07. Your chart on the right is clean and on the left you still have got history of breaking the line. Of course you can do it manually but this tool makes it as easy as possible. This feature alone is worth at least 1/3 or rather 1/2 of the price of the this great tool if you wanted it created to you by any developer. And this is just a tiny little feature, one of many. The cutting is made with [>>>] button.

    azim61
    44
    azim61 2022.03.28 01:55 
     

    This indicator saves my time doing analysis on the chart and be more efficient. Thanks Igor for creating this indicator!

    Devonish
    2933
    Devonish 2022.02.08 11:46 
     

    Very happy with this product. I have my own method of identifying S&R, using this tool is very helpful.

    August 2023. Great update with the FVG feature.

    CasiousD
    784
    CasiousD 2021.12.02 19:04 
     

    Absolutely amazing tool. I was only interested for one function that I couldn't find implemented in a good way in any other indicator. Once I started using it, I realized all the other great functionality that is available, and now this has replaced the job of 4, yes FOUR other indicators I no longer need because of this. Makes my charts cleaner and less cluttered, and I am much, much more efficient and effective with my analysis and decision making. It may seem a bit daunting, but it's so simple to learn and use, and you can quickly find use for things that you didn't even realize you needed. Also love that it has a check for compatibilty, or rather incompatibility with other indicators...I'm not sure how it works because I don't have many other indicators on my chart anymore since I started using this, so I haven't run into any conflicts. But I'm sure there is a video or documentation that explains it somewhere among the many instructional videos provided by the author, which is an absolute plus! Finally, author is very responsive and helpful! Thank you Igor!

    nk79
    354
    nk79 2021.11.15 19:03 
     

    If you wanne bring your analysis to the MT4 plattform with alerts and charting thats the tool for it.

    12
    レビューに返信
    バージョン 10.27 2024.03.22
    - object name change bug fix
    バージョン 10.26 2024.03.16
    - reported bug fix
    バージョン 10.25 2024.03.12
    - bug fix: text objects deleted on object property change
    バージョン 10.24 2024.03.03
    - bug fix
    バージョン 10.23 2024.02.29
    - performance upgrade
    バージョン 10.22 2024.02.24
    - NEW dropdown option "Name & Price (Trendline)" for input "Extended trendline name position"
    バージョン 10.21 2024.02.17
    - update
    バージョン 10.20 2024.01.07
    - hotkeys S D settings via input "Click SD and S D hotkeys rectangle drawing"
    バージョン 10.19 2024.01.02
    - new "Pr" button to show rectangle and trendline Price tag

    - button "No text" renamed to button "Name"

    Link: https://www.mt4tradingbox.com/technical-analysis/#nameprice
    バージョン 10.18 2023.12.30
    - NEW input "Click SD rectangle drawing options"
    1. High & Low (Whole candle))
    2. Open & Close (Candle body)
    3. Body & Tail
    4. Candle Tail,Wick,Shadow

    - NEW "X" button to delete selected rectangle or trendline
    バージョン 10.17 2023.12.29
    - Hotkey remapping for LTF, MTF, HTF:

    X - Show/hide TBTA buttons
    W - Show FVG
    Q - Chart Scale
    1 - Line thickness
    2 - Line thickness
    3 - LTF
    4 - MTF
    5 - HTF
    A - @ (Move chart to selected object Time1)
    バージョン 10.16 2023.12.28
    New Hotkeys:
    X - Show/hide TBTA buttons
    W - Show FVG
    Q - Chart Scale
    1 - Line thickness
    2 - Line thickness
    L - LTF
    M - MTF
    H - HTF
    A - @ (Move chart to selected object Time1)
    バージョン 10.15 2023.12.14
    - NEW input "Show name text after un-extend <<"
    バージョン 10.14 2023.12.10
    - display bug fix for "Flat TL" button
    バージョン 10.13 2023.12.05
    - performance upgrade
    バージョン 10.12 2023.12.03
    - split line % display fixed based on trendline TF
    バージョン 10.11 2023.12.02
    - NEW hotkey "X" to show/hide TBTA buttons

    - NEW input variables:
    "Un-extend Rectangle after Close, Engulf"
    "Un-extend Trendline after Alert, Close, Retest"

    - NEW input variable "Unfill rectangle after Engulf, Close"
    バージョン 10.1 2023.11.30
    - NEW hotkeys input variables:
    H - High hotkey trendline name
    L - Low hotkey trendline name
    O - Open hotkey trendline name
    C - Close hotkey trendline name

    - NEW input variable "Extended trendline style after Alert, Close, Retest"

    - NEW input variable "Ray trendline style after Alert, Close, Retest"
    バージョン 10.0 2023.11.06
    - LTF/MTF/HTF button bug solved
    バージョン 9.99 2023.11.01
    - when unsync Master also unsync all Slaves
    - NEW input variable "SYNC: Unsync master - Delete slave objects"
    - NEW input variable "SYNC: Synced master - Visible for CURRENT and selected HTF/MTF/LTF"
    バージョン 9.98 2023.10.08
    - NEW input "Extended object location"
    - Right edge of the chart
    - Current chart time/bar

    - NEW button "Flat TL" to enable drawing flat trendlines by default
    Manuals: https://www.mt4tradingbox.com/technical-analysis/#flatTL
    バージョン 9.97 2023.08.12
    - new button "Show FVG" - Button to show ALL Fair Value Gaps (FVG indicator mt5 mt4)

    Video: https://www.youtube.com/watch?v=oiHHztd1dzI

    - new inputs:
    Show FVG - Search bars in history (0 = default)
    Show FVG rectangle color - Untouched/Untested
    Show FVG rectangle color - Touched/Tested
    バージョン 9.96 2023.08.05
    - bug fix for SYNC extended rectangle
    バージョン 9.95 2023.08.04
    - added Hotkey F for FVG - Fair Value Gap
    バージョン 9.94 2023.08.03
    - update for Rectangle position changer indicator
    バージョン 9.93 2023.07.28
    - bug fix TF colors for: new created objects, Click SD, Click FVG
    バージョン 9.92 2023.07.24
    - new button "Click FVG". When click on candle with FVG - Fair Value Gaps, then draws the price imbalance rectangle (FVG; ICT Fair Value Gaps Imbalances)
    VIDEO: https://www.youtube.com/watch?v=pBRXTKNIMAk
    バージョン 9.91 2023.07.16
    - NEW input variable "SYNC: Copy object Time Frame settings from Master to Slave"
    VIDEO: https://www.youtube.com/watch?v=j1JFTERPWXo
    バージョン 9.90 2023.06.30
    - big fixes
    バージョン 9.89 2023.06.10
    - bug fixes for Rectangle Split function
    VIDEO: https://www.youtube.com/watch?v=r9p1HhjVMhg
    バージョン 9.88 2023.05.28
    - NEW trendline button "Retest" used for breakout and retest strategy. Breakout Retest function triggers an alert if the candle closes beyond trendline and then price touches trendline for retest in trading.
    VIDEO: https://www.youtube.com/watch?v=A_JOXfpo2Eg
    バージョン 9.87 2023.05.27
    - NEW trendline button "Retest" used for breakout and retest strategy. Breakout Retest function triggers an alert if the candle closes beyond trendline and then price touches trendline for retest in trading.
    VIDEO: https://www.youtube.com/watch?v=A_JOXfpo2Eg
    バージョン 9.85 2023.05.24
    - Fibonacci retracement indicator Multi chart SYNC
    VIDEO: https://www.youtube.com/watch?v=QgvL1lcOigY

    - NEW input "Show hotkeys S,D,H,L,O,C"
    バージョン 9.84 2023.05.24
    - Fibonacci retracement indicator Multi chart SYNC
    VIDEO: https://www.youtube.com/watch?v=QgvL1lcOigY
    バージョン 9.83 2023.05.19
    - input variable "TimeFrame colors for created Rectangle, Trend, HLine, VLine" will change color only for objects created with Trading box Technical analysis indicator
    バージョン 9.82 2023.05.12
    - NEW input variables:
    Extended trendline width - Hotkeys High, Low
    Extended trendline width - Hotkeys Open, Close
    バージョン 9.81 2023.05.06
    - Separate TimeFrame colors for created Rectangles and Lines(Trend, Horizontal, Vertical)
    バージョン 9.8 2023.05.05
    Hotkeys for drawing Support Resistance levels and Supply Demand zones
    Last clicked candle Hotkeys:
    S - Supply
    D - Demand
    H - High
    L - Low
    O - Open
    C - Close

    VIDEO: https://www.youtube.com/watch?v=DAldGe6hO24
    バージョン 9.7 2023.05.01
    - NEW input "Use TimeFrame colors for new created objects" and color selection for each standard timeframe
    VIDEO: https://www.youtube.com/watch?v=OFLsZOWXDhM

    - NEW button "Click SD" with ON//OFF logic for extended rectangle creation when user click on candle. Zone is based on candle High and Low price
    VIDEO: https://www.youtube.com/watch?v=nPRR-_yHfCg

    - Horizontal line "<< Break line" button display optimization for faster history search
    VIDEO: https://www.youtube.com/watch?v=ZxxxSy5bwMc
    バージョン 9.6 2023.04.09
    - button display optimization for non extended rectangles and trendlines
    バージョン 9.5 2023.04.01
    - bug fix for hiding buttons on selected rectangle when using "Rectangle position changer" indicator on same chart

    - input "Extended object text position" replaced by 2 NEW inputs: "Extended rectangle name position" and "Extended trendline name position"
    バージョン 9.4 2023.02.08
    - NEW option "Shift to rectangle & trendline engulf" for input variable "Rectangle << button function"
    - NEW input "Button text color"
    バージョン 9.3 2023.02.05
    - NEW input variable "Rectangle << button function" with option "Shift to rectangle engulf"
    VIDEO: https://www.youtube.com/watch?v=tyAEXGoAyYE
    バージョン 9.2 2023.01.15
    - Vertical Line added to Chart SYNC function
    バージョン 9.1 2022.12.26
    - new input variable "Engulf alert un-fill rectangle"
    バージョン 9.0 2022.12.10
    - SYNC rectangle function now works with Rectangle position changer indicator
    バージョン 8.9 2022.11.19
    - rectangle and trendline alert buttons visible within chart when scrolling left
    バージョン 8.8 2022.11.07
    - bug fixed after renaming object
    バージョン 8.7 2022.11.05
    - CPU usage reduced and chart freeze bug fixed
    バージョン 8.6 2022.11.03
    - performance upgrade that will lower CPU usage on MetaTrader terminal
    バージョン 8.4 2022.10.07
    - NEW option "Right outside" for input variable "Extended object text position"
    バージョン 8.3 2022.10.02
    - NEW input variable "Show 5 additional rename buttons"
    バージョン 8.2 2022.09.26
    - NEW input "Empty rectangle width"

    VIDEO: https://www.youtube.com/watch?v=P8eME8csQZY
    バージョン 8.1 2022.09.17
    - new input variable "Extended object text position" with options (Right, Left)
    バージョン 8.0 2022.09.15
    - new Split % button for rectangles to show premium or discount price like Fibonacci retracement
    - Bands button added for non-extended rectangles

    VIDEO: https://www.youtube.com/watch?v=VNPYUSUUdaA
    バージョン 7.9 2022.09.12
    - object extension bug fix when MetaTrader opens
    バージョン 7.8 2022.09.09
    - NEW inputs added:
    Unfilled extended rectangle style
    Unfilled extended rectangle width

    - 4 NEW color buttons for filled and empty rectangles
    バージョン 7.7 2022.09.02
    - bug fix for Rename button and Timeframe visibility
    バージョン 7.6 2022.08.21
    - new input variable "Chart, alerts and drawings refresh speed"
    バージョン 7.5 2022.08.12
    - new button "Hide text" that hides all texts and alerts on chart
    - "Rename" button now works with SYNC
    - Text position is copied when SYNC button is used for non-extended rectangle or trendline
    バージョン 7.4 2022.08.04
    - "Bands" rectangle function upgraded with (Upper) and (Lower) tag for rectangle Upper and Lower edge
    バージョン 7.3 2022.08.03
    - Rename button added for extended rectangle and trendline
    バージョン 7.1 2022.08.01
    - bug fix for "Trend" and "Hline" button with input variable "TF visibility for newly created rectangle & trendline"
    バージョン 7.0 2022.07.30
    NEW button Rename gives option to rename the zones from the suggested list

    VIDEO: https://www.youtube.com/watch?v=-_5njoa0etk
    バージョン 6.7 2022.05.28
    - update to sync with TBOM tool new functions
    See the new function added to Trading box Order management that allow automation price action within a trading scale:
    VIDEO: https://www.youtube.com/watch?v=Mdw211-Y9b0
    バージョン 6.6 2022.05.09
    - performance upgrade
    バージョン 6.4 2022.04.28
    - NEW button "Trend" and "HLine" that will create trendline and horizontal line in the middle of the chart

    - NEW input variables:
    Show Trend and HLine button (object create)
    Create trendline color - Trend button
    Create trendline style - Trend button
    Create trendline width - Trend button
    Create horizontal line color - HLine button
    Create horizontal line style - HLine button
    Create horizontal line width - HLine button

    Upgrade VIDEO: https://www.youtube.com/watch?v=ScEICIIEEKI
    バージョン 6.2 2022.04.09
    - bug fix and recompile for new Metatrader terminal version
    バージョン 6.1 2022.01.30
    - NEW input variable "Show Filled color buttons"

    - NEW History button that will show the time of last alert in the label. This information is transferred to Technical analysis dashboard where you can see last alerts of all charts in one list

    ***UPGRADE VIDEO: https://www.youtube.com/watch?v=LsTozwEajpk
    バージョン 6.0 2022.01.02
    - NEW input variable "Candle close alert settings" with 2 options:
    1. Current chart TF alert
    2. Alert in TF when Close is clicked
    バージョン 5.9 2021.12.23
    - compliance upgrade for the NEW tool "Rectangle position changer"

    Download: https://www.mql5.com/en/market/product/75865

    VIDEO: https://www.youtube.com/watch?v=IYW1dgOWwRg
    バージョン 5.8 2021.12.06
    - bug fix for input variable "TF visibility for newly created rectangle & trendline" when rectangle is created with click on color button
    バージョン 5.7 2021.11.28
    - Color button rectangle creation improved, after extended color will stay the same
    バージョン 5.6 2021.11.27
    - bug fix for creating rectangles with color buttons when market is closed
    バージョン 5.5 2021.11.27
    - CPU usage reduced that will allow more charts with TBTA in MetaTrader terminal
    バージョン 5.4 2021.11.16
    - bug fix for non extended rectangle Risk Reward tool
    - bug fix when rectangle name is changed and Split function is ON
    - CPU performance improvement when using TBTA on multiple charts
    バージョン 5.3 2021.11.01
    - risk reward tool for non-extended rectangles
    - adding more texts positions (object names) to rectangle and trendline. With button "X" you remove current text
    - if no object is selected then color buttons will create a new rectangle, otherwise the selected object color will be changed

    - NEW "Split" button added that will split extended rectangle with alert trendline (default 50% rectangle size)
    - NEW input "Default rectangle split % (0-100)"
    - NEW input "Split line color"
    - NEW input "Split line style"
    バージョン 5.2 2021.10.22
    - selecting object bug fixed
    バージョン 5.1 2021.10.07
    - upgrade for link with new BACK button on Dashboard tool
    バージョン 5.0 2021.10.07
    - NEW "D" button is added that will show chart with "Technical analysis Dashboard" tool

    FREE Dashboard: https://www.mql5.com/en/market/product/72876

    VIDEO: https://www.youtube.com/watch?v=qzC9jpNshw4
    バージョン 4.8 2021.08.29
    - SYNC button will copy Bands function (if enabled) from Master to Slave rectangle

    - SYNC function in combination with LTF, MTF, HTF buttons will copy timeframe visibility from Master to Slave object when LTF, MTF, HTF button will be assigned to Master object

    - bug fix for SYNC function with combination of input "Visibility for current and lower timeframes"
    バージョン 4.7 2021.08.22
    - NEW "Bands" button will create top and bottom rectangle lines visible on all TF but filled rectangle will be visible only on current TF. This will help you to see HTF levels on lower timeframes.
    Rectangle top and bottom lines will be dashed for higher timeframes and solid for lower timerames.
    When you disable "Bands" button it will restore rectangle TF visibility.

    - NEW "Scale" button that will switch chart to "Fixed scale mode" that gives you option to move freely around the chart vertical and horizontal. It also gives you opportunity to get feeling for price movements

    VIDEO: https://www.youtube.com/watch?v=OwfjWmBzPG8
    バージョン 4.6 2021.08.01
    - improved performance between Trading box tools (Order management, Technical analysis, Rectangle extender, Order box Dashboard)
    バージョン 4.5 2021.08.01
    - bug fix for "X" button display when TBTA is loaded on new chart
    - extended rectangle and trendline buttons display correction for high resolution displays
    バージョン 4.3 2021.07.31
    - bug fix for chart clean up after indicator is removed
    バージョン 4.2 2021.07.29
    - removed input variable "Set larger button text"

    - NEW input variable "Button font size"
    - NEW input variable "Button size scale


    - NEW input "TF visibility for newly created rectangle & trendline"
    1. No automatic timeframe visibility
    2. Visibility for current and lower timeframes

    - SYNC button bug solved: Timeframe visibility was not copied from Master to Slave at object creation
    バージョン 4.1 2021.07.20
    - NEW input variable "Show pip distance in brackets"

    - button click lagging solved
    バージョン 4.0 2021.07.17
    - bug fix when Trading box Order management and Technical analysis are used on the same chart
    バージョン 3.9 2021.07.10
    - NEW input variable "Extended trendline width"
    - NEW input variable "Compression line width"
    - NEW input variable "Ray trendline width"
    バージョン 3.8 2021.07.07
    - larger color and line width buttons when input variable "Set larger button text" is set to TRUE
    バージョン 3.7 2021.07.06
    - NEW input variable "Set larger button text" that will create a little bigger buttons and font size +2
    - NEW input variable "Flat trendline width"
    - NEW input variable "Line width button 1"
    - NEW input variable "Line width button 2"
    バージョン 3.5 2021.06.20
    - NEW input variable "Bring Alerted chart to the top"

    - NEW input variable "Extend new created rectangle"
    - NEW input variable "Extend new created trendline"
    バージョン 3.4 2021.05.25
    - bug fix for button display
    バージョン 3.3 2021.05.16
    - NEW "Text" button that gives options to display rectangle or trendline text in all possible spots around or inside object. This works for non-extended rectangles and trendlines where we would like to have object name displayed in suitable place around or inside object. This is custom show object name function.

    - NEW "SYNC" button (sync chart object or chart sync object) function for selected rectangle, trendline and horizontal line object chart synchronization on the same symbol (charts synchronizer, object sync)
    The selected master object is copied to other charts of the same symbol.
    Object position location and color style is updated from master to slave object and vice versa.
    When you delete master object then slave objects will be deleted and NOT vice versa.
    If you rename master object then you broke connection with slave objects. If you rename slave object then is no longer synced with master object.
    "SYNC" button can also remove synchronization from selected master or slave object.

    - NEW input "Show extra color buttons" that will display 6 "Filled" color and 6 "Empty" color buttons
    - Bug fix: if you click on tickness buton "1" or "2", it will change object from filled to unfilled

    - Safety check warning for too many objects on chart (performance issues) + warning for incompatible indicators

    UPGRADE VIDEO: https://www.youtube.com/watch?v=asGmONlI4EY
    バージョン 3.2 2021.03.27
    - better sync with Trading box Order management v3.0 objects
    バージョン 3.1 2021.03.01
    New input variables added and used when you extend rectangle or trendline:
    - Alert enabled by default
    - Engulf enabled by default
    - Close enabled by default
    - No text enabled by default
    バージョン 2.9 2021.02.17
    - bug fix reported by users
    バージョン 2.8 2021.02.04
    - bug fix for full zoom chart label positions
    バージョン 2.7 2021.02.01
    - input variables description added

    - new input variables:
    - Selected object buttons position
    - Rectangle pip size position
    バージョン 2.6 2021.01.16
    - switching between timeframes bug solved
    バージョン 2.5 2020.12.27
    Important MAJOR performance upgrade and bug fix:
    - CPU load problems solved (better chart and object refresh logic)
    - Ignoring Trading box Order management objects
    - All user bug reports solved
    - Works better with other indicators
    バージョン 2.4 2020.12.09
    MAJOR UPGRADE:
    - added email alert option
    - added 3 new variables to manage alerts and notifications (send_mobile_push_notification, send_email_alert, show_popup_alert)
    - optimized chart refresh rate that will reduce CPU load from 30% up to 500%
    - minor bugs solved and added some additional safe checkups for drawing rectangles and trendlines
    バージョン 2.3 2020.11.06
    - minor bug fix for >> button when used on rectangle
    バージョン 2.2 2020.11.02
    - another bug solved when clicking << button
    バージョン 2.1 2020.11.02
    - bug fix for << button and when rename trendline
    バージョン 2.0 2020.10.30
    - added new input variable extend_if_auto_scroll_off that will give you option to have fixed extended object size if you have auto scroll option diabled
    バージョン 1.9 2020.10.29
    - minor bug fixed when Auto scroll is OFF. Objects are extended to the right side of the chart
    バージョン 1.8 2020.10.14
    - bug fix for Close button, when used on chart with no previusly loaded data on new switched timeframe
    バージョン 1.7 2020.10.04
    - minor bug fix for alert arrows timeframe visibility
    バージョン 1.6 2020.10.03
    - minor bug fix for @ button when search for trendline origin history
    バージョン 1.5 2020.09.27
    MAJOR upgrade
    - new Flat button for trendline (creates horizontal flat trendline)
    - new Close button for rectangle, trendline and ray (alert when current candle closes beyond object price)
    - new R button to enable you repeat alert sound every few seconds (you can set repeat interval in seconds with sound_repeat_seconds_interval)
    - new input parameters for sound repeat alerts for supply, demand, resistance and support (The file must be located in terminal_directory\Sounds. Only WAV files are played)
    - when you click on extended rectangle it shows you Demand or Supply type of rectangle
    - if you extend rectangle around price then you have option to decide if this rectangle is supply or demand
    バージョン 1.4 2020.09.07
    - minor preformance upgrades
    バージョン 1.3 2020.08.12
    - new input parameter button_position is added for placing buttons in different corner positions
    バージョン 1.2 2020.08.08
    - button fix for Demand extended rectangle
    バージョン 1.1 2020.08.04
    - Rectangle and trendline function buttons are now aligned on right side of charts, so they not overlay with other trendlines and rectangles
    - Button positions corrections