MarketStructure MT4

Short description

Swing highs and lows (HH, HL, LH, LL), BOS and CHoCH on two structure sizes, trend state, order blocks and premium / discount zones.

Description

Market Structure marks the swing points of the chart and shows when the structure breaks. It labels every confirmed swing high and low, draws a line when price closes beyond the last swing, and tells you whether the break continues the trend (break of structure, BOS) or turns it (change of character, CHoCH). It does this on two sizes at once: a short internal structure and a larger swing structure. The main settings are on a small button bar on the chart.

What it shows
- Swing labels: HH (higher high), LH (lower high), HL (higher low), LL (lower low).
- BOS and CHoCH: a line from the broken swing point to the bar that broke it, with its label. Swing structure lines are solid; internal structure lines are dashed and labelled iBOS / iCHoCH.
- The trend state of both sizes (bullish / bearish) in the button bar.
- Order blocks (optional): when the structure breaks, the zone of the bar at the origin of the move (the lowest bar before a bullish break, the highest bar before a bearish break). The zone is extended to the right until a close goes through it. The latest three per side are kept (adjustable).
- Premium and discount (optional): the current swing range with its equilibrium (50 %) line, the upper quarter as premium and the lower quarter as discount.

How it works
- A swing high is a bar whose high is above the highs of a number of bars on both sides (the length: 20 for the swing structure and 5 for the internal structure by default). Swing lows work the same way.
- A break needs a bar close beyond the last swing level (or, as an option, the high or low).
- A break in the direction of the current trend is a BOS; a break against it is a CHoCH and turns the trend.

On-chart buttons
- Length - / + (the swing length; in Internal mode the internal length).
- Internal / Swing / Both.
- Labels, order blocks and premium / discount on or off.
- Alerts on or off.
- The bar can be collapsed to one button and placed in any corner of the chart. Your choices are kept for each chart, also after a timeframe change or a restart of the terminal.

Alerts
- Pop-up alert and push notification on a new swing BOS or CHoCH, optionally also on internal breaks. An alert comes once, when the breaking bar closes.

Values for Expert Advisors
- Six buffers: swing trend and internal trend (1 up, -1 down), swing and internal break on the bar (1 BOS up, 2 CHoCH up, -1 BOS down, -2 CHoCH down, 0 none), and the active swing high and low levels.

About repainting
- A swing point is confirmed only when the given number of bars after it have closed, so its label appears that many bars after the swing bar (20 bars with the default swing length). This is a delay by definition, not a change of past values.
- Breaks are evaluated on closed bars only. Once a BOS or CHoCH is drawn, it does not move or disappear. In the Strategy Tester every value was recorded when its bar closed and compared with the history afterwards: no value changed and no break appeared later.

Notes
- Works on any symbol and timeframe. The last 2000 bars are analysed by default.
- The labels and zones describe the past structure of the chart. They are not a forecast and not a trading system; use them together with your own analysis and risk management.

Inputs
- Swing length, internal length, structure to show, break confirmation (close or wick), bars to analyse.
- Labels, order blocks and their number, premium / discount.
- Alerts, push notifications, alerts for internal breaks.
- Bullish and bearish colour, button bar corner, label font size.

The indicator does not trade. No DLL.

추천 제품
Range Predictor
Suvashish Halder
Introducing the Range Predictor : Your Ultimate Guide to Future Trading Ranges! Imagine having the power to see into the future of market moves— Range Predictor brings this dream to life. Designed to deliver real-time, predictive support and resistance levels , this tool goes beyond standard indicators, offering trend direction insights and precise range forecasts . Whether you're a day trader or a swing trader, the Range Predictor is your all-in-one toolkit for mastering the markets. MT5 Ver
Rotation chart for any two indicators: several symbols rotate through four quadrants on up to four timeframes, with trails and a legend. ## Description Rotation Chart shows where a group of symbols stands and where it is moving, all in one window. You choose one indicator for the X axis and one for the Y axis. Every symbol is a point on that plane, with a trail of its last bars, so you see it rotate through the four quadrants: Leading, Weakening, Lagging and Improving. Up to four timeframes a
The MTF Trend Dashboard indicator is a visual technical analysis tool designed for MetaTrader 4 that centralizes the trend status of all timeframes into a single separate window below the main chart. Instead of forcing you to constantly switch charts (from M5 to H4, D1, etc.) to check the macro trend, the indicator calculates real-time crossovers and maps the situation as a graphical matrix of colored bars. Here is a detailed description of its operation and structure: Visual Structure and O
FREE
Short description Polymarket prediction-market odds on the chart: the price range the market prices in for crypto, gold, S&P 500 and oil, and the next Fed decision. Description Polymarket Odds Overlay reads the public prices of the Polymarket prediction markets and draws them on your chart. A prediction-market price is a probability: when "Bitcoin above 62,000 on Friday" trades at 0.30, the market gives it 30 %. The utility collects these prices for the symbol on the chart and turns them int
PriceSniper
Vedran Brkic
La strategia implementata in questo indicatore è un sistema Trend Following Multi-Timeframe (H1/M15) ad alta precisione , progettato specificamente per il trading intraday . Combina l'analisi della struttura macro del mercato (su grafico a 1 ora) con l'efficacia dei pattern candlestick di inversione nel micro-trend (su grafico a 15 minuti). Ecco la scomposizione dettagliata delle regole operative utilizzate dal codice: 1. Filtro Temporale (Intraday) La strategia opera esclusivamente all'interno
FREE
Smart Trade and Order Manager
Md Sakhawat Hossain
4.75 (4)
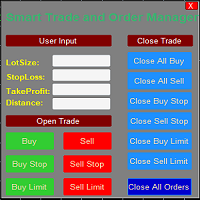
Smart Trade and Order Manager: An Essential Tool for Precision Trading Smart Trade and Order Manager is your trusted trading assistant, meticulously designed to simplify and streamline your trading operations. It empowers traders by enabling swift order execution and effortless order management, allowing you to dedicate your valuable time to in-depth market analysis and decision-making. With just a few clicks, you can initiate various order types, ensuring you are always in control of your tradi
FREE
Forex Gump
Andrey Kozak
2.4 (5)
Forex Gump is a fully finished semi-automatic trading system. In the form of arrows, signals are displayed on the screen for opening and closing deals. All you need is to follow the instructions of the indicator. When the indicator shows a blue arrow, you need to open a buy order. When the indicator shows a red arrow, you need to open a sell order. Close orders when the indicator draws a yellow cross. In order to get the most effective result, we recommend using the timeframes H1, H4, D1. There
The Magic SMA indicator is of great help in determining trend direction. It can be an excellent addition to your existing strategy or the basis of a new one. We humans can make better decisions when we see better visually. So we designed it to show a different color for rising and falling trends. Everyone can customize this in the way that suits them best. By setting the Trend Period, we can optimize it for longer or shorter trends for our strategy. It is great for all time frames. IF YOU NEED
FREE
Short description Turtle trading system: 20/10 and 55/20 Donchian breakouts, N = ATR(20), 2N stop, skip rule, pyramiding and unit size from your account risk. Description Turtle Breakout System shows the classic Turtle trading rules on your chart and keeps track of them for you: the breakout levels for the next entry, the open position with its stop and exit level, the size of one unit for your account, and how the rules have done on this chart so far. The rules follow the Turtle trading ru
AZ Trade Recovery EA MT4 is a hedging-based recovery Expert Advisor designed to manage open positions using a structured Zone Recovery model. The EA applies calculated hedge entries at predefined distance levels (Recovery GAP) and dynamically recalculates a combined Take Profit level for all active trades within the recovery cycle. The system is designed to manage drawdown through controlled position balancing and configurable lot progression models. How the Recovery Model Works An initial trad
Arguably THE MOST PROFITABLE SYSTEM..... WITH EXTREMELY ::::::::::TIGHT STOPLOSS::::::: Introduction PRICE of only 199/- (limited period) - Extremely   TIGHT STOP LOSS   on EVERY TRADE (only 20 pips STOP LOSS) - EXTREMELY HIGH WIN RATIO STILL   :::::::::: 90% ::::::::::::: -   SUPER HIGH PROFITS   ::::::::::: BACK TEST SHOWS 1000 ==> 3.2 million in 13 years -   QUICK SCALPING ... TIGHT SCALPING... IS THE HOLY GRAIL of All Systems   as it has EVERYTHING - 90% WIN RATE - Super high return $ 1000
Uses of EA - Trailingstop: Move stoploss continuously. - Breakeven: Move the stoploss once. Custom parameters: All OrderOpenTime:     + true: acts on all order     + false: only affect the order opened since EA run All OrderType:     + true: acts on all order.     + false: only the order is running (Buy, Sell) TraillingStop: true (Use), false (do not use)     TrailingStop Save (Point)     TraililngStop Distance (Point) BreakEven: true (Use), false (do not use)     BreakEven Save (Point)     Brea
FREE
The Magic SMMA indicator is of great help in determining trend direction. It can be an excellent addition to your existing strategy or the basis of a new one. We humans can make better decisions when we see better visually. So we designed it to show a different color for rising and falling trends. Everyone can customize this in the way that suits them best. By setting the Trend Period, we can optimize it for longer or shorter trends for our strategy. It is great for all time frames. IF YOU NEE
FREE
Quantum Falcon Signal Free is a smart visual trading indicator for MetaTrader 4 designed for Forex and Gold traders. The indicator combines: • Trend analysis • RSI momentum confirmation • MACD momentum filtering • ATR volatility filtering • Higher timeframe confirmation • Smart exit signal detection Main Features: • Smart Buy and Sell signals • Exit Buy / Exit Sell alerts • Real-time dashboard on chart • Professional candle arrows • Multi-timeframe trend confirmation • ATR market volatility filt
FREE
Dominant Candle Finder
Suvashish Halder
5 (1)
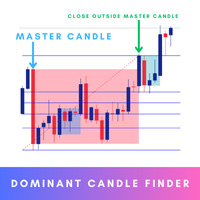
Dominant Candle Finder   is a significant candlestick on a price chart that stands out due to its size, volume, or price movement compared to surrounding candles. It often indicates strong buying or selling pressure and can be used to identify potential reversal points, breakouts, or continuations in the market. Dominant candles can serve as key indicators for traders to make informed decisions, providing insights into market sentiment and potential future price movements. MT5 Version -  https:
Power of Three
Suvashish Halder
4.75 (4)
The "Power of Three" (PO3) is a concept developed by the Inner Circle Trader (ICT) to illustrate a three-stage approach used by smart money in the markets: Accumulation, Manipulation, and Distribution . ICT traders view this as a foundational pattern that can explain the formation of any candle on a price chart. In simple terms, this concept is effective for any time frame, as long as there's a defined start, highest point, lowest point, and end. MT5 -  https://www.mql5.com/en/market/product/124
FREE
Seasonality of any symbol: monthly returns of every year, average and median per month, weekday returns and the seasonal projection on the chart. Description Seasonality Map shows how a symbol has behaved in each month of the past years, and draws the average seasonal path from today's price on the chart. Monthly returns table - One row per year (10 completed years by default, plus the current year), one column per month and the full year, coloured green and red by size. - Under the table,
TT Range
Tomislav Turcin
TT Range – EMA & ATR Channel Indicator TT Range is a trend-following channel indicator built around an Exponential Moving Average (EMA) combined with ATR-based dynamic levels . The core concept is that the EMA acts as a price magnet —when price moves too far away from the average, it has a strong tendency to revert back toward it. The indicator plots adaptive upper and lower levels around the EMA, forming a volatility-based range that adjusts to current market conditions. These levels help trade
FREE
RSI Bands Expert mt4
Alexander Chertnik
Expert Advisor uses Rsi and Bands indicators for generating signals and trades exit. Minimum trading deposit   500 $ . EA optimized to run on GOLD / EURUSD / GBPUSD / USDJPY / AUDNZD 1H charts (sets in the comments) can be also optimized to work on more charts and different timeframes. EA uses Grid. No Martingale. Works with high spread This EA operates only once per bar opening.    developed, tested and optimized   on "   VantageMarkets   " platform. Recommended broker > Vantage
FREE
FVG Detector Pro
Sahib Ul Ahsan
FVG Detector Pro MT5 – Advanced Fair Value Gap Detection Indicator FVG Detector Pro is a professional Fair Value Gap (FVG) detection indicator for MetaTrader 5, designed to help traders identify potential institutional imbalance zones with speed, accuracy, and chart clarity. The indicator automatically detects Bullish and Bearish Fair Value Gaps across all symbols and timeframes, helping traders analyze possible continuation areas, liquidity imbalances, and price reaction zones often used in pr
Where should the pair be, judged by its two currencies in all their other pairs? A fair value line and a cloud built from every cross. Cross Pair Fair Value looks past the chart you are watching. A currency pair is the meeting point of two currencies, and both of them also trade against every other major currency. This indicator asks each of those other pairs where the two currencies stand, and turns the answers into a fair value for your chart. How it works (example: EURUSD) - For every other
TrendEx Pro
Md Abdur Rahim
We do not want to make you confused with an imaginary high profit screenshot from Strategy Tester which has no relation/guarantee of future profit! We just want to tell you the real thing about our EA. TrendEx Pro has been developed to trade on Gold specially, combining multiple strategies algorithm to ensure Trend catching and trading on. It can identify both short and long trends and opens positions accordingly with excellent built-in risk management logic. There is no use of any dangerous met
PipFinite EA Breakout EDGE
Karlo Wilson Vendiola
5 (5)
The Official Automated Version of the Reliable Indicator PipFinite Breakout EDGE EA Breakout EDGE takes the signal of PipFinite Breakout EDGE indicator and manages the trade for you. Because of numerous financial instruments to consider, many traders want the signals to be fully automated. The EA will make sure all your trades are executed from entry to exit. Saving you time and effort while maximizing your profits. The Edge of Automation Effortless price action trading is now possible acros
Reversal Indicator
Augustine Kamatu
2.5 (2)
Have you ever wanted to be able to catch a trend just as it is beginning? This indicator attempts to find the tops and bottoms of a trend. It uses in-built indicators and studies their reversal patterns. It cannot be used on its own it requires Stochastic(14) to confirm signal. Red for sell, Blue for buy. There are no parameters required just attach to a chart and it is ready to go. Check out other great products from  https://www.mql5.com/en/users/augustinekamatu/seller   A Winning Trading Stra
FREE
Position Sizing Indicator is a chart calculator for MetaTrader 5. It tells you how many lots to trade so that a stop loss costs exactly the amount you want to risk, and it shows the reward to risk ratio of the setup. It does not open, modify or close trades. How it works - Three lines appear on the chart: Entry, Stop and Target. Press and drag any of them with the mouse, no double-click needed. - Dragging Entry moves the whole setup. Dragging Stop changes the stop distance. Dragging Target cha
Smart Liquidity Profile
Suvashish Halder
4.45 (11)
The Smart Liquidity Profile is color-coded based on the importance of the traded activity at specific price levels, allowing traders to identify significant price levels such as support and resistance levels, supply and demand zones, liquidity gaps, consolidation zones, Buy-Side/Sell-Side Liquidity and so on.  Smart Liquidity Profile allows users to choose from a number of different time periods including 'Auto,' 'Fixed Range,' 'Swing High,' 'Swing Low,' 'Session,' 'Day,' 'Week,' 'Month,' 'Quar
Rainbow MT4
Jamal El Alama
Rainbow MT4 is a technical indicator based on Moving average with period 34 and very easy to use. When price crosses above MA and MA changes color to green, it’s a signal to buy. When price crosses below MA and MA changes color to red, it’s a signal to sell. The Expert advisor ( Rainbow EA MT4) based on Rainbow MT4 indicator, as you can see in the short video below is now available here .
FREE
PZ Mean Reversion MT4
PZ TRADING SLU
3 (4)
평균 회귀 거래에 대한 전문적이고 정량적인 접근 방식을 구현하는 고유한 지표입니다. 이는 가격이 예측 가능하고 측정 가능한 방식으로 평균으로 전환되고 반환된다는 사실을 이용하여 비정량적 거래 전략을 훨씬 능가하는 명확한 진입 및 퇴장 규칙을 허용합니다. [ Installation Guide | Update Guide | Troubleshooting | FAQ | All Products ] 명확한 거래 신호 놀랍도록 쉬운 거래 사용자 정의 가능한 색상 및 크기 성능 통계 구현 대부분의 거래 전략을 능가합니다. 적절한 SL 및 TP 레벨을 표시합니다. 이메일/음향/시각 알림을 구현합니다. 작동 원리 이 지표는 더 높은 기간에서 완전히 사용자 정의 가능한 이동 평균 주변의 표준 편차를 측정하고 추세 추종 접근 방식을 사용하여 정확하게 거래를 찾습니다. 거래는 현재 차트의 가격 동작을 살펴보고 선택한 더 높은 기간에서 계산된 평균 가격대로 가격이 돌아오면 닫힙니다. 코딩 방식 때문에 지
Royal Dutch Skunk
Sayan Vandenhout
ROYAL DUTCH SKUNK USES THE TREND WAVE INDICATOR AND IT CAN IDENTIFY THE BEGINNING AND THE END OF A NEW WAVE TREND MOVEMENT. AS AN OSCILLATOR, THE INDICATOR IDENTIFIES THE OVERBOUGHT AND OVERSOLD ZONES. IT WORKS GREAT TO CATCH THE SHORT TERM PRICE REVERSALS AND USES A MARTINGALE STRATEGY TO CLOSE ALL TRADES IN PROFIT. USE DEFAULT SETTINGS ON H1 OR HIGHER TIME FRAME ON ANY PAIR FOR MORE ACCURATE TRADES WHY THIS EA : Smart entries calculated by 6 great strategies The EA can be run on even a $20000
Matrix Arrow EA MT4
Juvenille Emperor Limited
5 (8)
Matrix Arrow EA MT4 는 Matrix Arrow Indicator의 MT4 신호를 차트의 거래 패널과 수동 또는 100% 자동으로 거래할 수 있는 고유한 전문가 조언자입니다. Matrix Arrow Indicator MT4 는 다음과 같은 최대 10개의 표준 지표에서 정보와 데이터를 수집하여 초기 단계에서 현재 추세를 결정합니다. 평균 방향 이동 지수(ADX) ,   상품 채널 지수(CCI) ,   클래식 하이켄 아시 캔들 ,   이동 평균 ,   이동 평균 수렴 발산(MACD) ,   상대 활력 지수(RVI) ,   상대 강도 지수(RSI) ,   포물선 SAR ,   스토캐스틱 오실레이터 ,   윌리엄스의 백분율 범위. 모든 지표가 유효한 매수 또는 매도 신호를 제공하면 강력한 상승/하락 추세를 나타내는 다음 캔들/막대가 시작될 때 해당 화살표가 차트에 인쇄됩니다. 사용자는 사용할 표시기를 선택하고 각 표시기의 매개변수를 개별적으로 조정할 수 있습니다. Matri
이 제품의 구매자들이 또한 구매함
Currency Strength Wizard
Oleg Rodin
4.85 (61)
통화 강도 마법사는 성공적인 거래를 위한 올인원 솔루션을 제공하는 매우 강력한 지표입니다. 표시기는 여러 시간 프레임의 모든 통화 데이터를 사용하여 이 또는 해당 외환 쌍의 힘을 계산합니다. 이 데이터는 특정 통화의 힘을 확인하는 데 사용할 수 있는 사용하기 쉬운 통화 지수 및 통화 전력선의 형태로 표시됩니다. 필요한 것은 거래하려는 차트에 표시기를 부착하는 것뿐입니다. 표시기는 거래하는 통화의 실제 강세를 보여줍니다. 지표는 또한 추세와 거래할 때 유리하게 사용할 수 있는 구매 및 판매 거래량 압력의 극한값을 보여줍니다. 지표는 또한 피보나치에 기반한 가능한 대상을 보여줍니다. 표시기는 PUSH 알림을 포함한 모든 유형의 알림을 제공합니다. 구매 후 연락주세요. 나는 당신과 거래 팁을 공유하고 당신에게 무료로 훌륭한 보너스 지표를 줄 것입니다! 나는 당신에게 행복하고 유익한 거래를 기원합니다!
Trend SniperX MT4
Sarvarbek Abduvoxobov
5 (6)
Trend Sniper X 는 트레이더가 명확하고 정확하게 트렌드 방향과 잠재적 반전 지점을 포착할 수 있도록 돕는 MetaTrader 5 전용 멀티 타임프레임 추세 추종 지표입니다. MT5 버전 링크: https://www.mql5.com/en/market/product/181101 가격 안내: 현재 가격은 프로모션 할인가이며, 향후 업데이트 및 새 기능 출시 시 인상될 수 있습니다. Code2Profit 채널 멀티 타임프레임 분석으로 시장을 정복하세요! Trend Sniper X로 승률을 극대화하는 방법: 핵심 규칙 및 세션 팁 기술 사양 플랫폼 MetaTrader 5 지표 유형 멀티 타임프레임 추세 지표 작동 타임프레임 모든 차트 타임프레임 (상위 타임프레임 M1–MN1 독립 선택 가능) 주요 종목 외환(Forex), 골드(XAUUSD) 및 기타 CFD 추천 계좌 모든 계좌 유형 시각화 컬러 추세 캔들 (매수/매도/약세/변화) + 매수/매도 화살표 추가 모듈 세션 마켓 박스 (
M1 Sniper
Oleg Rodin
4.97 (30)
M1 SNIPER 는 사용하기 쉬운 거래 지표 시스템입니다. M1 시간대에 맞춰 설계된 화살표 지표입니다. 이 지표는 M1 시간대 스캘핑을 위한 단독 시스템으로 사용할 수 있으며, 기존 거래 시스템의 일부로도 사용할 수 있습니다. 이 거래 시스템은 M1 시간대 거래용으로 특별히 설계되었지만, 다른 시간대에도 사용할 수 있습니다. 원래는 XAUUSD와 BTCUSD 거래를 위해 이 방법을 설계했지만, 다른 시장 거래에도 유용하다는 것을 알게 되었습니다. 이 지표의 신호는 추세 방향과 반대로 거래될 수 있습니다. 저는 지표의 신호를 활용하여 양방향으로 거래할 수 있도록 돕는 특별한 거래 기법을 알려드립니다. 이 방법은 특별한 동적 지지선과 저항선 가격 영역을 활용하는 것을 기반으로 합니다. 구매하시면 M1 SNIPER 화살표 지표를 바로 다운로드하실 수 있습니다. 또한, 아래 스크린샷에 표시된 Apollo Dynamic SR 지표는 M1 SNIPER 도구를 사용하는 모든 사용자에게 무료로
Smart Trend Trading System
Issam Kassas
4.82 (11)
Smart Trend Trading System은 추세 정보, 진입·청산 신호, 가격 수준을 하나의 차트에 표시하는 MetaTrader 4용 지표입니다. 이 시스템은 추세 감지, 반전 구간, Smart Cloud, 트레일링 스톱 로직, 지지와 저항, 캔들 색상 표시, 알림, 다중 시간대 분석 등 10개 이상의 트레이딩 도구 를 하나의 시스템으로 결합합니다. 이 시스템은 다양한 시장 상황에서 거래를 돕도록 설계되었습니다: 추세장: 주요 추세를 식별하고, 되돌림을 감지하며, 모멘텀을 따라가고, 손절 가이드와 트레일링 스톱 옵션을 사용해 더 깔끔한 진입 지점을 찾습니다. 횡보장: 박스권 시장 상황을 감지하고, 반응 구간을 식별하며, 가격이 중요한 레벨에서 반응할 때 더 명확한 신호를 받을 수 있습니다. 스캘핑 및 인트라데이 거래: 빠른 신호, 캔들 색상, 알림, 다중 시간대 확인을 사용하여 단기 거래 결정을 지원합니다. 주요 기능: • 10개 이상의 인디케이터를 하나의 트레이딩 시스
SIO Oscillator: 자기 최적화 세미분산 불균형 오실레이터 지표를 구매하시면 이를 기반으로 한 전문가 어드바이저(EA)를 무료로 받으실 수 있습니다. 대부분의 오실레이터는 모든 가격 움직임을 똑같이 취급합니다. SIO는 상승 압력과 하락 압력을 분리하여 둘 사이의 불균형을 측정하고, 매수자와 매도자 중 어느 쪽이 실제로 시장을 주도하고 있는지 보여줍니다. 불균형이 극단에 도달하면 SIO는 진입가, 손절(Stop Loss), 익절(Take Profit) 수준이 포함된 명확한 신호를 표시합니다. SIO의 차별점은 고정된 설정에 의존하지 않는다는 것입니다. 내장된 자기 최적화 엔진이 현재 종목과 시간 프레임에 맞는 파라미터를 지속적으로 탐색하고, 사용하기 전에 검증합니다. 두 가지 신호 모드 평균 회귀(Mean Reversion): 불균형의 극단에서 거래하며 균형으로의 복귀를 노립니다. 추세 추종(Trend Following): 지속적이고 우세한 불균형의 방향으로 거래합니다. 자
Liquidity Scalper System
Stanislav Konin
5 (4)
Liquidity Scalper System: 인디케이터 형식의 유동성 기반 트레이딩 시스템입니다. 대부분의 인디케이터는 화살표만 보여주고, 손절을 어디에 둘지, 목표가 어디인지, 신호를 믿어도 되는지는 트레이더가 스스로 판단해야 합니다. Liquidity Scalper System은 거래의 전체 주기를 다룹니다. 유동성 풀을 찾고, 돌파 시 신호를 주며, Entry, Stop Loss와 세 개의 목표를 즉시 계산하고, 패널에 통계와 새로운 데이터에 대한 검증 결과를 표시합니다. 설정은 시스템이 스스로 선택하고 매일 업데이트합니다. 작동 방식 1. 시스템이 유동성 풀을 찾습니다. 시장 참여자들의 스톱 주문이 쌓여 있는 레벨입니다. 2. 가격이 풀을 돌파하고 그 돌파가 움직임의 강도(필요 시 거래량)로 확인되면 차트에 BUY 또는 SELL 화살표가 나타납니다. 3. Entry, Stop Loss, TP1, TP2, TP3 레벨이 영역 채우기와 함께 즉시 그려집니다. 4. 오른쪽에 유
Gann Made Easy
Oleg Rodin
4.84 (174)
Gann Made Easy 는 mr.의 이론을 사용하여 최고의 거래 원칙을 기반으로 하는 전문적이고 사용하기 쉬운 Forex 거래 시스템입니다. W.D. 간. 이 표시기는 Stop Loss 및 Take Profit Levels를 포함하여 정확한 BUY 및 SELL 신호를 제공합니다. PUSH 알림을 사용하여 이동 중에도 거래할 수 있습니다. 구매 후 거래 방법 안내 및 유용한 추가 지표를 무료로 받으시려면 저에게 연락주세요! 아마도 Gann 거래 방법에 대해 이미 여러 번 들었을 것입니다. 일반적으로 Gann의 이론은 초보자 거래자뿐만 아니라 이미 거래 경험이 있는 사람들에게도 매우 복잡한 것입니다. Gann의 거래 방식은 이론적으로 적용하기 쉽지 않기 때문입니다. 나는 그 지식을 연마하고 Forex 지표에 최고의 원칙을 적용하기 위해 몇 년을 보냈습니다. 표시기는 적용하기가 매우 쉽습니다. 차트에 첨부하고 간단한 거래 권장 사항을 따르기만 하면 됩니다. 지표는 지속적으로 시장 분석
Advanced Supply Demand
Bernhard Schweigert
4.91 (302)
현재 30% 할인! 초보자나 전문 트레이더를 위한 최고의 솔루션! 이 보조지표는 우리가 다수의 독창적 기능과 새로운 공식을 통합한 독특하고 고품질이며 저렴한 거래 도구입니다. 이 업데이트를 통해 이중 시간대를 표시할 수 있습니다. 더 높은 TF를 표시할 수 있을 뿐만 아니라 차트 TF와 더 높은 TF 모두를 표시할 수 있습니다: 중첩 영역 표시. 모든 Supply Demand 트레이더들이 좋아할 것입니다. :) 중요한 정보 공개 Advanced Supply Demand의 잠재력을 극대화하려면 다음을 방문하십시오. https://www.mql5.com/ko/blogs/post/720245   진입 또는 목표의 명확한 트리거 포인트를 정확히 찾아냄으로 해서 거래가 어떻게 개선될지 상상해 보십시오. 새로운 알고리즘을 기반으로 매수자와 매도자 간의 잠재적인 불균형을 훨씬 더 쉽게 분간할 수 있습니다. 왜냐하면 가장 강한 공급영역과 가장 강한 수요 영역과 과거에 어떻게 진행 되었는지를(이전
이 지표는 실제 거래에 완벽한 자동 파동 분석 지표입니다! 사례... 참고:   웨이브 그레이딩에 서양식 이름을 사용하는 데 익숙하지 않습니다. Tang Lun(Tang Zhong Shuo Zen)의 명명 규칙의 영향으로 기본 웨이브를   펜   으로 명명하고 2차 웨이브 밴드를   세그먼트   로 명명했습니다. 동시에, 세그먼트에는 추세 방향이 있습니다.   주요 추세 세그먼트에는   이름이 지정되지만(이 이름 지정 방법은 향후 노트에서 사용됩니다. 먼저 말씀드리겠습니다.) 알고리즘은 굴곡 이론과 거의 관련이 없으므로 그렇게 해서는 안 됩니다. 이는 나의 시장 분석을   통해 요약된 끊임없이 변화하고 복잡한 운영 규칙을   반영합니다. 밴드는 더 이상 사람마다 다르지 않도록 표준화되고 정의되었습니다. 인위적인 간섭의 드로잉 방법은 시장 진입을 엄격하게 분석하는 데 핵심적인 역할을 합니다. 이 지표를 사용하는 것은 거래 인터페이스의 미학을 개선하고 원래의 K-line 거래를
현재 30% 할인 ! 초보자 또는 전문가 트레이더를 위한 최고의 솔루션! 이 대시보드 소프트웨어는 28개의 통화 쌍에서 작동합니다. 2가지 주요 지표(Advanced Currency Strength 28 및 Advanced Currency Impulse)를 기반으로 합니다. 전체 Forex 시장에 대한 훌륭한 개요를 제공합니다. 고급 통화 강도 값, 통화 이동 속도 및 모든(9) 시간대의 28 Forex 쌍에 대한 신호를 보여줍니다. 추세 및/또는 스캘핑 기회를 정확히 파악하기 위해 차트의 단일 지표를 사용하여 전체 시장을 볼 수 있을 때 거래가 어떻게 개선될지 상상해 보십시오! 잠재적인 거래를 식별하고 확인하면서 강력한 통화와 약한 통화를 더욱 쉽게 식별할 수 있도록 이 지표에 기능을 내장했습니다. 이 표시기는 통화의 강세 또는 약세가 증가 또는 감소하는지 여부와 모든 시간대에서 수행되는 방식을 그래픽으로 보여줍니다. 추가된 새로운 기능은 현재 시장 조건 변화에 적응하는
Non repaint MT4
Yan Zhen Du
5 (2)
This is a professional chart indicator designed for traders focused on stability and clear price action. It helps filter market noise and provides clear visual entry and exit zones for your trading decisions. Price Information: The current price is promotional and is subject to change as upcoming updates and new features are released. MQL5 public channel:  CLICK HERE for MT5:  Non-repainting MT5 version Core Features: Strictly Non-Repainting: The system is built with strict non-repaint logic. W
Scalper Vault
Oleg Rodin
4.9 (41)
Scalper Vault는 당일 매매(intraday trading)에서 일관된 성과를 내고자 하는 트레이더를 위해 설계된, 강력하고 모든 기능을 갖춘 트레이딩 시스템입니다. 이 고정밀 지표는 외환(Forex) 및 바이너리 옵션 트레이더 모두에게 기관급 분석을 제공하는 독립적인 종합 트레이딩 시스템 역할을 합니다. 구매 후 저에게 연락해 주시면, 트레이딩 팁과 함께 특별한 보너스를 제공해 드립니다! Scalper Vault는 추측에 의존하거나 복잡한 수동 분석을 할 필요를 없애주며, 사용하기 쉬운 트레이딩 기법을 통해 오직 매매 실행에만 집중할 수 있도록 돕습니다. 정확한 추세 추종 신호: 핵심 알고리즘이 시장 구조를 분석하여, 지배적인 시장 추세 방향과 일치하는 고확률 신호만을 제공함으로써 잘못된 진입을 획기적으로 줄여줍니다. 정밀한 고점 및 저점 탐지: 시장의 움직임이 소진되는 지점을 스캔하여 잠재적인 반전 구간을 식별합니다. 간(Gann) 이론 기반의 매수/매도 구간: 수학적
ON Trade Waves Patterns Harmonic Elliot Wolfe를 소개합니다. 이는 수동 및 자동 방법을 사용하여 다양한 시장 패턴을 감지하기 위해 개발된 고급 지표입니다. 다음은 그 작동 방식입니다: 조화적 패턴: 이 지표는 차트에 나타나는 조화적 패턴을 식별할 수 있습니다. 이러한 패턴은 Scott Carney의 "Harmonic Trading vol 1 및 2"에서 설명한 것처럼 조화적 거래 이론을 연습하는 트레이더에게 중요합니다. 수동으로 그리든 자동 감지를 사용하든 ON Trade Waves Patterns가 도움을 줄 것입니다. 컨트롤 패널: 이 지표에는 사용자 친화적인 컨트롤 패널이 있습니다. 차트 및 시간 프레임 설정을 저장하여 다양한 구성 간에 쉽게 전환할 수 있습니다. 차트 공간을 최대화하려면 최소화할 수도 있습니다. 다른 분석 도구를 사용하는 것을 선호하는 경우 닫기 버튼을 클릭하여 모든 지표 데이터를 숨길 수 있습니다. 템플릿 저장: 설정을 사
RFI levels PRO
Roman Podpora
5 (2)
이 지표는 추세 반전 지점과 가격 반등 영역을 정확하게 보여줍니다.       주요 투자자들   . 새로운 트렌드가 형성되는 곳을 파악하고 최대한 정확하게 의사결정을 내리며 모든 거래를 완벽하게 통제합니다. TREND LINES PRO   지표와 함께 사용할 때 최대의 잠재력을 발휘합니다.  VERSION MT5 지표가 보여주는 내용: 새로운 추세의 시작 시 활성화되는 반전 구조 및 반전 수준. 최소한의 위험 대비 수익률을 갖는 이익 실현   (TAKE PROFIT)   및   손절매(STOP LOSS)   레벨 표시       RR 1:2   . 지능형 손실 감소 로직이 적용된 손절매 기능. 지정된 지표에서 두 가지 추세 유형에 대한 반전 패턴을 표시합니다. 지표: 트렌드를 따라   트렌드 라인 프로   (글로벌 트렌드 변화) 트렌드 프로   (빠른 트렌드 변화) 간단하고 효과적입니다       스캐너       실시간 추세 (신규). 다중 시간 프레임 도구 필터링. 표시하다  
Zoryk Gold mt4
Reda El Koutbane
5 (4)
ZORYK — MetaTrader 4용 XAUUSD 전문 신호 및 트레이드 플래닝 시스템 이런 경험이 있을 것입니다. 골드를 분석하고 진입을 기다린 뒤 마침내 포지션을 열었지만 가격이 곧바로 반대 방향으로 움직입니다. 너무 일찍 청산하거나 Stop Loss를 옮기거나 몇 초 동안 망설입니다. 그 후 시장은 내가 없이도 처음 예상했던 목표까지 정확히 움직입니다. 문제는 항상 방향이 아니었습니다. 진짜 문제는 불확실성이었습니다. 정확한 진입 위치를 몰랐습니다. 어느 지점에서 원래의 트레이드 아이디어가 무효가 되는지 몰랐습니다. 가까운 수익을 확보해야 할지 더 큰 움직임을 기다려야 할지 판단하기 어려웠습니다. 현재 setup이 정말 강한지 아니면 단지 새로운 거래를 억지로 찾고 있는지도 확신하기 어려웠습니다. 골드는 매우 빠르게 움직입니다. 명확한 계획이 없다면 좋은 분석도 몇 초 만에 나쁜 결정으로 바뀔 수 있습니다. ZORYK는 이 문제를 해결하기 위해 개발되었습니다.
ShapeRadar MT4
Evgeniy Zhdan
ShapeRadar - 클래식 차트 패턴 인디케이터 ShapeRadar는 기술적 분석의 대표적인 패턴을 차트에서 자동으로 찾아 줍니다. 더블 탑/바텀, 트리플 탑/바텀, 헤드앤숄더와 역헤드앤숄더, 상승 및 하락 쐐기형, 직사각형, 삼각형, 플래그, 페넌트를 지원합니다. 가격이 패턴 경계 밖에서 마감하면 인디케이터가 패턴, 진입 지점, 손절 수준, 목표가를 그려 주며, 정보 패널이 감지된 모든 패턴을 요약해 보여 줍니다. MetaTrader 5 버전:  https://www.mql5.com/en/market/product/208462 모든 심볼과 시간 프레임에서 작동합니다. 신호는 캔들이 마감될 때만 확정되므로, 이미 그려진 표시가 사라지거나 현재 봉에서 다시 그려지지 않습니다. 차트에서 패턴의 위치, 돌파 지점, 진입·손절·목표가를 확인할 수 있고, 패널이 모든 정보를 한곳에 모아 줍니다. 제 채널을 구독해 주세요: https://www.mql5.com/en/channels/algo
PRO Renko System
Oleg Rodin
5 (31)
PRO Renko System 은 RENKO 차트 거래를 위해 특별히 고안된 매우 정확한 거래 시스템입니다. 이것은 다양한 거래 상품에 적용될 수있는 보편적 인 시스템입니다. 체계는 효과적으로 당신에게 정확한 반전 신호에 접근을 주는 소위 시장 소음을 중화합니다. 이 표시기는 사용하기가 매우 쉽고 신호 생성을 담당하는 매개 변수가 하나만 있습니다. 당신은 쉽게 당신의 선택의 어떤 무역 계기에 공구를 적응시킬 수 있고 renko 막대기의 크기. 나는 항상 당신이 내 소프트웨어로 수익성있게 거래 할 수 있도록 추가 지원을 제공 할 준비가되어 있습니다! 나는 당신에게 행복하고 수익성있는 거래를 기원합니다! 구매 후 저에게 연락하십시오! 내 렌코 차트 생성기를 보내드립니다. 또한 내 개인 권장 사항 및 시스템의 다른 모듈을 무료로 공유 할 것입니다!
SR Liquidity
Oleg Rodin
5 (3)
SR Liquidity 는 시장 유동성이 집중되고 가격이 가장 강력하게 반응하는 숨겨진 구간을 포착하도록 설계된 트레이딩 지표입니다. 이러한 특수 유동성 구간은 강력한 지지 및 저항선 역할을 하며, 시장 반전 가능성이 가장 높은 지점을 명확하게 보여주는 지도가 되어 줍니다. SR Liquidity는 일반적인 지지 및 저항선을 단순히 그리는 대신, 실제 가격 움직임을 분석하여 매수 및 매도 압력이 집중되는 구간을 포착합니다. 이러한 구간은 실질적인 시장의 흐름을 주도하는 유동성 풀(liquidity pools)에 해당합니다. 이 지표는 해당 구간을 차트에 직접 시각화하여, 가격 반응이 실제로 나타나기 전에 이를 미리 예측할 수 있도록 돕습니다. 즉, 가격 추세가 전환될 가능성을 사전에 파악하게 해주는 것입니다. 결과적으로 이 지표는 가공되지 않은 가격 움직임(price action)을 시장의 핵심 가격대, 다시 말해 추세 전환점이 될 수 있는 지점들을 보여주는 명확하고 실용적인 로드맵
Auto Optimized SpeedAngle 은 지속적인 워크포워드 최적화(Walk-Forward Optimization, WFO)를 통해 곡선 적합(curve-fitting)을 제거한 기관 수준의 모멘텀 벡터화 시스템입니다. 시장 체제가 바뀔 때 성능이 떨어지는 정적 입력에 의존하는 대신, 이 지표는 표본 외(Out-of-Sample, OOS) 검증을 사용하여 매개변수를 동적으로 재보정하며, 표시되는 신호가 과거의 우연이 아닌 진정한 통계적 우위를 나타내도록 보장합니다. 핵심 기관용 프레임워크 워크포워드 최적화 엔진: 핵심 알고리즘은 수천 가지의 룩백(lookback) 및 임계값 조합을 지속적으로 스캔하며, 데이터를 인샘플(in-sample)과 표본 외(out-of-sample) 세트로 엄격하게 분리합니다. 미지의 데이터 환경에서 수학적 우수성이 증명된 경우에만 새로운 매개변수 구성을 채택합니다. 정량적 목적 함수: 순수한 총이익을 쫓는 대신, 최적화 엔진은 기관 수준의 안정성
Professional Volume Profile An indicator for MetaTrader 4 that builds a horizontal Volume Profile directly on the price chart. It shows the levels where traders executed the most trades, helping to identify support/resistance zones and assess the balance of power in the market. What the Indicator Displays POC (Point of Control) — the level with the maximum trading volume (red line). VAH / VAL (Value Area High / Low) — the upper and lower boundaries of the value area, where 70% of the volume was
Italo Volume Indicator
Italo Santana Gomes
4.92 (79)
BUY INDICATOR AND GET EA FOR FREE AS A BONUS + SOME OTHER GIFTS! ITALO VOLUME INDICATOR  is the best volume indicator ever created, and why is that? The Indicator works on all time-frames and assets, indicator built after 7 years of experience on forex and many other markets. You know many volume indicators around the internet are not complete, does not help, and it's difficult to trade, but the Italo Volume Indicator is different , the Italo Volume Indicator shows the wave volume, when market
고급 수학 계산을 바탕으로 가장 가능성이 높은 단기 가격 움직임을 추정합니다. 특징 차트 시간 프레임과 그보다 높은 모든 시간 프레임에서 즉각적인 가격 움직임 추정; 실제 시장 추세 계산; 가장 중요한 지지 및 저항 레벨 계산; 레벨 밀집 구간, 레벨 돌파, 추세 변화 알림; 시스템 자원 부담이 적음: 선과 패널은 값이 바뀔 때만 업데이트; 자동 조정: 모든 종목과 모든 시간 프레임에서 작동하며, 조정할 파라미터가 없음; 같은 차트의 다른 지표, EA, 스크립트와 함께 작동. 소개 일반적인 트레이딩 전략을 이루는 고전적인 지표 대부분은 단순한 수학에 기반합니다. 이는 그 지표들이 만들어질 당시 뛰어난 수학자가 없었기 때문이 아니라, 컴퓨터가 없었거나 복잡한 수학 연산을 지속적으로 수행할 만한 처리 능력이 없었기 때문입니다. 오늘날에는 어떤 스마트폰이라도 불과 수십 년 전의 가장 강력한 컴퓨터를 훨씬 능가합니다. Advanced Price Movement Predictor(APMP
Atomic Analyst
Issam Kassas
5 (14)
Atomic Analyst — MetaTrader 4 제품 문의, 설정 안내 또는 기술 지원이 필요하면 MQL5에서 직접 메시지를 보내 주세요. 이 인디케이터는 복잡한 시장 계산을 단순한 시각적 신호, 색상 표시 캔들, 추세 판독, 손절 레벨 및 여러 익절 구간으로 변환하여 트레이더가 빠르게 이해하고 실제 시장 상황에서 사용할 수 있게 합니다. 주요 거래 용도: 스캘핑 및 인트라데이 거래: 빠른 의사결정, 명확한 화살표, 알림, 캔들 색상 및 구조화된 진입/청산 구간을 위해 설계되었습니다. 데이 트레이딩 및 스윙 트레이딩: 추세 방향, 강도, 모멘텀 및 다중 시간대 분석을 사용하여 더 큰 시장 움직임을 따라갈 수 있도록 돕습니다. 주요 기능: • Price Action, 강도 및 모멘텀 분석 • 다중 시간대 추세 스캐너 • 전체 추세 비율 계산 • 매수 및 매도 화살표 • 손절 및 여러 익절 레벨 • 최대 5개의 피보나치 기반 익절 레벨 • 트레일링 스톱 로직 • 추세 및 모멘텀
Scalping Entry Points
Vitalyi Belyh
5 (1)
Scalping Entry Points - is a manual trading system that can adjust to price movements and give signals to open trades without redrawing. The indicator determines the direction of the trend by the central level of support and resistance. The dot indicator provides signals for entries and exits.  Suitable for manual intraday trading, scalping and binary options. Works on all time frames and trading instruments. The indicator gives several types of alerts. How to use the product The blue line det
Dinapoli Package MT4
Samil Bozuyuk
3 (2)
All in One package includes the  Oscillator Predictor ,  MACD Predictor ,  Thrust Scanner  and  Advanced Fibonacci  indicators which are mandatory for applying  Dinapoli  trade plans.  Please visit below links for detailed explanations of indicators. Advanced Fibonacci Indicator =>  https://www.mql5.com/en/market/product/52834 Thrust Scanner Indicator => https://www.mql5.com/en/market/product/52830 Overbought /Oversold Predictor indicator => https://www.mql5.com/en/market/product/52621 Macd P
True Direction Oscillator
Muhammad Elbermawi
4.85 (364)
또는 (TDO) "순수 모멘텀 "의 원리를 사용하여 가격 변화율을 측정하는 지수입니다. 유가 증권 가격이 10에서 15로 상승하면 가격 변동률은 150%이지만 15에서 10으로 다시 하락하면 가격 변동률은 33.3%에 불과합니다. 이것이 "가격 변화율"(ROC) 또는 "모멘텀"과 같은 기술적 분석 지표가 내림차순에 제공된 것보다 상승하는 가격 움직임에 대해 더 높은 수치를 제공하는 이유입니다. TDO는 트레이더가 모멘텀을 올바르게 읽을 수 있도록 이 문제를 수정합니다. 중요한 정보 TDO 사용자 매뉴얼: https://www.mql5.com/en/blogs/post/717970 TDO FAQ : https://www.mql5.com/en/blogs/post/722015 TDO 비디오 라이브러리: https://www.mql5.com/en/blogs/post/722018 TDO 전문가 고문 예: https://www.mql5.com/en/blogs/post/731141 TDO
Quantum Imbalance Profiles 는 균형과 불균형 국면을 보여주는 지표입니다. 시장이 어느 가격에서 거래량을 소화했는지, 그 구간에서 어느 쪽이 우세했는지, 그리고 이후 가격이 어떤 레벨을 통해 임펄스로 확장했는지를 보여줍니다. 일반적인 거래량 프로파일은 "어디서 거래가 이루어졌는가"라는 한 가지 질문에만 답합니다. 각 가격에서 어느 쪽이 우세했는지, 박스권이 어떻게 끝났는지, 시장이 어느 방향으로 빠져나갔는지는 보여주지 않습니다. Quantum Imbalance Profiles는 프로파일을 Volume Bid/Ask 모드로 구성하며(각 레벨의 거래량을 매도와 매수로 분리), 여기에 독자적인 불균형 프로파일, 즉 임펄스 확장의 가격별 분포를 더합니다. 거래량 프로파일과 델타는 균형 국면을, 불균형 프로파일은 그로부터의 이탈을, 캔들 위의 델타 버블은 종목의 평상 수준 대비 공격성의 급증을 나타냅니다. 균형과 불균형 시장은 두 상태를 번갈아 오갑니다. 균형 상태에서는
Serial Signal Indicator
Vitalyi Belyh
5 (1)
Indicator for manual trading and technical analysis for Forex. It consists of a trend indicator with the opening level of the trading day and a arrow indicator for determining entry points. The indicator does not recolor; it works when the candle closes. Contains several types of alerts for signal arrows. Can be configured to work on any chart, trading instrument or time frame. The work strategy is based on searching for price movements along the trend.  To make " Buy " transactions: The tre
Currency Strength Matrix
Raymond Gilmour
4.5 (26)
THE ONLY CURRENCY STRENGTH INDICATOR BUILT ON PRICE ACTION Most currency strength meters average an oscillator, or measure how far price has travelled. But these are not accurate measures of trend, Currency Strength Matrix measures trend strength, not just if a currency price has gone up or down. Currency Strength Matrix reads market structure . For each of the 28 major pairs it finds the confirmed cycle highs and lows, and decides whether that pair is in an uptrend, a downtrend, or neither. A
Dark Support Resistance  is an Indicator for intraday trading. This Indicator is programmed to identify  Support and Resistance Lines , providing a high level of accuracy and reliability. Key benefits Easily visible lines Only the most important levels will be displayed Automated adjustment for each timeframe and instrument Easy to use even for beginners Never repaints, never backpaints, Not Lag 100% compatible with Expert Advisor development All types of alerts available: Pop-up, Email, Push
제작자의 제품 더 보기
Shows on the price chart the price at which RSI would reach 70, 50 and 30 on the next bar: RSI levels as lines on the candles. Description: Reverse Engineered RSI turns RSI levels into prices. Instead of an oscillator in a separate window, it draws three lines on the price chart: the close at which the RSI of the next bar would be exactly 70, exactly 50 and exactly 30. How it works: The RSI is calculated from the average up moves and the average down moves of the last bars. Reverse Engineered
Short description Planetary cycle composite from the real positions of the Moon, Sun and planets, projected into the future with its next peaks and troughs. Description Astro Composite turns the positions of the Moon, the Sun and the planets into one cycle line in a separate window. The positions are calculated in the indicator itself from orbital elements, so the line follows the real sky: the Moon line peaks at the real new Moon, Mercury at its real conjunction with the Sun, and so on. Beca
Trend Stop
Mario Jemic
Trend Stop   Introduction Trend Stop is a simple yet powerful trend-following and stop-placement tool for MetaTrader 4. It calculates the highest high or lowest low of the last N periods and plots a dynamic line that reacts instantly to trend changes. The result is a clean, reliable trend filter and a practical guide for placing optimal stop levels — without unnecessary noise or lag. Whether you’re a trend trader, swing trader, or scalper, Trend Stop helps you stay on the right side of the marke
Fractal Pivot Lines — Indicator Overview  Fractal Pivot Lines is a custom trend-structure indicator for MetaTrader 4 . It automatically connects key fractal highs and lows with dynamic lines so you can see how price is respecting local structure, building channels, and preparing for potential reversals. Instead of staring at dozens of candles and guessing where the real pivots are, the indicator turns fractals into clear support/resistance paths and trend channels . What the Indicator Does C
Shows on the price chart the price at which RSI would reach 70, 50 and 30 on the next bar: RSI levels as lines on the candles. Description: Reverse Engineered RSI turns RSI levels into prices. Instead of an oscillator in a separate window, it draws three lines on the price chart: the close at which the RSI of the next bar would be exactly 70, exactly 50 and exactly 30. How it works: The RSI is calculated from the average up moves and the average down moves of the last bars. Reverse Engineered
Reversing MACD — Indicator Overview Reversing MACD is a forward-looking analytical tool that calculates the exact price the next bar would need to reach for the MACD line and the signal line to cross on the upcoming candle . Instead of waiting for a crossover to occur after the fact, the indicator answers a more powerful question: “At what price will the MACD cross on the very next bar ?” Core Idea Behind the Indicator Traditional MACD reacts to price changes after they occur . A trader only see
Projected Moving Average  A clean and practical moving-average tool designed for traders who want a clearer view of short-term and medium-term trend direction. The Projected Moving Average shifts a standard SMA forward by half of its period, creating a smooth projection zone that updates dynamically with each new candle. This makes it easier to visually anticipate where the moving average is heading without repainting past values. Key Features Forward-shifted SMA (Length/2) for clearer trend pro
Weinstein Stage Analysis (MTF) – Professional Market Structure Indicator This indicator implements   Stan Weinstein’s Stage Analysis   in a clean, modern, and fully   MTF-correct   way for MetaTrader 5. It automatically identifies the four classical market stages: Stage 1 – Base / Accumulation Stage 2 – Advancing Trend Stage 3 – Distribution Stage 4 – Declining Trend Unlike many simplified versions, this indicator: Calculates the trend   on a higher timeframe moving average Projects the correct
Bollinger Trend Lines – MT4 & MT5 Bollinger Trend Lines   is a professional volatility-based trend indicator designed to clearly identify trend direction and dynamic stop levels using Bollinger Bands. Fuses on one core principle: follow the trend, ignore noise, and let volatility define the stop. How it works The indicator builds   trailing trend lines   using Bollinger Bands: In an   uptrend , the   lower band trails price and can only rise In a   downtrend , the   upper band trails pri
Position Sizing Indicator is a chart calculator for MetaTrader 5. It tells you how many lots to trade so that a stop loss costs exactly the amount you want to risk, and it shows the reward to risk ratio of the setup. It does not open, modify or close trades. How it works - Three lines appear on the chart: Entry, Stop and Target. Press and drag any of them with the mouse, no double-click needed. - Dragging Entry moves the whole setup. Dragging Stop changes the stop distance. Dragging Target cha
Draw Gann Fans, Gann Boxes and Gann Grids with one mouse drag, and adjust them with two handles. Gann Toolbox is a mouse-driven drawing tool for MetaTrader. A small panel on the chart lets you pick a Gann Fan, a Gann Box or a Gann Grid, then you press on the chart, drag to the second point and release. It does not open, modify or close trades. Tools - Gann Fan: the standard fan from the first point, scaled so that the 1x1 line runs through the second point. - Gann Box: a box between the two po
Fractals of any size, set with a mouse slider: fractal trend, support and resistance cloud, trend-coloured candles and alerts. The classic fractal needs two bars on each side. Advanced Fractal lets you choose the size: with 2 bars per side you get the usual 5-bar fractals, with 5 or 10 bars per side only the swing points that matter on your timeframe remain. How it works - An up fractal is a bar whose high is not exceeded by the N bars before it and the N bars after it; a down fractal is the s
Where should the pair be, judged by its two currencies in all their other pairs? A fair value line and a cloud built from every cross. Cross Pair Fair Value looks past the chart you are watching. A currency pair is the meeting point of two currencies, and both of them also trade against every other major currency. This indicator asks each of those other pairs where the two currencies stand, and turns the answers into a fair value for your chart. How it works (example: EURUSD) - For every other
Bill Williams zones, Alligator and fractal breaks on one chart: clear BUY / SELL / WAIT labels with entry and stop, final at bar close. BW Zone Signals puts the Bill Williams Profitunity tools together and reads them for you. Instead of five separate indicators, you see one chart with coloured zone candles, the Alligator, the fractals and a label on every bar where a fractal is broken, with the reason, the entry level and the stop. What it shows - Zone candles: green when AO and AC both rise,
One panel, 28 pairs, 6 timeframes, 12 indicators: a colour-coded heat map of trend and momentum states. Click a cell to open that chart. Description Multi Indicator Heat Map shows how one indicator reads across many symbols and timeframes at the same time. Each row is a symbol, each column a timeframe, and every cell is coloured on a five-step scale: strong up, weak up, neutral, weak down, strong down. A sum column adds the timeframes together for each symbol. You choose the indicator on the pan
TPO or volume profile per day, week or session: histogram, letter blocks or letters, with POC, value area, naked POCs and on-chart buttons. Description Market Profile Studio shows where the market spent its time, or where it traded its volume, inside each session. Every session gets its own profile next to the candles, with the point of control (POC), the value area and its high and low (VAH / VAL). The main settings are on a small button bar on the chart, so you can change the view with one
Short description Turtle trading system: 20/10 and 55/20 Donchian breakouts, N = ATR(20), 2N stop, skip rule, pyramiding and unit size from your account risk. Description Turtle Breakout System shows the classic Turtle trading rules on your chart and keeps track of them for you: the breakout levels for the next entry, the open position with its stop and exit level, the size of one unit for your account, and how the rules have done on this chart so far. The rules follow the Turtle trading ru
Short description Polymarket prediction-market odds on the chart: the price range the market prices in for crypto, gold, S&P 500 and oil, and the next Fed decision. Description Polymarket Odds Overlay reads the public prices of the Polymarket prediction markets and draws them on your chart. A prediction-market price is a probability: when "Bitcoin above 62,000 on Friday" trades at 0.30, the market gives it 30 %. The utility collects these prices for the symbol on the chart and turns them int
Harmonic patterns that keep their record: every pattern stays on the chart with its result, with statistics per pattern, BUY / SELL zones and a scanner. Description Most harmonic pattern indicators show you a chart full of perfect patterns. The failed ones were redrawn or removed, so the history looks better than any trader could have traded it. Harmonic Patterns Track Record works the other way round: every pattern is tested the way you would trade it, and every result stays on the chart. H
Places your Buy Stop or Sell Stop again, at the same price with the same SL, every time the trade is stopped out. Description Pending Order Repeater is a trade utility for traders who want to keep a level in play. You set the pending order once. Each time the trade it opens closes at the Stop Loss, the EA places the same order again: same symbol, type, price, lot size, Stop Loss and Take Profit. How it works - Place a Buy Stop or Sell Stop with a Stop Loss by hand, on any symbol. The EA, att
Rotation chart for any two indicators: several symbols rotate through four quadrants on up to four timeframes, with trails and a legend. ## Description Rotation Chart shows where a group of symbols stands and where it is moving, all in one window. You choose one indicator for the X axis and one for the Y axis. Every symbol is a point on that plane, with a trail of its last bars, so you see it rotate through the four quadrants: Leading, Weakening, Lagging and Improving. Up to four timeframes a
Seasonality of any symbol: monthly returns of every year, average and median per month, weekday returns and the seasonal projection on the chart. Description Seasonality Map shows how a symbol has behaved in each month of the past years, and draws the average seasonal path from today's price on the chart. Monthly returns table - One row per year (10 completed years by default, plus the current year), one column per month and the full year, coloured green and red by size. - Under the table,
Renko, Point & Figure, Kagi and Line Break in one window, switched with a button, mirrored on the price chart with signals. ## Description Four chart types that ignore time and show only price movement, in one indicator. Switch between them with the buttons in the indicator window; the same columns are drawn on the normal price chart as boxes (or a Kagi line), with their signals as arrows, so you can see both views at once. Chart types - Renko: a brick for every box of movement, a reversal
Trend Stop  Introduction Trend Stop is a simple yet powerful trend-following and stop-placement tool for MetaTrader 5. It calculates the highest high or lowest low of the last N periods and plots a dynamic line that reacts instantly to trend changes. The result is a clean, reliable trend filter and a practical guide for placing optimal stop levels — without unnecessary noise or lag. Whether you’re a trend trader, swing trader, or scalper, Trend Stop helps you stay on the right side of the market
Fractal Pivot Lines — Indicator Overview   Fractal Pivot Lines is a custom trend-structure indicator for MetaTrader 5 . It automatically connects key fractal highs and lows with dynamic lines so you can see how price is respecting local structure, building channels, and preparing for potential reversals. Instead of staring at dozens of candles and guessing where the real pivots are, the indicator turns fractals into clear support/resistance paths and trend channels . What the Indicator Does
Reversing MACD — Indicator Overview Reversing MACD is a forward-looking analytical tool that calculates the exact price the next bar would need to reach for the MACD line and the signal line to cross on the upcoming candle . Instead of waiting for a crossover to occur after the fact, the indicator answers a more powerful question: “At what price will the MACD cross on the very next bar ?” Core Idea Behind the Indicator Traditional MACD reacts to price changes after they occur . A trader only see
Projected Moving Average  A clean and practical moving-average tool designed for traders who want a clearer view of short-term and medium-term trend direction. The   Projected Moving Average   shifts a standard SMA forward by half of its period, creating a smooth projection zone that updates dynamically with each new candle. This makes it easier to visually anticipate where the moving average is heading without repainting past values. Key Features Forward-shifted SMA (Length/2) for clearer trend
Weinstein Stage Analysis (MTF) – Professional Market Structure Indicator This indicator implements Stan Weinstein’s Stage Analysis in a clean, modern, and fully MTF-correct way for MetaTrader 5. It automatically identifies the four classical market stages: Stage 1 – Base / Accumulation Stage 2 – Advancing Trend Stage 3 – Distribution Stage 4 – Declining Trend Unlike many simplified versions, this indicator: Calculates the trend on a higher timeframe moving average Projects the correct stage onto
Bollinger Trend Lines – MT4 & MT5 Bollinger Trend Lines is a professional volatility-based trend indicator designed to clearly identify trend direction and dynamic stop levels using Bollinger Bands. Fuses on one core principle: follow the trend, ignore noise, and let volatility define the stop. How it works The indicator builds trailing trend lines using Bollinger Bands: In an uptrend , the lower band trails price and can only rise In a downtrend , the upper band trails price and can only
필터:
리뷰 없음
리뷰 답변