Character Band
- 지표
-
Allan Aparece Ninal
 MetaTrader 5용 인디케이터와 전문가 어드바이저(EA)를 개발합니다.
작업 방식:
- 모든 인디케이터는 리페인팅 여부를 확인합니다. 신호는 마감된 봉에서만 결정되며, 모든 틱 테스트로 이후에 바뀌지 않는다는 것을 확인합니다.
- 모든 계산은 독립적인 기준 계산과 봉 단위로 비교합니다.
- 전략은 최적화에 사용하지 않은 데이터로 백테스트합니다. 우위가 없는 규칙은 그렇다고 분명히 밝히고 전략으로 판매하지 않습니다. - 버전: 1.0
Character Band is a free indicator for MetaTrader 5. It draws market structure (swing highs and lows, breaks of structure and changes of character) together with a volatility trend band. A buy or sell arrow marks every change of character, and pullbacks to the band are marked too, with alerts.
It places no orders. Everything comes from closed bars, so an arrow or a structure line never appears and then disappears.
Standalone: everything is built in. You do not need to buy or install any other product named on this page.
Quick start
- Attach it to any chart and timeframe. The default swing size is 10 bars on each side.
- A larger swing size gives fewer, bigger structure breaks. A smaller one follows minor swings.
- Pop-up and push alerts for buy and sell signals are on. Pullback alerts and an alert on every break are optional.
What you see on the chart
- Structure lines: a dotted line from the broken swing to the bar that broke it, labelled BOS (break of structure, with the trend) or CHoCH (change of character, against it).
- The trend band: the lower band in an up trend, the upper band in a down trend.
- Buy and sell arrows: on the closed bar of every change of character.
- Pullback dots: where price touched the band and closed back on the trend side.
How it works
- Swings: a swing high is the highest high with the chosen number of lower highs on each side, so it is known only after those bars closed. Swing lows are the mirror.
- Breaks: a close beyond the newest unbroken swing is a break. When it goes against the current trend it is a change of character, and the trend flips.
- The band: a 100-bar weighted moving average of the close, plus or minus 2 times the 21-bar average of the 14-bar ATR.
- A pullback: in an up trend, the low touches the lower band and the close stays above it (the mirror in a down trend). Marks are at least 5 bars apart.
Who it is for
For traders who read price structure and want the breaks, the trend side and the pullbacks marked the same way on every chart, on any symbol and timeframe.
Inputs
| Input | Default | What it does |
|---|---|---|
| Swing size | 10 | Bars on each side of a swing high or low (1 to 50). |
| ATR period | 14 | For the band width. |
| Basis: WMA period | 100 | The middle of the band. |
| Width: SMA period of the ATR | 21 | Smooths the band width. |
| Width: ATR multiplier | 2.0 | Distance of the band from the basis. |
| Show the band | on | Shows or hides the band. |
| Show BUY / SELL signals | on | The arrows on a change of character. |
| Show pullbacks to the band | on | The pullback dots. |
| Pullbacks: minimum bars between two marks | 5 | Avoids a dot on every bar of a long touch. |
| Show BOS / CHoCH lines | on | The structure lines and labels. |
| Draw objects for the last N bars | 500 | How far back lines and labels are drawn. |
| Bullish / bearish / pullback colour | green / red / amber | Colours. |
| Alert on BUY / SELL, pullbacks, every BOS / CHoCH | on / off / off | Which events alert. |
| Pop-up, sound, push, e-mail | on, off, on, off | Alert channels. |
| Debug log for bug reports | false | Found a problem? |
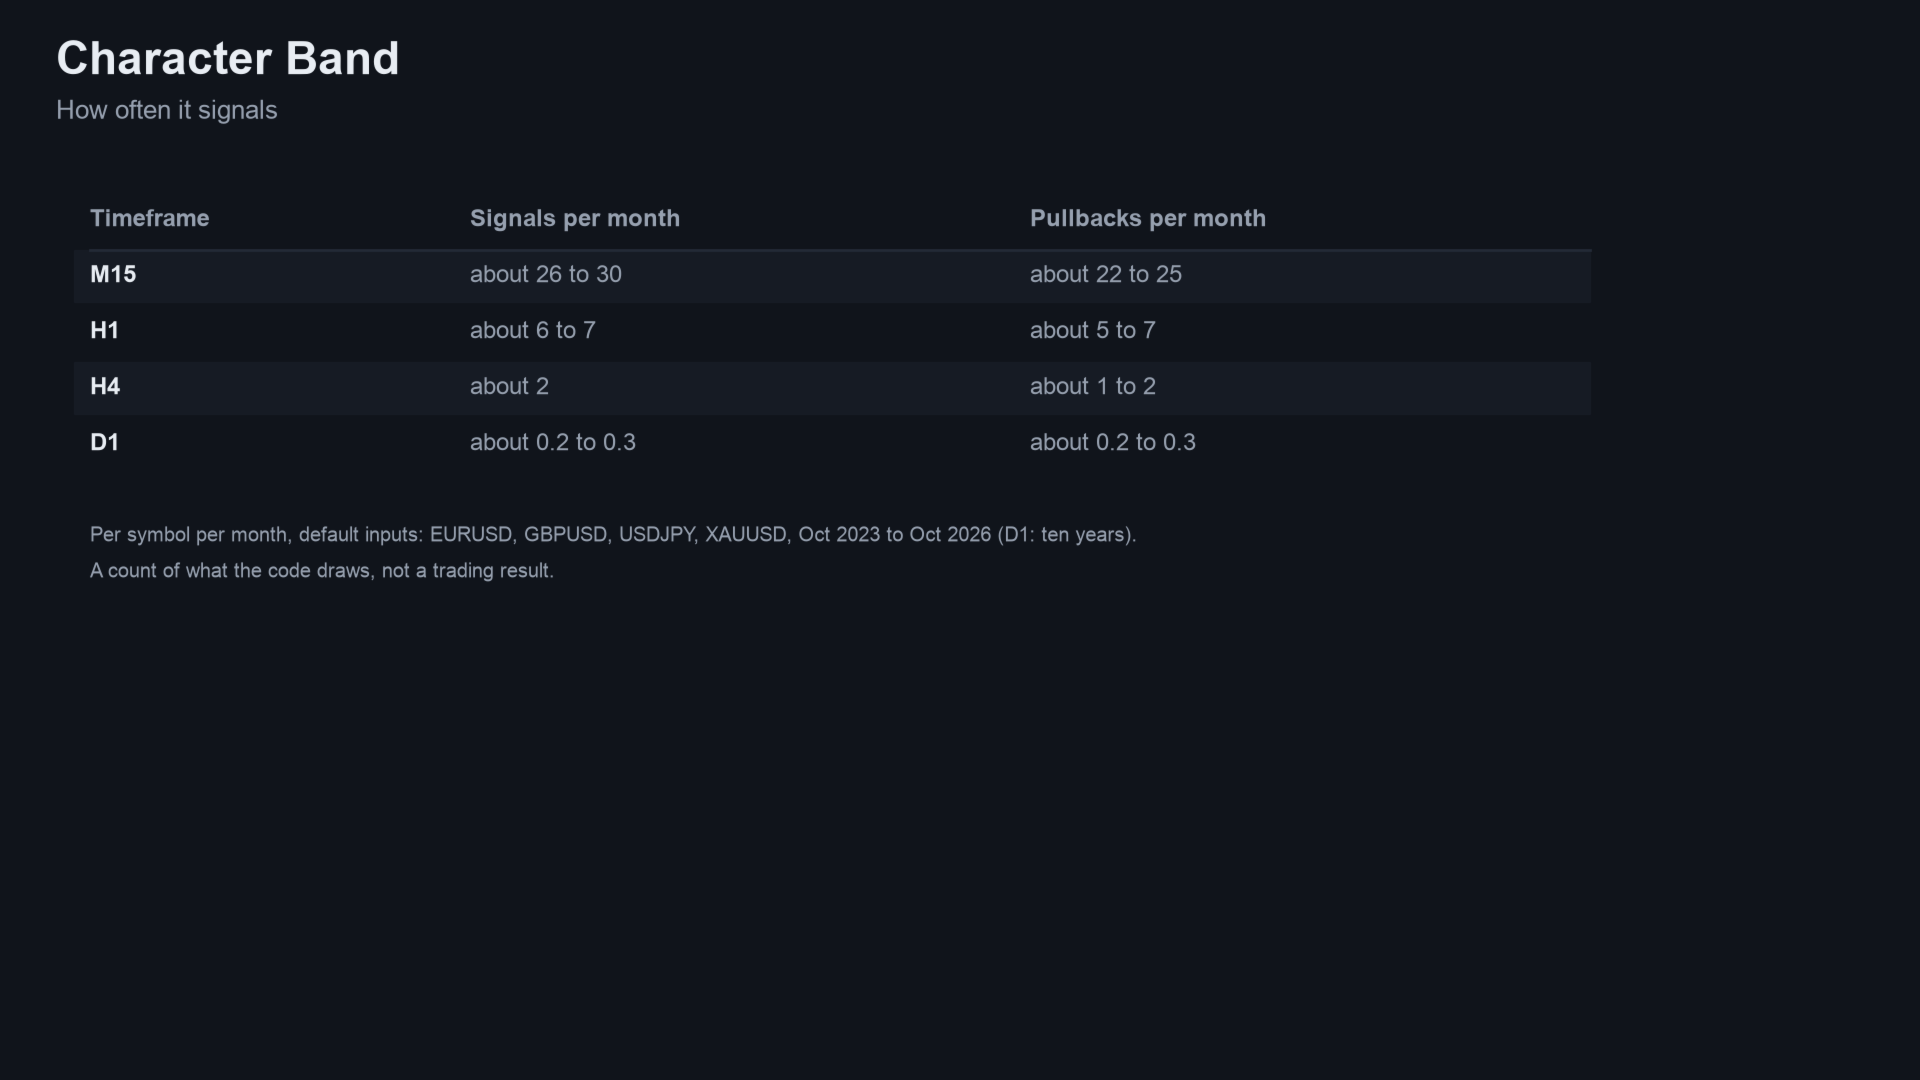
How often it signals
Buy and sell signals per month per symbol with the defaults, on EURUSD, GBPUSD, USDJPY and XAUUSD, October 2023 to October 2026 (D1: ten years), closed bars. A code count, not a trading result.
| Timeframe | Signals per month | Pullbacks per month |
|---|---|---|
| M15 | about 26 to 30 | about 22 to 25 |
| H1 | about 6 to 7 | about 5 to 7 |
| H4 | about 2 | about 1 to 2 |
| D1 | about 0.2 to 0.3 | about 0.2 to 0.3 |
How it was checked
- Non-repainting: in the Strategy Tester on XAUUSD H1, every tick based on real ticks, January to October 2026 (91 million ticks, 4,406 bars), 52 signals appeared. None changed after its bar closed or was drawn on the forming bar.
- Code check: every buffer was compared bar by bar with an independent Python calculation on EURUSD and XAUUSD, D1, H4, H1 and M15. The results were identical.
- No trading claim: the signals were also tested as a mechanical strategy on 31 symbols and three timeframes, with the settings fixed before the test. They showed no edge over chance, so use them to read structure, not as a system on their own.
Alerts and Expert Advisors
One alert per event, on the bar that gives it: pop-up, sound, push notification and e-mail, each switched separately. Nothing is sent while history loads, never twice for the same bar, and not in the Strategy Tester.
Buffers: 0 band in a down trend, 1 band in an up trend, 2 buy arrow (the bar's low), 3 sell arrow (the bar's high), 4 pullback up, 5 pullback down (band price), 6 trend (+1, -1, 0), 7 structure (+1/-1 BOS, +2/-2 CHoCH), 8 signal (+1 buy, -1 sell), 11 band basis. Buffers 9, 10, 12, 13 and 14 are empty in this edition.
Questions
- Does it repaint? No. It uses closed bars only. A swing is confirmed only after the bars on its right side have closed, which is why structure lines start a few bars after the swing itself.
- Why is there no arrow on a BOS? Arrows mark a change of character only. Switch on the BOS / CHoCH alert to hear about every break.
- Does it work on gold, indices and crypto? Yes, on any symbol with history.
Works well with
These are workflow suggestions. I have not found that any pair gives better trading results. You do not need any of them.
| Product | How to use them together | Why |
|---|---|---|
| Risk Position Tool | Pick the trade from the chart, then drag the entry and stop lines. The tool gives the lot for your risk. | It separates where you enter from how much you risk. The tool places no orders. |
| Session Levels | Add it to the same chart. | Session boxes and previous day and week levels as context. It is not a signal. |
Related products
- SMC Zones: the same structure engine with order blocks, fair value gaps and liquidity sweeps instead of a band.
- All my products on MQL5
Found a problem?
- In the inputs, set "Debug log for bug reports" to true.
- Repeat what went wrong.
- Open the Experts tab in the Toolbox. Copy the lines that start with "DBG" and paste them in a comment on this page, with the symbol and timeframe.
- Set the debug log back to false.
The debug lines never contain your account number, name, server, balance or equity.
If it helps your trading, a short review on this page helps other traders find it.
Questions: use the comments on this page or send me a message on MQL5.
Trading involves risk. The indicator shows market structure and a trend band. It does not predict the market, and past signals are no indication of future results.