EA Trading Assistant

🚀 Core Features of the Semi-Automated Trading Panel
This is an institutional-grade trading assistant panel integrating visual order entry, true breakeven calculation, smart grid trading, batch adjustments, and daily/weekly risk control. Compatible with both MT4 and MT5, ensuring flawless trade execution.

🎯 Module 1: Market Trading
Visual Drag-and-Drop Order Entry: Click to generate preview lines, then drag the Take Profit and Stop Loss lines directly on the chart. View real-time Risk/Reward ratios before confirming the order. No more guessing entry points.

Fixed Monetary Risk Position Sizing: Simply input the maximum dollar amount you are willing to risk. As you drag the Stop Loss line, the system automatically calculates the optimal lot size to strictly lock in your risk.

Price Alert Radar: Set target prices for "Rise to" or "Drop to" triggers. The system triggers pop-ups and continuous sound alerts, operating seamlessly in the background even when the panel is minimized, completely freeing up your eyes.

🕸️ Module 2: Pending Orders
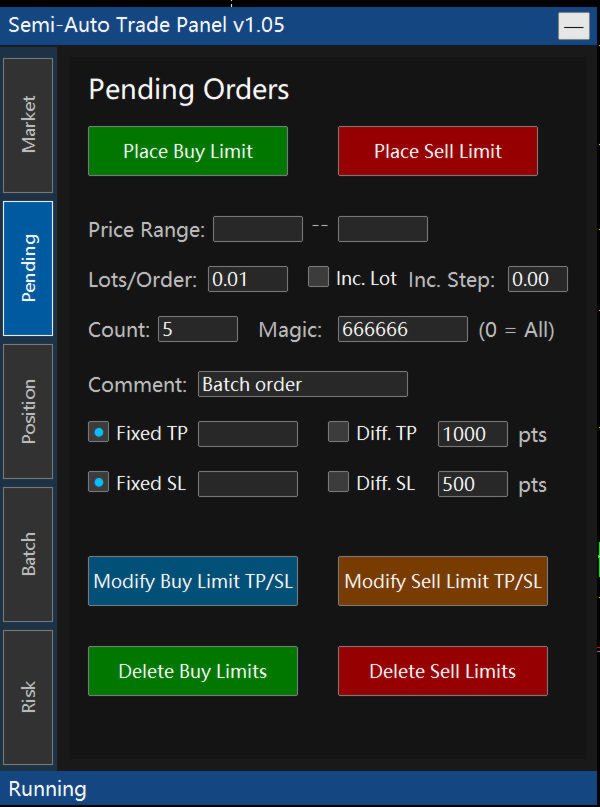
Smart Evenly-Spaced Grid: Input a price range and the number of pending orders, and the EA will evenly distribute them with a single click.

Pyramid Scaling-in: Automatically increases lot sizes as the price goes deeper into the advantageous zone (heavier lots at lower prices for Buy Limit, higher prices for Sell Limit).

Batch Modification of Pending Orders: Modify the TP/SL of existing pending orders by simply entering new values and clicking modify. Leave the field blank to keep it unchanged, or enter zero to clear the TP/SL.

🛡️ Module 3: Position Management
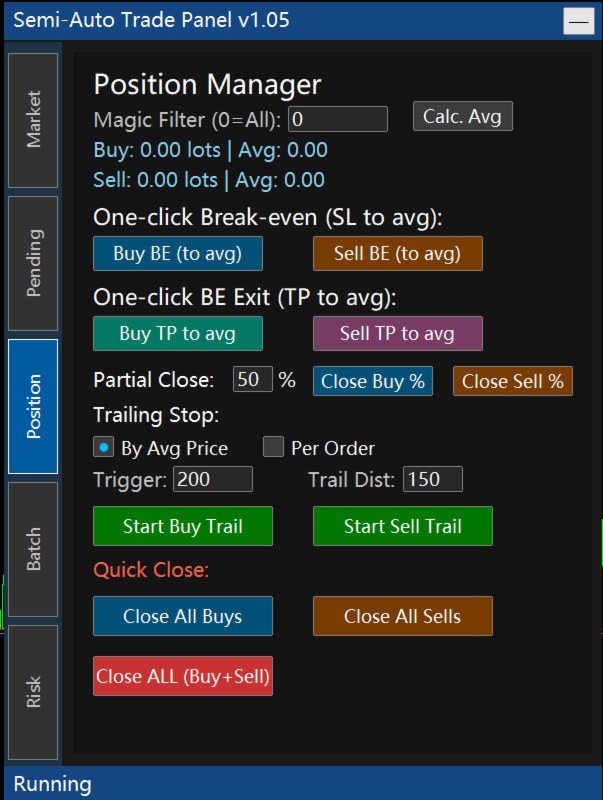
True Breakeven Average Price: A rare algorithm that accurately incorporates overnight swap fees into the average price calculation, ensuring you do not lose a single cent when pushing the Stop Loss to breakeven.

One-Click Breakeven Exit: When in floating loss, push the TP or SL to the average price with a single click to achieve a risk-free exit.

Smart Trailing Stop: Supports trailing based on the aggregate average price or individual order prices. The Stop Loss automatically trails as the market moves in your favor, and the function auto-deactivates once all positions in that direction are closed.

🛠️ Module 4: Batch Modification
Targeted Clearing and Price Shifting: Instantly shift the TP/SL of all positions up or down by a fixed number of points, or pin them to a specific price with a single click.

Smart Safety Validation: Orders without an existing Stop Loss cannot be shifted, and shifted prices that cross the current market price will be intercepted. It prevents any invalid or rejected requests from being sent to the broker.

🚨 Module 5: Risk Control Settings
Dual Defense: Daily and Weekly Limits: Set daily loss limits, daily profit targets, daily maximum trade counts, as well as weekly loss limits and weekly trade limits. Trading is strictly locked once the red line is touched, forcing discipline.

Environment and Position Protection: Features spread protection to prevent fatal slippage during news events, along with a maximum lot size limit to prevent manual typing errors.

Blocks Entry Only, Never Exit: Even if risk control limits are reached, you can still use the "Close All" functions to escape the market. Risk control data automatically resets the next day or the next week.
제작자의 제품 더 보기
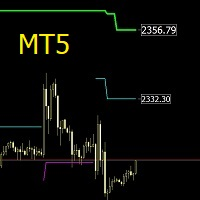
The SuperTrend MTF indicator is an excellent trend tracking indicator . It can not only display SuperTrend trends within the timeframe of the chart, but also set up to display SuperTrend trends for larger time frames simultaneously . This will be beneficial for grasping trends at a larger time scale and predicting future trends . At the same time, the price of the trend line can also be displayed at a glance, making it easy to observe. Input parameters :  ATR period used at chart timeframe     
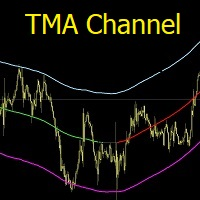
TMA Channel is a price channel obtained through a special calculation method based on traditional TMA . The channel has upper, middle, and lower tracks . When the price approaches or exceeds the upper track, it is already in an overbought state, and attention should be paid to the situation of reversal and decline; When the price approaches or falls below the lower track, it is already in an oversold state, and attention should be paid to the situation of reversal and rise . The indicator will d
Volatility Range is an indicator that calculates the range of volatility, predicting key levels such as potential resistance above and potential support below. The indicator can display volatility forecast ranges for the latest 50 days, 10 weeks, or 4 months. By observing these ranges, you can better identify reliable levels where combining with price action enhances trade accuracy significantly. You have the option to fill the rectangle area with color for easier observation, or leave it unfi
Price Action Scanner is an indicator that identifies price behaviors and provides alerts. This indicator can simultaneously detect signals for up to 6 different symbols across various timeframes. By setting a separator, you can add different symbol names and timeframes. The indicator can detect multiple common signal types such as Pinbar, Engulfing Pattern, Inside Bar, Morning Star, Evening Star, Fakey, and display corresponding information in separate subcharts, indicating the direction of th
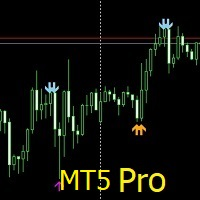
Price Action Scanner Pro is an indicator that identifies price behaviors and provides alerts, offering more features and customization compared to Price Action Scanner   (  https://www.mql5.com/zh/market/product/118937?source=Site+Profile+Seller   )   . This indicator can simultaneously detect signals for up to 15 symbols across different timeframes. You can configure it to detect signals during specific trading sessions such as Asian, European, and US sessions, using different timeframes. This
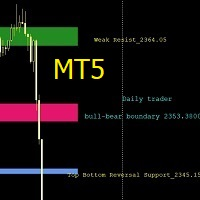
Support and Resistance Levels is an intelligent indicator that displays horizontal support and resistance levels, suitable for traders of different trading frequencies. You can select your preferred trading frequency, and the indicator will automatically calculate the support and resistance levels relevant to that frequency. Among these, the Bull-Bear Line is an interval used to distinguish the strength of bullish and bearish forces, and is an important level. You can combine it with other ind
Core Features of the Semi-Automated Trading Panel 半自动化交易面板的核心功能 This is an institutional-grade trading assistant panel integrating visual order entry, true breakeven calculation, smart grid trading, batch adjustments, and daily/weekly risk control. Compatible with both MT4 and MT5, ensuring flawless trade execution. 这是一个机构级交易助手面板,集成了可视化订单录入、真实的盈亏平衡计算、智能电网交易、批量调整以及每日/周风险控制。兼容 MT4 和 MT5,确保交易执行无误。 Module 1: Market Trading 模块1:市场交易 Visual Drag-and-Drop Order Entry : Click to generate
TMA Channel is a price channel obtained through a special calculation method based on traditional TMA . The channel has upper, middle, and lower tracks . When the price approaches or exceeds the upper track, it is already in an overbought state, and attention should be paid to the situation of reversal and decline; When the price approaches or falls below the lower track, it is already in an oversold state, and attention should be paid to the situation of reversal and rise . The indicator will
Price Action Scanner Pro is an indicator that identifies price behaviors and provides alerts, offering more features and customization compared to Price Action Scanner. This indicator can simultaneously detect signals for up to 15 symbols across different timeframes. You can configure it to detect signals during specific trading sessions such as Asian, European, and US sessions, using different timeframes. This allows you to use lower timeframes for active trading periods and higher timeframes
The SuperTrend MTF indicator is an excellent trend tracking indicator . It can not only display SuperTrend trends within the timeframe of the chart, but also set up to display SuperTrend trends for larger time frames simultaneously . This will be beneficial for grasping trends at a larger time scale and predicting future trends . At the same time, the price of the trend line can also be displayed at a glance, making it easy to observe. Input parameters :  ATR period used at chart timeframe   
Support and Resistance Levels is an intelligent indicator that displays horizontal support and resistance levels, suitable for traders of different trading frequencies. You can select your preferred trading frequency, and the indicator will automatically calculate the support and resistance levels relevant to that frequency. Among these, the Bull-Bear Line is an interval used to distinguish the strength of bullish and bearish forces, and is an important level. You can combine it with other ind
필터:
리뷰 없음
리뷰 답변