SupandResFinderMaster
- 지표
- 버전: 1.0

## What it does
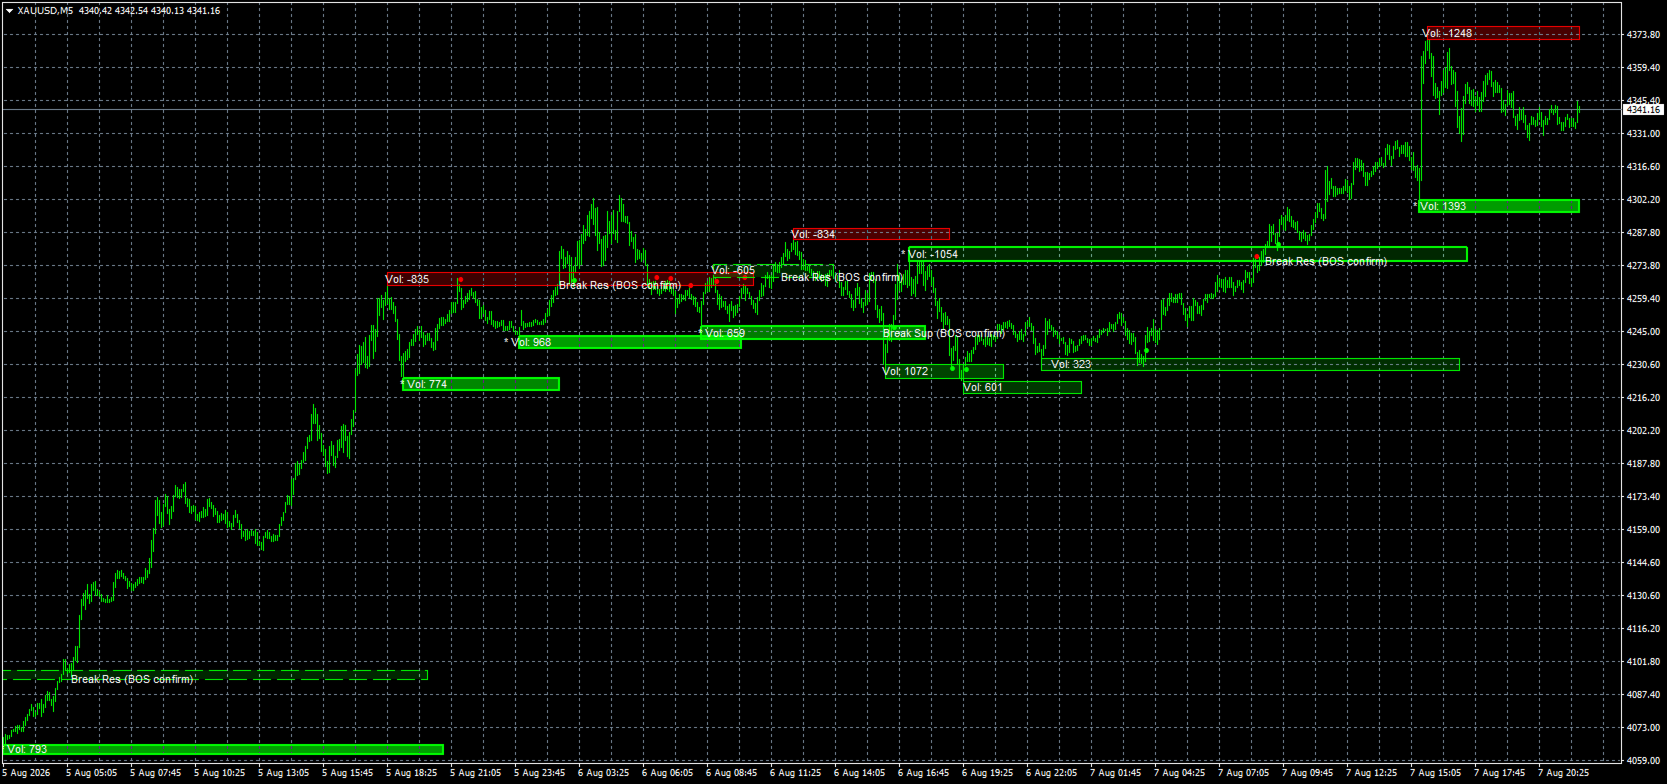
SRLF is an MT4 on-chart indicator that identifies and draws probable support
and resistance zones as shaded boxes. It combines confirmed swing points,
directional tick-volume pressure, and a lightweight market-structure read to
estimate areas where support or resistance is more likely to form.
The indicator keeps the most recently qualified support and resistance zones
active, extends them forward, monitors their interaction with price, and
detects confirmed breaks and role reversals. Older boxes remain visible on the
chart as historical context, but once a newer qualifying zone of the same type
appears, the older one is no longer actively tracked.
When an active resistance zone is decisively broken, it can flip into support.
Likewise, a broken support zone can become resistance.
SRLF also checks whether a newly qualified zone agrees with the current market
structure. Zones backed by both the level-detection logic and the structure
tracker are marked as confluent.
## Important note about volume and "order blocks"
SRLF does **not** claim to detect institutional orders, real order flow, or
true exchange-volume-based order blocks.
Like many MT4 indicators that, for reasons not always technically justified,
use terms such as "Order Blocks" in their names or descriptions, SRLF normally
has no access to centralized real traded volume for the underlying spot FX
market. Standard MT4 Forex data provides broker-side **tick volume** — the
number of price updates observed during a candle — rather than a complete
record of actual buy and sell transactions across the market.
For that reason, SRLF does not pretend to know where large institutional
orders were actually placed.
Instead, it uses the measurable information that is available in MT4 —
confirmed price swings, directional tick-volume behaviour, ATR-based zone
dimensions, subsequent price interaction, and simplified market structure —
to estimate **probable areas where meaningful support/resistance or
order-block-like behaviour may exist**.
In other words, these are algorithmically inferred zones, not directly
observed institutional order locations.
## How it works
- **One shared pivot engine.** A single symmetric pivot-high / pivot-low
detector, driven by `InpLookback`, finds confirmed swing points.
`InpLookback` is used on both sides of the candidate pivot. With the default
value of `20`, a pivot therefore requires 20 bars on the left and 20 bars on
the right before it can be confirmed.
Because the right-side bars must already exist, a pivot is only recognized
`InpLookback` bars after the swing itself occurred.
The same confirmed pivot stream feeds two separate layers:
1. a **directional tick-volume delta proxy**, which decides whether a
confirmed pivot has sufficient recent buying or selling pressure to
qualify as a support/resistance zone, and
2. a **structure tracker**, which follows confirmed swing highs and lows in
the background and maintains a simplified bullish, bearish, or initially
neutral market-structure state.
- **Directional tick-volume filter.** MT4 tick volume is signed according to
candle direction: bullish candles contribute positive volume and bearish
candles contribute negative volume.
This creates a lightweight directional volume-pressure proxy. It is **not**
true bid/ask volume delta and should not be interpreted as institutional
order-flow data.
`InpVolLen` controls the recent comparison window used by this filter.
The volume condition is evaluated when the pivot becomes confirmed, not on
the historical candle where the pivot originally formed.
- **Boxes, not lines.** Each accepted level is drawn as a price zone rather
than a single exact-price line.
`InpBoxWidth` controls the vertical zone thickness using **ATR(200)** as its
volatility reference.
A support zone extends downward from the confirmed pivot low, while a
resistance zone extends upward from the confirmed pivot high.
The visual fill intensity reflects the relative strength of the directional
tick-volume reading used by the level engine.
- **Only the latest zones remain active.** SRLF actively maintains one current
support zone and one current resistance zone.
When a newer qualifying support or resistance is found, it becomes the
active zone of that type. Older boxes remain on the chart for historical
reference, but they are no longer extended or evaluated for new
break/hold events.
- **Lightweight structure tracker.** The structure engine monitors confirmed
swing highs and lows.
A close above the tracked swing high establishes or continues bullish
structure. A close below the tracked swing low establishes or continues
bearish structure.
A break continuing the existing structure is treated as a simplified
**BOS — Break of Structure**, while a break reversing the previously tracked
structure is treated as a simplified **CHoCH — Change of Character**.
The structure state starts neutral until sufficient information becomes
available.
This is intentionally a lightweight structural interpretation and is not
intended to reproduce every definition used in discretionary Smart Money
Concepts methodology.
- **Confluence flag.** A newly confirmed support zone is considered confluent
when the structure tracker is bullish at the time the pivot is confirmed.
A newly confirmed resistance zone is considered confluent when the structure
tracker is bearish at that time.
Confluent zones receive stronger visual emphasis through a brighter fill,
thicker border, and a star indicator in the box label.
`InpShowConfluenceOnly` can hide non-confluent levels and display only zones
where both the level filter and structure condition agree.
- **Strict break confirmation.** SRLF does not consider a zone broken merely
because price temporarily enters it or because the candle closes slightly
beyond one of its boundaries.
A break is confirmed only when a completed candle clears the **entire**
active zone:
- resistance is considered broken when the candle's **low is above the
upper boundary** of the resistance box;
- support is considered broken when the candle's **high is below the lower
boundary** of the support box.
This deliberately requires stronger confirmation than a simple close beyond
the zone.
- **Role reversal.** After a confirmed break, the active zone can switch role:
- broken resistance → potential support,
- broken support → potential resistance.
The box changes its visual state accordingly, and subsequent interaction can
be marked as a hold/retest or reversal of that temporary role.
- **Break labels and structure agreement.** If `InpShowLabels` is enabled,
confirmed breaks can be labelled `"Break Sup"` or `"Break Res"`.
When the direction of the break agrees with the currently tracked market
structure, the label receives an additional structure-confirmation tag.
This should be understood as **directional agreement with the current
structure**, not as proof that the support/resistance break itself
independently constitutes a new BOS event.
- **Optional hold/retest markers.** `InpShowMarkers` allows SRLF to mark
subsequent interactions with broken or role-reversed zones using small
chart markers.
- **Optional structure overlay.** `InpShowStructureContext` draws faint dotted
BOS/CHoCH context lines and labels for detected structural breaks.
This overlay is intended only as supporting visual context and is disabled
by default to keep the chart clean.
- **Deliberately limited scope.** SRLF does not attempt to implement a complete
Smart Money Concepts suite.
There are no FVGs, equal highs/lows, QML patterns, liquidity maps,
institutional order-flow feeds, or buy/sell signal arrows.
Its purpose is narrower: identify probable support/resistance zones from
confirmed swings and directional tick-volume behaviour, then add a simple
market-structure layer to help distinguish ordinary zones from structurally
aligned ones.
## What you can configure
| Group | Parameters |
| --- | --- |
| Core engine | `InpLookback` — shared pivot left/right window |
| Volume filter | `InpVolLen` — directional tick-volume comparison length |
| Zone size | `InpBoxWidth` — vertical zone thickness as an ATR(200) multiple |
| Colors | `InpSupBaseColor`, `InpResBaseColor` |
| Labels/markers | `InpShowLabels`, `InpShowMarkers` |
| Confluence | `InpShowConfluenceOnly` |
| Structure overlay | `InpShowStructureContext`, `InpStructBOSColor`, `InpStructCHoCHColor` |
## Default settings
- `InpLookback = 20`
- 20 bars on the left and 20 bars on the right of a pivot
- `InpVolLen = 2`
- directional tick-volume filter length
- `InpBoxWidth = 1.0`
- zone thickness = 1.0 × ATR(200)
- Support color: **Lime**
- Resistance color: **Red**
- `InpShowLabels = true`
- `InpShowMarkers = true`
- `InpShowConfluenceOnly = false`
- both ordinary qualified zones and structurally confluent zones are shown
- `InpShowStructureContext = false`
- BOS/CHoCH context overlay hidden by default
- BOS line color: **DodgerBlue**
- CHoCH line color: **Orange**
## Interpretation
SRLF should be treated as a **probability and context tool**, not as a direct
view into institutional positioning.
A displayed zone means that the indicator has found a confirmed price swing
which also satisfies its directional tick-volume criteria. A confluent zone
adds agreement with the simplified structure engine.
Neither condition guarantees that real institutional orders are present there.
The purpose of the indicator is to narrow the chart down to areas where,
according to the available MT4 price, tick-volume and structure information,
support/resistance behaviour appears more probable and therefore may deserve
closer attention.