A arca v1
- 지표
- 버전: 1.1
- 업데이트됨: 14 4월 2025
- 활성화: 5

제품명
A arca
주요 기능
-
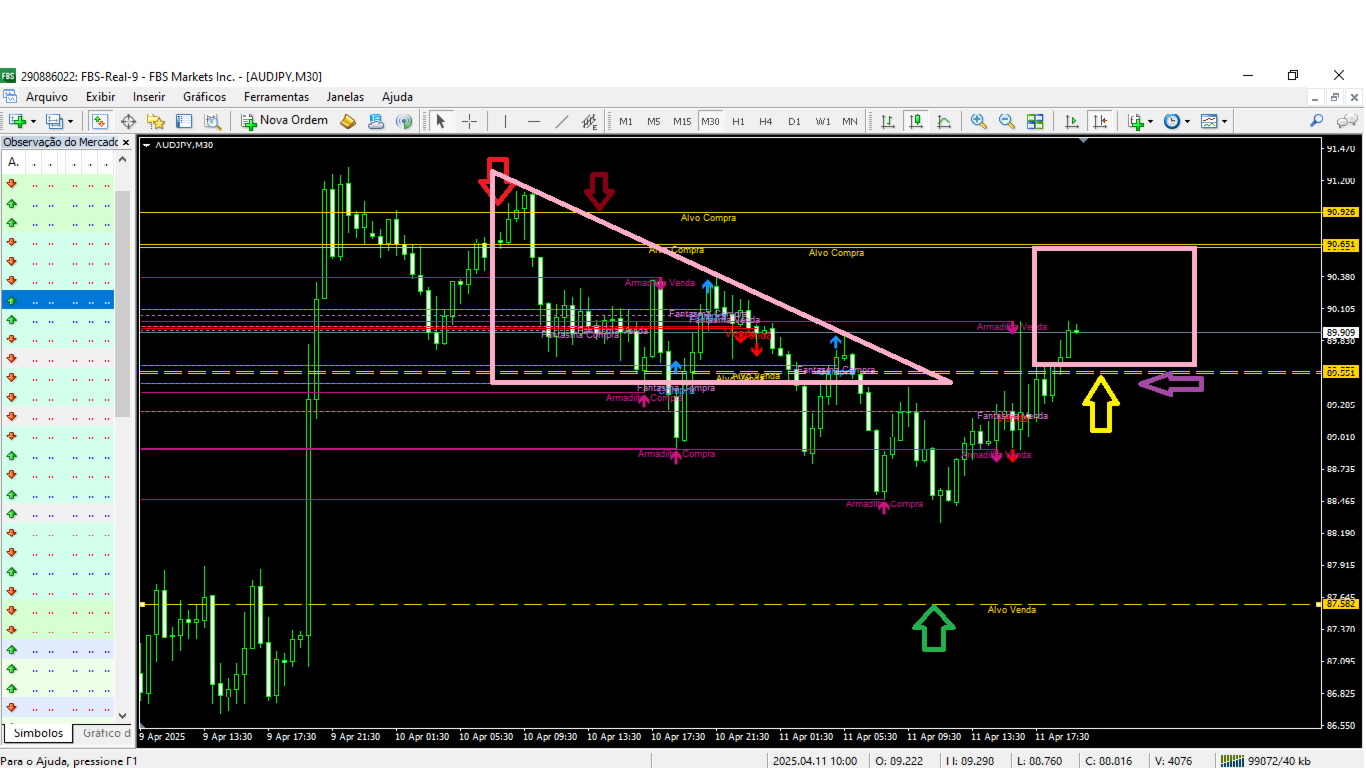
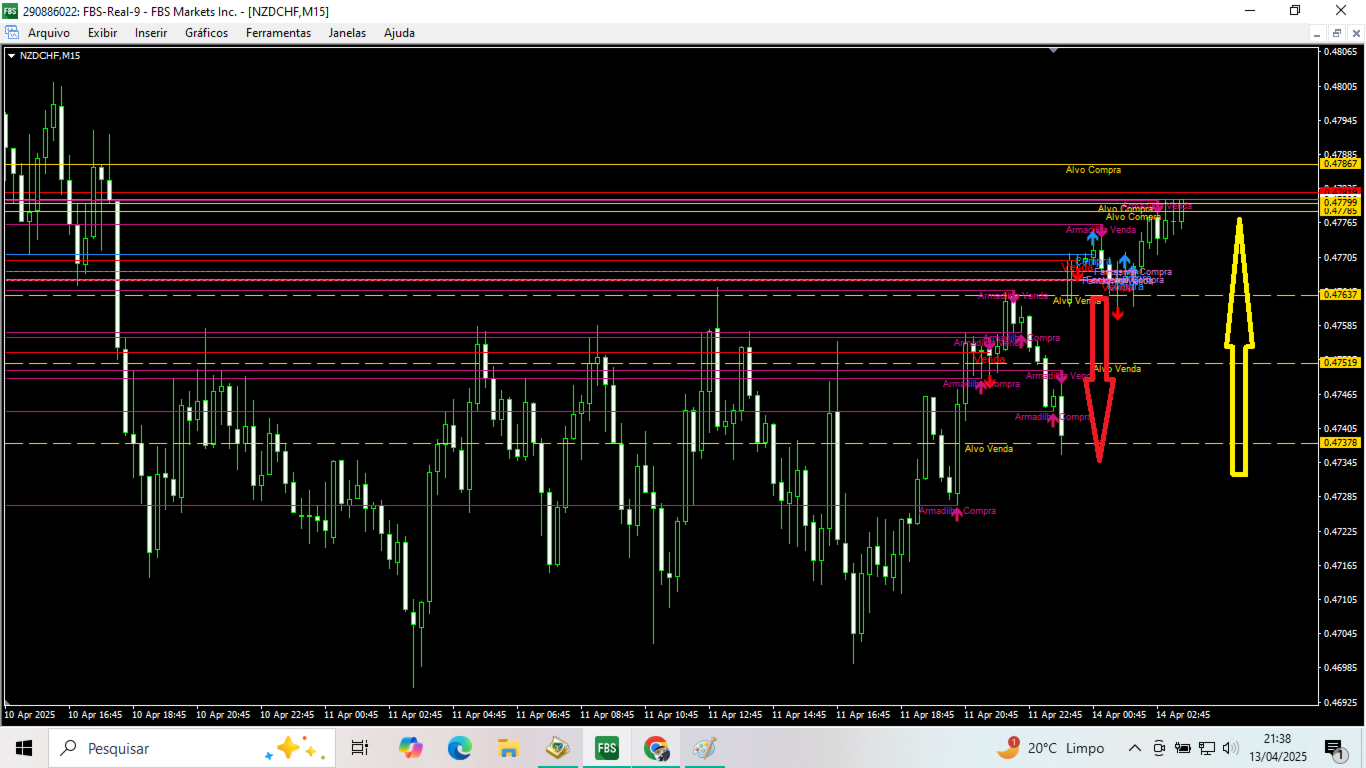
중요 지점 자동 식별
A arca는 지지선과 저항선을 자동으로 감지 및 표시하여, 매수 및 매도 진입/청산 지점을 손쉽게 찾을 수 있도록 도와줍니다. -
명확한 매수/매도 신호 제공
매수와 매도를 나타내는 지표를 표시해 트레이더가 포지션 진입 및 청산 시점을 보다 명확하게 결정할 수 있도록 지원합니다. -
멀티 타임프레임 분석
M5, M15, H1 등 다양한 시간 프레임의 데이터를 종합적으로 분석하여 보다 정확한 시장 판단이 가능합니다. -
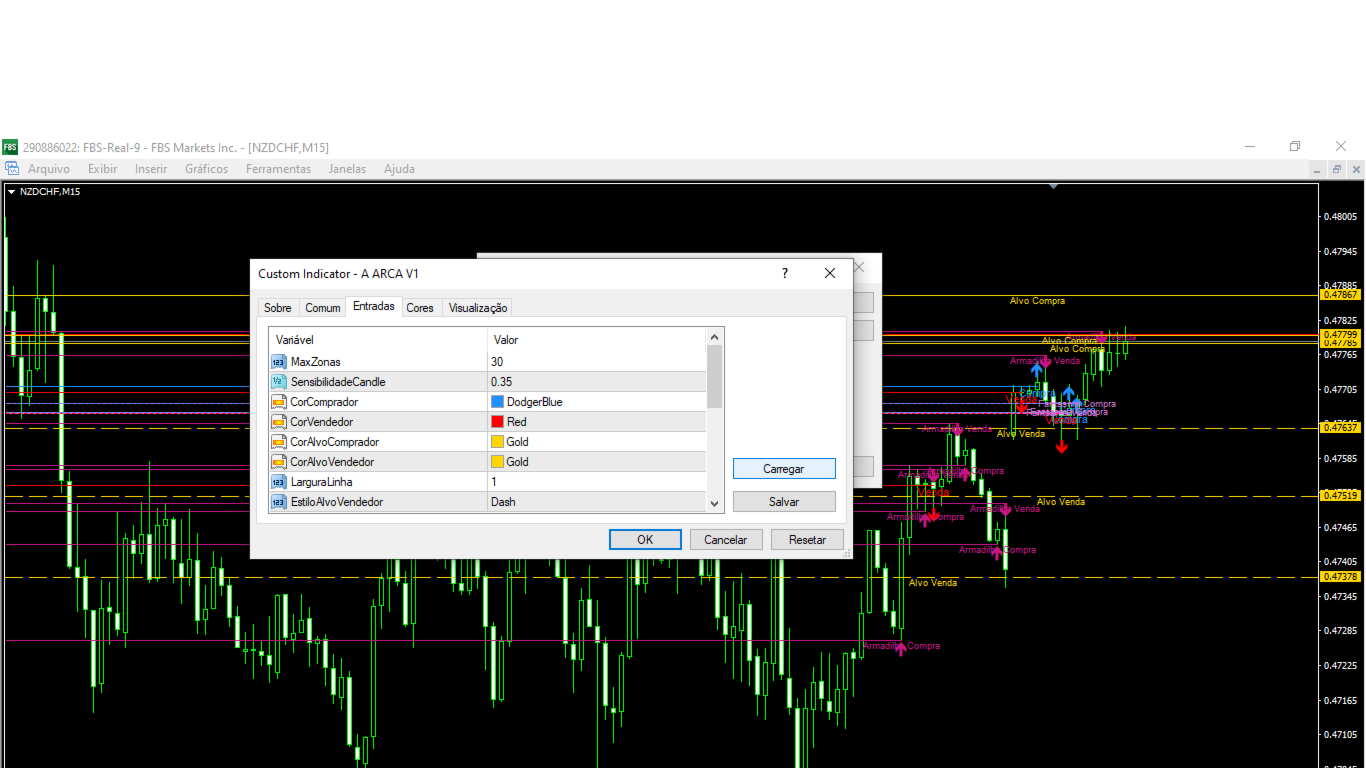
사용자 친화적이고 커스터마이즈 가능한 인터페이스
색상, 선, 레벨 등을 개인 취향과 전략에 맞게 설정할 수 있으며, 자신의 트레이딩 스타일에 최적화된 환경을 구축할 수 있습니다. -
리스크 관리 도구
잠재적 반전 구역을 식별하여 스톱로스(stop-loss)와 테이크프로핏(take-profit)을 쉽게 설정하도록 지원해, 리스크 관리를 효율적으로 할 수 있게 합니다.
이점
-
더 빠르고 정확한 의사결정
자동으로 중요한 지점을 파악하기 때문에 수작업 분석에 들이는 시간을 크게 줄일 수 있어 신속하고 정확한 의사결정이 가능합니다. -
시간과 노력 절약
명확한 시각적 신호를 통해 복잡한 차트 해석보다는 전략과 리스크 통제에 집중할 수 있습니다. -
높은 트레이딩 성공률
멀티 타임프레임 분석과 정확한 신호 제공으로, 성공적인 트레이드를 달성할 확률을 높일 수 있습니다. -
다양성과 유연성
데이트레이딩, 스캘핑, 스윙트레이딩 등 다양한 투자 전략에 활용 가능하며, 폭넓은 투자 성향을 만족시키는 도구입니다.
차별화 포인트
-
지능형 자동화
고급 알고리즘을 활용하여 지지선 및 저항선을 자동으로 인식, 인간의 실수를 최소화합니다. -
높은 커스터마이징 가능
각자의 투자 방법론에 맞춰 세부 파라미터를 조정해 사용할 수 있어, 개인화된 트레이딩 환경을 조성합니다. -
멀티 타임프레임 통합
하나의 화면에서 여러 시간 프레임 정보를 동시에 비교·확인할 수 있어, 시장 상황을 종합적으로 파악할 수 있습니다. -
친숙한 사용자 인터페이스
초보자도 쉽게 접근할 수 있도록 설계되었으며, 숙련된 트레이더에게 필요한 고급 기능도 충분히 갖추고 있습니다. -
정기 업데이트
유저 피드백과 시장 트렌드를 반영한 지속적인 개선으로, 안정성과 최신성을 유지합니다.
주요 타겟
-
단기~중기 트레이더
데이트레이딩, 스캘핑, 스윙트레이딩 등 신속하고 정확한 신호가 필요한 트레이더들에게 적합합니다. -
기술적 분석 중심 투자자
차트 분석과 지표에 의존하여 시장을 예측하는 투자자에게 특히 유용합니다. -
금융 시장 입문자
직관적이고 강력한 분석 도구를 제공하여, 트레이딩의 기초를 배우고 실제로 적용하기 쉽게 해줍니다. -
애널리스트 및 금융 자문가
시장 동향을 빠르게 파악하고 고객에게 전문적인 조언을 제공하기 위해 자동화된 분석 도구가 필요한 전문가들에게 최적입니다.