 MetaTrader 5
 Experts
 지표
 라이브러리
 유틸리티
 위젯
 규칙
MetaTrader 5용 Expert Advisor 및 지표 - 553
 트레이딩 로봇과 지표를 사용하여 외환 거래를 더 수익성 있게 만들 수 있습니다. 트레이딩용 로봇을 사용하면 개점 및 폐점 거래를 자동화할 수 있으며, 지표는 시장 행동을 보다 정확하게 예측할 수 있습니다.
이 페이지에는 MetaTrader 5 응용 프로그램의 카탈로그가 나와 있습니다.
Do you use volume in your reading of the market?
Certainly many traders use it, and do not imagine operating without it.
The Color Histogram Volume Set indicator allows the user to choose the value that he considers interesting to monitor.
When you pass this you will have visual confirmation and if you want you will also have the audible alert that is given by the indicator.
Of course, there are other ways to try to find a high volume, such as assessing whether the volume is above av
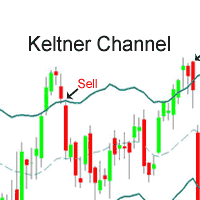
The EA strategy : it is provided wirh built-in Keltner Channel indicator and a Moving Average to ensure the signals. Short and Long positions are treated separetely with different stop levels, lots volume, quantity of simultaneous pending positions and trailing stop loss distances; You should purchase this EA because : it has been tested for a long time; its indicator was deeply improved and optimized; the program is bugs free; it is safe because its efficience is about 94% of assertiveness;
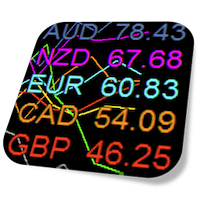
Currency Strength Meter is the easiest way to identify strong and weak currencies. This indicator shows the relative strength of 8 major currencies + Gold: AUD, CAD, CHF, EUR, GBP, JPY, NZD, USD, XAU. Gold symbol can be changed to other symbols like XAG, XAU etc.
By default the strength value is normalised to the range from 0 to 100 for RSI algorithm: The value above 60 means strong currency; The value below 40 means weak currency;
This indicator needs the history data of all 28 major currency
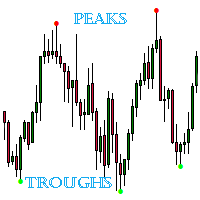
The indicator detects important peaks and troughs (extremes) on the chart. These points can be used to plot support/resistance levels and trend lines, as well as any other graphical analysis. These points can serve as reference points for setting trading orders. The indicator does not redraw .
Settings:
Size_History - the size of the calculated history. Num_Candles_Right - number of candles to the right of the peak or trough.
Num_Candles_Left - number of candles to the left of the peak or
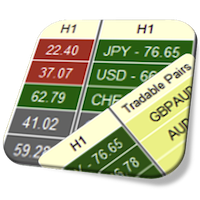
Currency Strength Meter is the easiest way to identify strong and weak currencies. This indicator shows the relative strength of 8 major currencies + Gold: AUD, CAD, CHF, EUR, GBP, JPY, NZD, USD, XAU. Gold symbol can be changed to other symbols like XAG, XAU etc.
By default the strength value is normalised to the range from 0 to 100 for RSI algorithm: The value above 60 means strong currency; The value below 40 means weak currency;
This indicator needs the history data of all 28 major currency
이 다중 시간 프레임 및 다중 기호 표시기는 스토캐스틱 신호 라인이 스토캐스틱 메인 라인을 교차하는 시기를 식별합니다. 대안으로 스토캐스틱이 과매수/과매도 영역을 벗어나는 경우(본선을 가로지르는 신호선 없이) 경고할 수도 있습니다. 보너스로 볼린저 밴드와 RSI 과매수/과매도 교차를 스캔할 수도 있습니다. 자신의 규칙 및 기술과 결합하여 이 지표를 사용하면 자신만의 강력한 시스템을 만들거나 향상시킬 수 있습니다. 특징 Market Watch 창에 표시되는 모든 기호를 동시에 모니터링할 수 있습니다. 지표를 하나의 차트에만 적용하고 전체 시장을 즉시 모니터링하십시오. M1에서 MN까지 모든 시간 프레임을 모니터링할 수 있으며 교차가 식별되면 실시간 경고를 보냅니다. 모든 Metatrader 기본 경고 유형이 지원됩니다. 표시기에는 대화형 패널이 포함되어 있습니다. 설명은 별도의 스크린샷을 참조하십시오. 표시기는 신호를 텍스트 파일에 쓸 수 있습니다. 또는 전역 변수

MACD Master Our MACD Master is the Expert Advisor you were searching for. It is easy to set up and brings Money Management such as automated or fixed Stop loss, risk management with fixed amount or percentage on the Account Balance or Account Equity and the most important for a solid system, the definition of the risk ratio - CRV.
How does the system work? The system is based on the original idea of the MACD. Whenever the fast EMA and the slow EMA of the MACD are crossing a sell or buy signal i
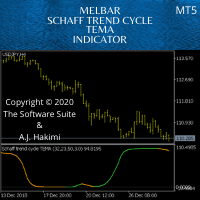
Schaff Trend: A Faster And More Accurate Indicator In Combination With The TEMA MACD - Scalping Systems Advantage
The Schaff Trend Cycle (STC) is a charting indicator that is commonly used to identify market trends and provide buy and sell signals to traders. Developed in 1999 by noted currency trader Doug Schaff, STC is a type of oscillator and is based on the assumption that, regardless of time frame, currency trends accelerate and decelerate in cyclical patterns. https://www.investopedia.c
Chart Slice is a very convenient multi-timeframe indicator, with which you can see market information at once on several time slices. This will allow the trader to learn quickly and most importantly understand the vibrant market . The author himself went this way and this indicator helped incredibly. You probably have often wanted to see in detail why at a given point in time the price was rapidly moving away from a certain level or, on the contrary, stopping there. And for this you had to chan
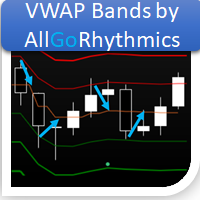
This indicator calculates the Daily VWAP and projects its Bands in 3 upper levels and 3 lower levels (Supports and Resistances), offset by the Standard Deviation selected by the user.
How to configure: Choose the symbol and the desired graphic time; Choose the type of price that is most suitable to calculate the Desired VWAP; Choose whether or not you want the Bands to be plotted; Choose the type of Volume you want to use (Ticks or Real); Choose the type of Calculation of the Bands (Deviation
This indicator allows you to monitor and correlate several assets simultaneously. Using an operational reading technique applied in Multimarkets, the user is able to observe the behavior of other assets visible to the current asset that is operating. With this, the user's ability to make decisions becomes more robust and grounded.
The indicator has the capacity to list up to 4 assets, with the possibility, also, to change the type of quote and be used both for the current price and the past pr

PROMOTIONAL PERIOD - ONLY 2 COPIES LEFT OF FIRST 10 BUYERS AT PRICE 300,00$!!!
CHECK SCREENSHOTS AND COMMENTS FOR OUR STRATEGY RULES AND LIVE TRADES SIGNALS PULL IT BACK is a revolutionary trading system and a complete strategy with advanced algorithm developed to detect the trend direction after a PULLBACK , a RETREACEMENT or a KEY LEVEL BOUNCE . The goal of this indicator is to get as many pips as possible from market trend. Following strictly the rules of the strategy, you can become a

Introduction to Fractal Pattern Scanner Fractal Indicator refers to the technical indicator that makes use of the fractal geometry found in the financial market. Fractal Pattern Scanner is the advanced Fractal Indicator that brings the latest trading technology after the extensive research and development work in the fractal geometry in the financial market. The most important feature in Fractal Pattern Scanner is the ability to measure the turning point probability as well as the trend probabil

Rebate System performs a large number of trades with the minimum profit, which gives the opportunity to earn from receiving rebates (returning part of a spread). It is based on two grids (buy and sell), when one of them is in a drawdown, the other one can enter with an increased lot size, keeping the account away from the drawdown. Differences from the usual EA Rebate System in the mode of closing long-term losing trades in one of the grids due to the previously received profit. Input parameters

The 9-5 Count is designed to track a very powerful cycle that runs through all freely traded markets. This is not a time cycle but a price cycle. The time spent between two points is not as important as the price traveled between them. The 9-5 Count is called that because one complete upward cycle consists of measurement of 9 units plus 5 units of cycle time. This tool takes into account price and pattern together, so it’s more than just a simple cycle. The 9-5 theory classifies market movemen
5 Advantages of Using a Forex Expert Advisor It can trade while you sleep! ... It is not vulnerable to emotions. ... You can run backtests quickly. ... It reacts to quick market movements instantly. ... It isn't prone to human error.
MelBar Take10P AJH Expert Advisor RoboTrade Software MT5 - TEST RESULTS by Independent 3rd. Party
Leverage : 1-500 Initial Deposit US$150-US$300
Timeframe : M30
Period : March 1, 2020 - April 29, 2020
Profit Returns Percentage in 59 DAYS : 50+%-100+% (E

The Larry Wiliams' indicator named WillSpread considers the influence of the secondary Asset (Symbol) on the current Asset (trading). Indicator essence is to transform the correlation between assets in accumulated history data, providing an opportunity to detect various peculiarities and patterns in price dynamics which are invisible to the naked eye. Based on this information, traders can assume further price movement and adjust their strategy accordingly. As exposed on his Book, Larry says: "a
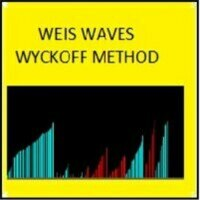
through this indicator you can make analysis and also can to distinguish possible weakness or continuous strength on price, it is an indicator initially developed by David Weis. This version is for the meta trader 5 platform. The Weis Waves indicator is based on volume and is aligned with the price, being able to find not only possible strenght and weakness, but also possible divergences between price and volume, bringing an interesting analysis between both.
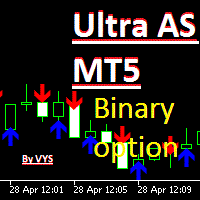
The indicator is designed for binary options trading. The "period" parameter can be adjusted to fit your trading strategy, allowing you to customize the number and quality of signals. A red arrow pointing down indicates a sell signal, while a blue arrow pointing up indicates a buy signal. Recommended expiration time is one candle. You can enter a trade either when the signal appears or on the next candle. Attention: the signal may sometimes disappear on the current candle, so it's important to

RSI Scalper Multi Profit Targets is a Fully automated EA. It uses the RSI indicator for the entries. You can do counter trend scalp (for example sell on 72, and buy on 25) - default (trend buy-sell - false) settings or it can do the same direction trade (trend buy-sell - true).
You can find the best profit targets on backtesting and optimization because it works almost on all pairs on some TF (Time Frame). I personally use it on 5 min, EURUSD, GBPUSD, NAS100, SP500. on 15 min I use on USDCAD.

The strategy which is applied in finance market all around the world is known as CTA strategy. A successful CTA always includes multi-strategies, multi-instruments and multi-timeframe. The series of Multi Instruments TrendSystem (MITS) provide a profitable strategy which can be used in different instruments with different timeframe. Multi Instruments TrendSystem 6 CP (Central Power ) MT5 is a fully automated multi-instrument Expert Advisor. This EA is one of our trend strategies EA, it can be

The strategy which is applied in finance market all around the world is known as CTA strategy. A successful CTA always includes multi-strategies, multi-instruments and multi-timeframe. The series of Multi Instruments TrendSystem (MITS) provide a profitable strategy which can be used in different instruments with different timeframe.
Multi Instruments TrendSystem 5 RA MT5 (Rapier) is a fully automated multi-instrument Expert Advisor. This EA is one of our trend strategies EA, it can be used
The strategy which is applied in finance market all around the world is known as CTA strategy. A successful CTA always includes multi-strategies, multi-instruments and multi-timeframe. The series of Multi Instruments TrendSystem (MITS) provide a profitable strategy which can be used in different instruments with different timeframe.
Multi Instruments TrendSystem 4 M4A1 MT5 is a fully automated multi-instrument Expert Advisor. This EA is one of our trend strategies EA, it can be used on lots of

Gossamer is a moving average ribbon indicator that uses a novel approach to identify breakout trades in trending markets. By applying a progressive period shift to each moving average, levels of consolidation become visible. Enter trades when price breaks out in the direction of the prevailing trend. Stoploss should be located on the other side of the consolidation from the breakout. Profits can be taken at the next consolidation or the stoploss trailed and the position built. Applicable to a

Полностью автоматический советник, на основе индикатора RSI с системой технического анализа на заданную глубину и с учетом текущей ситуации. Особенность данного эксперта в специальном фильтре ложных сигналов, без которого RSI практически бесполезен. Советник не использует методы работы с высоким риском (Мартингейл, сетки ордеров и т. д.). Размер лота автоматически рассчитывается в зависимости от текущего баланса и уставки на каждый минимальный размер лота. Рекомендуется запускать советник с раб

The underlying P.S.-Technical Trading bot is a computer program written in the MQL5 language. The P.S.-Technical Trading bot is a fully automated trading robot based on the two developed technical indicators, ADX and Parabolic SAR, developed by technical analyst Welles Wilder Jr.
If you want to learn more about this, I recommend the book "New Concepts in Technical Trading Systems" which was published in 1978.
In addition, the trading bot eliminates all too understandable emotions during trad
The strategy which is applied in finance market all around the world is known as CTA strategy. A successful CTA always includes multi-strategies, multi-instruments and multi-timeframe. The series of Multi Instruments TrendSystem (MITS) provide a profitable strategy which can be used in different instruments with different timeframe.
Multi Instruments TrendSystem 3 BS MT5 (Blood Sword) is a fully automated multi-instrument Expert Advisor. This EA is one of our trend strategies EA, it can be us
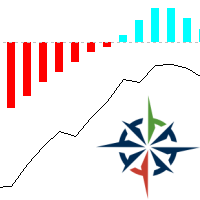
Designed by Fábio Trevisan, VolumeCapacitor is an indicator that, in addition to showing the volume quantity, shows its direction, having as main characteristic, the possible price tops and bottoms, or pullback areas. With its simple but not simplistic calculation method, it is able to determine areas where the defense of long and short positions can be assessed with a simple observation. VolumeCapacitor uses in its unique formula the OBV (Balance of Volume, or On-Balance Volume) idealized by J
The strategy which is applied in finance market all around the world is known as CTA strategy. A successful CTA always includes multi-strategies, multi-instruments and multi-timeframe. The series of Multi Instruments TrendSystem (MITS) provide a profitable strategy which can be used in different instruments with different timeframe. Multi Instruments TrendSystem 2 DM (Dual Moving) MT5 is a fully automated multi-instrument Expert Advisor. This EA is one of our trend strategies EA, it can be used
The strategy which is applied in finance market all around the world is known as CTA strategy. A successful CTA always includes multi-strategies, multi-instruments and multi-timeframe. The series of Multi Instruments TrendSystem (MITS) provide a profitable strategy which can be used in different instruments with different timeframe.
Multi Instruments TrendSystem 1 MT5 (Multi-Moving Strategy) is a fully automated multi-instrument Expert Advisor. This EA is one of our trend strategies EA, it can

Sun Storm MT5 - it is a Secure Automated Software for trade Forex market and indices.
ONLY RECO M ENDED FOR GBPUSD AND EURUSD Can used this EA whit 100$ in your account
The architecture is a Fully Automatic Autonomous Robot Expert capable of independently analyzing the market and making trading decisions
Sun Storm MT5 It is an advanced trading system. This is a fully automatic Expert Advisor. It is a 100% automatic system, the system controls both t
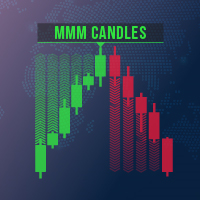
The EA strategy : it is provided wirh built-in indicator based on Japanese Candles arrangements in order to determine the signals and has different inputs for Short and Long positions in order to improve its precision; You should purchase this EA because : it has been tested for a long time; its indicator was deeply improved and optimized; the program is bugs free; it is safe because its efficience is about 70% of assertiveness; it is provided with Trailing Stop Loss technology; it has bad t
Chart Reverse Point is based on moving average, volumes, and a priceaction logic to find the points in which the currency will probably go in a defined direction. Inputs: Alarm ON/OFF: turn on or off alarm on screen. The indicator draws an arrow pointing the direction to follow based on when a specific pattern of bars is found near the moving average and the volumes are higher than a minumun defined by the indicator. Chart Reverse Point can help you to choose the moment to do your trades in a sp
MA Break Point is based on moving average and a priceaction logic to find the points in which the currency will probably go in a defined direction. Inputs: Alarm ON/OFF: turn on or off alarm on screen. The indicator draws an arrow pointing the direction to follow based on when the currency cross a moving average and verify the trend with another ma. MA Break Point can help you to choose the moment to do your trades in a specific direction, strengthening your trading strategy.

Retracement Trend is based on a priceaction logic and volume of the lasts bars. Inputs: Alarm ON/OFF: turn on or off alarm on screen. The indicator draws an arrow pointing the direction to follow based on when a specific pattern of bar's volume is found and the price has a specific direction. Retracement Trend can help you to choose the moment to do your trades in a specific direction, strengthening your trading strategy.
Support Resistance Inversion is based on supports and resistance to find the points in which the currency will probably go in a defined direction. Inputs: Alarm ON/OFF: turn on or off alarm on screen. The indicator draws an arrow pointing the direction to follow based on when the price cross or bounce on a support or a resistance. Support Resistance Inversion can help you to choose the moment to do your trades in a specific direction, strengthening your trading strategy.
Support Resistance Pattern is based on supports and resistance to find the points in which the currency will probably go in a defined direction. Inputs: Alarm ON/OFF: turn on or off alarm on screen. The indicator draws an arrow pointing the direction to follow based on when a specific pattern of bars is found near a support or a resistance. Support Resistance Pattern can help you to choose the moment to do your trades in a specific direction, strengthening your trading strategy.
Stochastic Break Point is based on the stochastic oscillator and moving average to find the points in which the currency will probably go in a defined direction. Inputs: Alarm ON/OFF: turn on or off alarm on screen. The indicator draws an arrow pointing the direction to follow based on when the stochastic line cross the signal line and in which direction it does it, filtered by the moving average direction. Stochastic Break Point can help you to choose the moment to do your trades in a specific

Support Resistance View draws horizontal lines in the current chart that define in real time the values of Supports/Resistances for the timeframe tha you choose. Inputs: Lines color: color of the lines. Timeframe: timeframe for calculations. Support and Resistance are values at which the currency usually inverts the trend or have a breakthrought, so you can use this values to define a strategy for trading.

The Price Channel pattern trading strategy is one of the smartest ways to make money trading. The Price Channel pattern represents two trend lines positioned above (channel resistance) and below (channel support) the price. The price action is contained between these two parallel trendlines. The separation between the two trendlines needs to be wide enough if you want to trade inside the Price Channel Pattern. If this is the case, you can buy at the channel support level and sell at the channel

The Lomb algorithm is designed to find the dominant cycle length in noisy data. It is used commonly in the field of astronomy and is very good at extracting cycle out of really noisy data sets. The Lomb phase plot is very similar to the Stochastics indicator. It has two threshold levels. When it crosses above the lower level it’s a buy signal. When it crosses the upper level it’s a sell signal. This is cycle-based indicator, the nicer waves look, the better the signal. Caution Also It’s really i
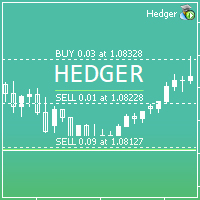
HEDGER MT5 is a Hedge Strategy Expert Advisor. Simply install and use. All other settings can be adjusted according to your wishes and experience.
Configurations: +---------------------------------- HEDGER Settings ----------------------------------+ Magic Number: ID that should be changed if you want to install Expert Advisor on different graphics, without interfering with each other and behaving like a single Expert Advisor. Max Spread By Tick Size: The Max Spread (measured by Tick Si

HCM MT5 the new generation EA. The basic concept is trend following. The EA will detect short-term trend following my research about Price Action signals, basing on the 1-hour bars. Base on my research on history data (big data), the EA operate really good on EUR/USD pair only . Please take it for your information.
BE SIMPLE - BE EFFECTIVE The EA is really easy to use with 2 parameters: Maximun Lot = 0.5 : This is the value of maximum lots that the EA can trade automatically.
% of SL -

Основная цель индикатора заключается в определении наиболее оптимальных точек входа в сделку и выхода из нее. Индикатор состоит из трех частей. Первая – это стрелки, показывающие оптимальные точки входа в сделку и выхода из нее. Стрелка вверх – сигнал на покупку, стрелка вниз – на продажу. В индикаторе заложен алгоритм аналитического анализа, который включает в себя множество показаний стандартных индикаторов, а также авторский алгоритм. Вторая часть – это информация в правом верхнем углу (работ
This tool draws candles at different TIMEFRAME from the 'pattern' displayed on the screen... ...In the 'Standard Chart' M1, he draws the Candles in M15. For example: The 'Standard Chart' in M1, the 'OHLC' in M15 are drawn the Candles (boxes) of M15 behind the candles of M1.
Download the demo version... ...see how it can help you notice Support/Resistance points as well as good moves with highs and lows in the 15M.

Probably the best implementation of “channel breakthrough” idea. Unlike many classic strategies in current Expert Advisor channel is adaptive: the channel with depends on market volatility. This strategy was tested for many years in different markets and systems. You can use the result of more than five years of work.
To start:
Just add Expert Advisor to EURUSD chart with M1 timeframe with default settings. Increase Lots parameter, if you need.
General information:
Expert Advisor paramete
NOTE: The EA open and close trades automatically. It only open one position at a time and close it at high profit or less loss. A next position will be opened whenever the EA Strategy requirements are met. Watch our video to see how it works.
DEFAULT INPUTS: ARE CHANGEABLE Variable Value Warning Use [PIPS] not [POINTS] Trade Size 0.05 Maximum Spread 3.0 Adjusted in OnInit 3 Maximum Stop Loss 20 Maximum Take Profit 0 Audible alerts True Maximum Open Trades 1 Hedging True
B

Major economic news have definite impact on Market Movement and Volatility. These impacts require instant and quick action to be able to cash – in on this volatility. That is why we developed the News Sandwich Expert Adviser to take the pain off you and automatically profit from the Market movement. It is a Set and Leave EA that daily monitors News releases and trade accordingly. There are many News EA out there, but one of the unique feature of this EA is that you can backtest historical Ne

Gold News Reloaded Gold News Reloaded
Expert dedicated to trading based on index movements detecting movements in Gold (XAUUSD). Operative
The EA It has multiple options and I have been testing it for months the signals are published in my profile, It is a Martin Gala very controlled plus the filter by movement of Indices that triggers the order of Buy or Sell, any query does not bother, If you want to rent before buying, we set up a configuration and Broker is recommended to operate.

This Expert Advisor is based on ForexMiracle System (MA,BB,MACD,ADX,STO). Follow the trend...no Martingale.. . need technical analysis skill Input Parameters : - Magics = 1234; - Lots = 0.01; - maxStopLevel = 700; - autoTPbyATR = true; - TP = 100; - autoSLbyBollinger = true; - SL = 50; - trailingStop = 0; - CutByEngulf = true; - Friday_Rest = true; - Indicator_Setting = "| ^_^ | ^3^ | ^v^ |"; - MAmega_Setting = "----------------------------"; - MA_Setting = "----------------------------"; - B

This indicator signals significant price movements compared to the average over a defined period, making it easy to spot potential trading opportunities. It takes into account not only price movements but also the spread value of each symbol, providing a more accurate picture. You can use this indicator for multiple symbols, up to 8 pairs, as specified in the input parameters. With its flexible settings, traders can easily customize it to suit their individual preferences and trading styles. It'
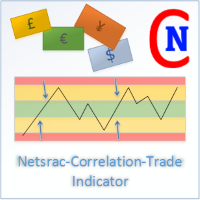
The Netsrac Correlation Trade Indicator (NCTI) was created to trade correlations between different assets. NCTI offers five different strategies to do this. Five different correlation trading strategies with two or three assets Fast access your assets with one click via asset buttons Your profit/loss at a glance Configurable alerts via screen or mobile You can use the indicator with every timeframe. Higher timeframes give fewer but better signals. If you have some questions or suggestions - ple

MMHelper - инструмент для удобной работы с ордерами. Позволяет рассчитать и выставить ордер, в зависимости от выбранного риска. Интерфейс продуман для максимального удобства. Нет лишних элементов на графике.
В параметрах возможно указать: порог безубытка (по прохождении какого количества пунктов выставить безубыток); размер безубытка в пунктах; закрывать ли половину позиции при достижении уровня безубытка; размер максимального риска по всем позициям в процентах.
***Please Give Some Feedback and Reviews*** This is an indicator which shows the direction and the strength of the selected Symbol based on the two outputs, Signal and Value. The Signal indicates the directions as Buy equals 2(Blue) and Sell equals 1(Red). The Value output indicates the strength of the signal between -100 to 100. This indicator is both trend and fast preliminary indicator by choosing appropriate parameters. Indicator uses the Tick Volume as the hitting catalyst, which by choosi
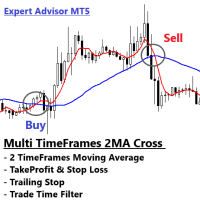
Multi Timeframes of 2 Moving Averages Cross Timeframes 1 = Executor Position (MA1 Cross MA2 from bottom = buy, MA1 Cross MA2 from Upper = sell) Timeframes 2 = Trend Detector (MA1 > MA2 = Uptrend, MA1 < MA2 = Downtrend)
How it works If MA1 > MA2 in Timeframes 2, then MA1 Cross MA2 from bottom in Timeframes 1, output = Buy If MA1 < MA2 in Timeframes 2, then MA1 Cross MA2 from Upper in Timeframes 1, output = Sell
Expert Advisor Features - Fixed Lot - Stop Loss and TakeProfit - Trailing Stop - Mu

ORION it is a Secure Automated Software for trade Forex market and indices.
The architecture is a Fully Automatic Autonomous Robot Expert capable of
Independently analyzing the market and making trading decisions
ORION It is an advanced trading system. This is a fully automatic Expert Advisor.
ORION . It is a 100% automatic system, The system is self-sufficient, performing all the work. Is a revolution in the customization of the trading. You can download the demo and test

Robot de scalpings curtos em simbolos de alta volatilidade. Amplamente testado no Mini índice no tempo M1. Resultados consistentes e expressivos em curto período de tempo. Configurações recomendadas para o mini índice já estão nos parâmetros de entrada dos sistema. Não recomendada a utilização em tempos gráficos maiores. Mais informações dos resultados do sistema no tester, encontram-se nas imagens.

Quieres ser rentable y que un indicador haga los análisis por ti.. este es la indicado tener mas seguridad en tus operaciones si respetas los parámetros este indicador fue diseñada y modificado por mas de 6 meses, escogiendo y modificando la para tener un mejor resultado y entradas mas precisas. que te ayudara a asegurar tu entrada y poder sacarle muchas ganancias. los parametros: Entrada cuando La linea roja o verde cruce hacia arriba Puede entrar apenas comencé a cruzar Compra o venta Observa
VR MultiPrice Analysis - 통화쌍에서 통화의 강도를 결정하는 지표. EUR/USD 쌍을 예로 들어보자. 어떤 통화가 현재 약하고 어떤 통화가 강한지 어떻게 판단하는가? 가장 쉽고 신뢰할 수 있는 방법은 EUR를 USD를 제외한 다른 통화와 비교하는 것입니다. 전력 분배 옵션: EUR은 다른 통화에 대해 상승하고 있습니다. 이는 통화가 거래자와 투자자에게 더 매력적이 되거나 좋은 소식이 나왔다는 신호입니다. EUR은 다른 통화에 대해 하락합니다. 이것은 대부분의 거래자와 투자자가 EUR를 없애고 다른 통화를 구매하거나 나쁜 소식이 나왔다는 신호입니다. 이 표시기는 통화마다 다른 가치를 보여준다 - 이것은 유로화시장의 불확실성의 신호 유럽연합화폐(유로화)에 대해 이야기하자면, 이 지표는 미국 달러화를 다른 화폐들과 연결하여 분석합니다. 그 결과 VR MultiPrice Analysis을 사용하면 트레이더는 EUR/USD 통화 쌍의 합성 분석을 받아 전체 통화 쌍의 전체

An indicator to fetch the market shocks from the economic events directly to the chart. It indicates the surprise factor (actual published data minus the expected value) exactly on the right candlestick! The bigger the value of the indicator, the higher price gap will be. The indicator's value and sign gives a great opportunity to forecast the amount and direction of the price gap. Do not miss any opportunity by setting an Expert Advisor to place buy or sell orders based on this indicator's valu
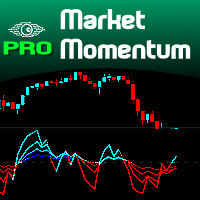
The Market Momentum indicator is based on the Volume Zone Oscillator (VZO), presented by Waleed Aly Khalil in the 2009 edition of the International Federation of Technical Analysts journal, and presents a fresh view of this market valuable data that is oftenly misunderstood and neglected: VOLUME. With this new approach of "seeing" Volume data, traders can infer more properly market behavior and increase their odds in a winning trade.
"The VZO is a leading volume oscillator; its basic usefulness

98% 정확도의 거래 신호 정확한 진입, 명확한 청산 | 다중 시간대 | 모든 시장
간단한 3단계로 작동 방식 1️⃣ 거래 진입 (매수/매도 규칙) 신호 트리거: 두 개의 선(X)이 색상 영역(빨간색: 매수, 파란색: 매도)을 벗어나 교차합니다.
확인: 가격 캔들이 교차점에 닿아야 합니다(1~5개 캔들 사이 또는 교차 후).
대체 진입 (터치 없음):
매도 신호(파란색 영역): 가격이 교차점 위에 유지됩니다(터치 필요 없음).
매수 신호(빨간색 영역): 가격이 교차점 아래에 유지됩니다(터치 필요 없음).
2️⃣ 청산 거래 (이익실현) 청산 신호: 노란색 선이 현재 영역 밖으로 곡선을 그리며 진입 → 거래 청산.
3️⃣ 위험 관리 랏 크기: $1,000 계좌 잔액당 0.01랏
거래 다각화: 주요 통화(예: USDJPY, EURGBP, GOLD)에 분산 투자하세요.
트레이더들이 이 지표를 선호하는 이유 98% 정확도 - 유동성 및 이동평균 교차 기반 신뢰할 수 있는

THE MAIN IDEA. First of all, this is the fourth of an EA family, based on same strategy applied to different indicators.
This means that the same strategy and same money management is applied to different indicators with spread main filtering.
All EAs are sensitive to TF, please optimize H4, H1, M30. There is great difference.
Final goal is to design an EA with higher success rate possible, with lowest losses overall.
This peculiarity, will grow confidence in EA usage, for long term

THE MAIN IDEA. First of all, this is the third of an EA family, based on same strategy applied to different indicators.
This means that the same strategy and same money management is applied to different indicators with spread main filtering.
All EAs are sensitive to TF, please optimize H4, H1, M30. There is great difference.
Final goal is to design an EA with higher success rate possible, with lowest losses overall.
This peculiarity, will grow confidence in EA usage, for long term satisfactio
다중 통화 Expert Advisor는 거래 수단과 포지션 볼륨 간의 상관 관계 시스템을 기반으로 합니다.
핵심 역할은 자본 관리 시스템과 열린 거래의 수와 방향의 고유한 비율에 의해 수행됩니다.
Expert Advisor는 스캘퍼가 아닙니다. Expert Advisor의 자신감 있는 운영에는 주문 실행 속도가 중요하지 않습니다.
거래 수단: EURUSD, GBPUSD, EURJPY, USDCAD, USDJPY, GBPJPY, EURGBP, AUDCHF, USDCHF, AUDCAD, AUDUSD, AUDJPY, CADCHF, CHFJPY, CADJPY.
EA는 완전 자동화된 거래를 위한 준비가 되어 있습니다. 추가 설정이 필요하지 않습니다. Live signal: https://www.mql5.com/en/signals/1328312
시작하려면 하나의 차트에 Expert Advisor를 설치해야 합니다. 설정: 작업 쌍 - 거래 수단; 신호 TF - 메인 타임프레임; 이

1.自動売買ソフトウェア(EA)の特徴 当自動売買ソフトウェア(EA)の特徴を詳しくお伝え致します。 FX 証券会社:CryptoGT、FXGT etc... プラットフォーム:MT5 専用 取引通貨:ビットコインドル (BTCUSD) 取引スタイル:スキャルピング~中期 取引時間軸:15 分足 (M15) まず、チャート上では、インジケーターなどは必要ありません。 当 EA へ全て組み込まれています。 推進はビットコインドル (BTCUSD) 15 分足用です。 ビットコインはご存じの通り、値動きが激しいです。 ほとんどがレンジですが、ブレイクするととんでもないほど動きます。 保有ポジション損失リスクを抑えたハーフ&ハーフのトラップ&リピートタイプ EA 利益はあっても保有ポジションによる損失(ロスカット)を減らす工夫として 値幅設定レンジ中央値より上では売りのトラップ&リピート、 中央値より下では買いのトラップ&リピートを行います。 パラメーター設定では、注文範囲の調整・フィルターによる発注抑制・トレーリングストップ の機能を備えています。 トラップ&リピートタイプの取引では、弱点
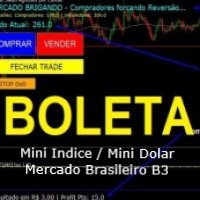
BoletaLira is a fundamental tool focused on beginning and advanced users so that they can enter operations with the main input signals such as:
- Market Trend: High or Low, always taking into account the moving average pre-defined in the setup.
- Correlation between 2 assets: In the case of Brazilian B3 we can use the BoletaLira for Mini-Index but using the Dollar signs so that we can have greater security, for those who do not generally know the Index x Dollar assets try to go in the opposit

BTC/USD SCALPING
スキャルピング型EA
こちらは仮想通貨向け自動売買プログラムとなっております。 シグナル公開予定
通貨ペア :BTC/USDに最適なナンピン及び利確設定をしております ロット数:0.01~ パラメータ ・ロット数:最初の注文ロット数を入力してください。これを基準に、ナンピンに増加していきます。 ・ナンピン:ONにするとナンピンを行いますので、ONにしてご利用ください。 ポジション数: 最大21ポジション 時間足 :M1 注文条件 ・EA起動後、一定の値動きで逆張りを行います。 ・100BTC/USDごとにナンピンを行います。(ただし証拠金維持率が500%以上のあいだ) ・一定の利益にて全決済を行います。 その他 ・マーチングゲールではありませんが、ナンピンを行うため、ある程度のリスクがございます。 ・証拠金は1000USD以上を推奨しております。
BluePrint TimeFrame: M5 or above . BluePrint is an Expert Advisor based on Price Action and Martingale.
Configurations: +---------------------------------- BLUEPRINT | EA Settings ----------------------------------+ Magic Number: ID that should be changed if you want to install Expert Advisor on different graphics, without interfering with each other and behaving like a single Expert Advisor. Max Spread By Tick Size: The maximum Spread difference that you want to trade. Lots Mode: You
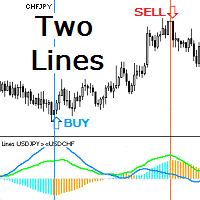
Индикатор показывает две линии динамики движения двух инструментов. Если один из коррелирующих инструментов убегает, другой будет его догонять. Этот принцип даёт точки входа в сделку по их кроссу или для синхронной покупки и продажи в парном трейдинге. Гистограмма индикатора показывает значение дистанции между линиями инструментов. При уменьшении и увеличении дистанции гистограмма принимает разные цвета. Треугольный значок показывает текущее состояние линий: расхождение ( Divergence ) или схо
MetaTrader 마켓은 개발자들이 거래 애플리케이션을 판매할 수 있는 간단하고 편리한 사이트이다.
제품을 게시하고 마켓용 제품 설명을 어떻게 준비하는가를 설명하는 데 도움이 됩니다. 마켓의 모든 애플리케이션은 암호화로 보호되며 구매자의 컴퓨터에서만 실행할 수 있습니다. 불법 복제는 불가능합니다.
