 MetaTrader 5
 Experts
 지표
 라이브러리
 유틸리티
 위젯
 규칙
MetaTrader 5용 Expert Advisor 및 지표 - 509
 트레이딩 로봇과 지표를 사용하여 외환 거래를 더 수익성 있게 만들 수 있습니다. 트레이딩용 로봇을 사용하면 개점 및 폐점 거래를 자동화할 수 있으며, 지표는 시장 행동을 보다 정확하게 예측할 수 있습니다.
이 페이지에는 MetaTrader 5 응용 프로그램의 카탈로그가 나와 있습니다.
teuleiding hohwang mich poglag-e sayongdoeneun jipyoneun syupeo teulendeu tamjeong-ibnida. sijang-i sangseung chuseil ttae ganghan sinholeul sayonghayeo geubdeungseleul pochaghago halag chuseil ttae ilban sinholeul sayonghayeo deo manh-eun geubdeungseleul pochaghasibsio. i jipyoneun bonjiljeog-eulo ilbu suhagjeog nonliga issneun gagyeog haengdong giban-ibnida. seupaikeuleul jabneun deman sayongdoebnida. pyosigieneun da-eumgwa gat-eun chullyeog-i issseubnida. 1. ganghan sinho 2. ilban sinho 3. im

Stochastic Strategy Revealer This EA uses Stochastic Oscillator to generate strategies for almost all markets and trade them using this EA. How will this EA help you? We all know trading is hard, and creating a strategy is even harder, so this EA will let us sit back and let the strategies reveal themselves to us and select the ones we like. this ea was made to get rid of wondering and headaches and you will only search for good markets. Positions Sizing This EA uses the basic position sizing m

What is Alpha J? Alpha J is a fully automated system that trades the USD/JPY spike during the Tokyo session with great precision.
How is Alpha J built? Alpha J is developed based on our proprietary algorithms and statistical models, which are the result of our years of intensive in-house research into the price volatility around the Tokyo session. To avoid overfitting, Alpha J uses 80% of the price data to develop the model, and the remaining 20% to test and validate it.
How does Alpha J ex
테스트하고 사용하기 전에 EA를 최적화하세요.
원유 선물은 2022년 1월부터 2022년 12월까지 1시간 동안의 실제 선물 시장 데이터를 바탕으로 구축되었습니다. 백테스트 및 분석을 위해 이 날짜를 테스트하세요. 필요할 때 최적화하세요.
실제 선물 시장에서 거래하거나 석유 파생상품을 거래하는 경우 매개변수를 테스트하여 사용 중인 데이터 및 브로커에 얼마나 적합한지 확인하세요. 선물은 중앙에 위치한 데이터이며 모든 데이터는 모두에게 동일합니다.
입력은 EMA, 고정 로트 시스템, ATR SL 및 TP 수준용입니다.
테스트하고 사용하기 전에 EA를 최적화하세요.
원유 선물은 2022년 1월부터 2022년 12월까지 1시간 동안의 실제 선물 시장 데이터를 바탕으로 구축되었습니다. 백테스트 및 분석을 위해 이 날짜를 테스트하세요. 필요할 때 최적화하세요.
실제 선물 시장에서 거래하거나 석유 파생상품을 거래하는 경우 매개변수를 테스트하여 사용 중인 데이터 및 브로커에 얼마나

The Trend Snatcher is a multi-timeframe indicator that detects swings on the price market chart. Important levels, such as Supply and Demand levels, Trendline touches, reversal patterns, and others, can also be added as confluence when making trading decisions.
The indicator employs two lines that aim for the highest selling and lowest buying levels. When the two lines cross, a signal is generated.
All trading instruments are compatible, including currency pairs, synthetic indices, metals, c
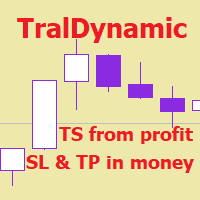
The utility for managing open positions can work with stops (take profit and stop loss) in money, percentages or points. The built-in trailing stop starts working from profit, the size of which can be set in currency or as a percentage. With the help of the built-in trading simulator, you can check how the utility works in the strategy tester. Benefits setting stop loss and take profit in the deposit currency, as a percentage of the account balance or by points; adding stop loss and take profit

Golden Auto Bot one year running! Fully Futomated Trading System, with 8 trading setup for signals. The EA has been subjected to stress tests for a period of all time and passes every year . We DO NOT use Grid or Martingale.
80% off now! We backtest again, backtest real - running real As of now, the Golden Auto Bot primarily operates on the main pair XAUUSD and the secondary pair EUR-USD. With a minimum investment capital of 300 USD, the bot utilizes a micro lot size of 0.01. For the X
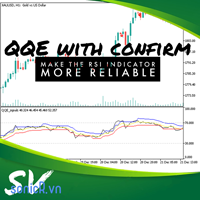
New QQE with confirm The relative strength index (RSI) is a technical indicator of momentum that measures the speed and change of price on a scale of 0 to 100, typically over the past 14 periods. Cause RSI measures the speed and change of price, trader normally use this indicator in two way: + Buy when oversold, sell when overbougth. + buy or sell when identifying divergence from rsi with price. In two way, it wrong when rsi in overbouth (for example) for long time or divergence. Even price ju
What is Double Top and Bottom Double top and bottom patterns are chart patterns that occur when the underlying investment moves in a similar pattern to the letter "W" (double bottom) or "M" (double top). Double top and bottom analysis is used in technical analysis to explain movements in a security or other investment, and can be used as part of a trading strategy to exploit recurring patterns. you can fin MT4 version hier
Indicator shows you 2 Level target and stop loss level. Stoploss level

The diamond top and bottom are reversal patterns. It represents a rally to a new high with a drop to a support level followed by a rally to make a new high and a quick decline, breaking the support level to make a higher low. The bounce from the higher low is then followed by a rally, but making a lower high instead. Once this behavior is identified, prices then break the trend line connecting the first and second lows and start to decline further. You can find MT4 version hier
Indicator shows
This z-score indicator shows the correct z-score of an asset, as it uses the normalized price data for calculation, which is the only correct way. Z-score is only applicable for normal distributed data, therefore not the actual price is considered, but the normalised returns, which were assumed to follow a normal distribution. Returns are mean reverting and assumed to follow a normal distribution, therefore z-score calculation of returns is more reliable than z-score on price, as price is NOT m
Trend Following Strategy Generator The following Expert Advisor helps to generate robust trend-following strategies using price action and a few parameters. the story behind the expert Advisor is to unfold market behavior for an instrument and choose how we can trade it best. After finding your favorite strategy you can save the parameters and start trading the strategy in no time. There is no limit to how many strategies you can generate. How will this EA help you? We all know trading is hard,

"Recovery Drawdown" is an Expert Advisor (EA) specifically designed to address and overcome the challenge of drawdown in trading accounts. Drawdown occurs when an account experiences a series of consecutive losses, resulting in a significant decrease in available balance. This EA follows a cyclical strategy composed of several key steps. The first step is to close winning trades. This approach is implemented to secure the profits obtained up to that point and prevent them from turning into loss
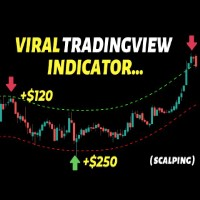
This indicator builds upon the previously posted Nadaraya-Watson Estimator. Here we have created an envelope indicator based on kernel smoothing with integrated alerts from crosses between the price and envelope extremities. Unlike the Nadaraya-Watson Estimator, this indicator follows a contrarian methodology. Settings
Window Size: Determines the number of recent price observations to be used to fit the Nadaraya-Watson Estimator.
Bandwidth: Controls the degree of smoothness of the envelopes

Build your own model to predict averages of turning points of the Triple Moving Average Oscillator. It is simple. Rate me with stars. Just load the indicator Triple Moving Average Oscillator in you platform and choose the period. Scroll through to observe the averages of the highs and lows over a period of time. Add the levels for a buy and a sell on the Triple Machine and this will show the average of highs and lows to look for buys and sell. You can load multiple copies with multiple levels.
EA는 최적화 가능하며 2022년 1월부터 최적화됩니다.
Dow Jones Lot Trader는 기계 학습으로 만들어졌으며 고정된 lot을 사용하여 1시간 차트에서 Dow Jones 선물을 거래합니다. EA는 마이크로 다우존스의 실제 선물 데이터에 대해 작성되었습니다.
Dow Jones의 파생 상품을 거래하는 경우 실제 선물 데이터와 일치하는지 확인하기 위해 백 테스트가 필요할 수 있습니다. sl 및 tp는 평균 실제 범위를 기반으로 합니다.
EA의 논리는 범위, 최고 및 최저를 거래한다는 것입니다. 로직은 일중에만 거래되도록 설정되어 있으며 주말이나 야간에는 거래되지 않습니다. 이는 입력에서 변경할 수 있습니다. EA는 2022년 데이터를 기반으로 구축되었습니다. 테스트를 위해 범위를 사용하십시오.

Fibonacci retracement levels—stemming from the Fibonacci sequence—are horizontal lines that indicate where support and resistance are likely to occur. Each level is associated with a percentage. The percentage is how much of a prior move the price has retraced. The Fibonacci retracement levels are 23.6%, 38.2%, 61.8%, and 78.6%. While not officially a Fibonacci ratio, 50% is also used. The indicator is useful because it can be drawn between any two significant price points, such as
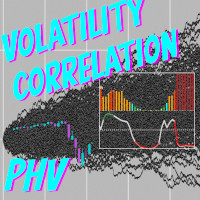
Percentile of Historical Volatility and Correlation Coefficient shows if the asset is cheap or expensive based on the volatility. It is used to determine a good entry point. It has two indicators built in: Historical Volatility is ranked percentile wise and its correlation to price action which gives an indication of the direction of a possible future move. Together the both indicators can give good entries and direction. Historical Volatility is a statistical measure of the dispersion of retu

이 EA에는 최적화 가능한 입력이 있습니다.
Nice Little Bot은 1시간 차트에서 GBP/USD를 거래합니다. 논리를 위해 Keltner 채널, Bollinger 밴드 및 LWMA를 사용하여 거래합니다. 그것은 기계 학습으로 만들어졌으며 멋진 작은 로봇입니다.
찾은 경우 최적화하거나 변경할 수 있는 입력이 있습니다. 자금 관리는 균형 조정된 %를 사용합니다. 잔액 및 최대 로트의 %가 있습니다. 다시 테스트 시작에 시도
2013년부터.
이 EA에는 최적화 가능한 입력이 있습니다.
Nice Little Bot은 1시간 차트에서 GBP/USD를 거래합니다. 논리를 위해 Keltner 채널, Bollinger 밴드 및 LWMA를 사용하여 거래합니다. 그것은 기계 학습으로 만들어졌으며 멋진 작은 로봇입니다.
찾은 경우 최적화하거나 변경할 수 있는 입력이 있습니다. 자금 관리는 균형 조정된 %를 사용합니다. 잔액 및 최대 로트의 %가 있습니다. 다시 테스트 시작에 시

<<Master the GBP/USD Market with Brilliant Knight: Your Strategic Edge in Mean Reversion Trading>>
Introducing Brilliant Knight, the Expert Advisor (EA) specifically engineered to optimize your trading in the cable GBP/USD currency pair. Built on a foundation of rigorous research and cutting-edge technology, Brilliant Knight employs a sophisticated mean reversion strategy, turning market fluctuations into profitable opportunities with precision and consistency.
Exploit Market Inefficiencies w
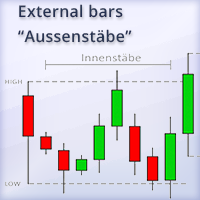
This indicator shows external bars ("Aussenstäbe") in the chart in candle form.
The colors of the candles can be set individually.
Also different colors for bearish and bullish bars are possible.
In addition, the color of the wicks or outlines is also adjustable.
Outside bars are mentioned e.g. by Michael Voigt in the book "Das große Buch der Markttechnik".
All other candles are inner bars.

This indicator shows OutsideBars (OB) and InsideBars(IB) in the chart in candle form.
The colors of the candles can be set individually. Also different colors for bearish and bullish IBs or OBs are possible.
In addition, the color of the wicks or Outlines can also be set.
OutsideBars and InsideBars often show good zones for support or resistance. See the Screenshot for some examples.

Binary Trade Panel은 MT4/MT5 플랫폼에서 바이너리 옵션을 거래하는 데 매우 유용한 도구입니다. 더 이상 MT4/MT5 외부에서 플러그인을 설정할 필요가 없습니다. MT4/MT5 차트에 바로 표시되는 간단하고 편리한 패널입니다. Binary Trade Panel은 MT4/MT5 플랫폼을 사용하여 바이너리 옵션을 거래하는 거래자에게 유용한 도구입니다. 트레이더가 외부 플러그인을 설정하거나 여러 화면과 메뉴를 탐색할 필요 없이 MT4/MT5 차트에서 직접 바이너리 옵션 거래를 배치할 수 있는 간단하고 편리한 패널입니다. Binary Trade Panel은 MT4/MT5 거래 플랫폼을 제공하는 바이너리 옵션 브로커와 특별히 작동하도록 설계되었습니다. 즉, 바이너리 옵션 거래가 작동하는 방식을 선호하고 일반 중개인과 해당 스타일로 계속 거래하고 싶다면 Binary Trade Panel은 거래자에게 바이너리 옵션 거래와 유사한 경험을 제공하도록 설계되었습니다. 바이너리 옵
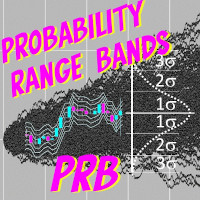
The indicator ‘Probability Range Bands’ gives a prediction of the amount, how much the asset is moving from its current price. The range bands give probabilities, that the candle close will not exceed this certain price level. It is also called the expected move for the current candle close. This Indicator is based on statistical methods, probabilities and volatility. Asset price is assumed to follow a log-normal distribution. Therefore, log returns are used in this indicator to determine the
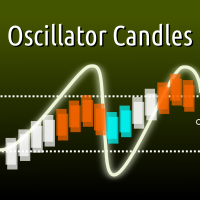
With this indicator you can colorize the candles on your chart based on the output of any oscillator indicator. Supporting both built-in and custom indicators, with the ability to set up to 5 custom parameters, custom color scheme, and upper/lower threshold values. Most built-in indicators in MT5 will be found under "Examples\\" path. For example, to use default RSI indicator, set your indicator path to "Examples\\RSI" in the inputs dialog. Input01-05 sets the custom parameters of your indicator

This is an indicator meant to catch trends as they are coming from a retracement .it can be used for any symbol . We can use this indicator to catch spikes or sculp for Boom , Crash ,Range Break . it offers a sell signal and buy signal and an exit signal which can also be used to enter price reversal if you see fit the indicator has a higher time frame filter system which can go up to 2 levels of time filtering which will give you more accurate signals based on the trend ,this feature can be tur
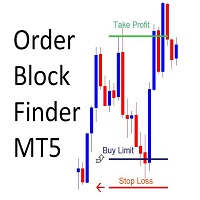
Order Block Finder
Sends Alerts – On MT5 To Your Phone To Your Email
Does not repaint .
Works on any Forex pair, any timeframe.
10 Activations allowed so you are free from limitations >> MT4 Version Here Spreads from 0.1pip RAW/ECN Accounts, click here . Check out my Waka Esque EA signal here: >> High Risk Settings or Medium Risk Settings .
What Is An Order Block? An Order Block (or Banker Candle, or Institutional Candle) is an opportunity to get very high risk to reward trades (o

FOREX MARKET SCALPER is a hybrid scalping robot on hedge accounts. If you like when your robot is in constant trading and at the same time you feel that you have full control then this robot is perfect for you! No more psychological exhaustion when in manual trading after trade opening the market price goes opposite way and you feel tired of constant drawdowns. This robot trades both directions at the same time and you won't be bothered anymore which direction price moves. Remember how exhausti
Long & Short Based on Cointegration Statistical and Quantitative Long-Short (Pair Trading) approach for long and short positions. Your CPU will always be safe and stable when using Multiple Linear Regression if you have a reliable indicator. Based on the results of this indicator, you can execute a long and short or a long and long/short and short trade between two separate assets. It can show you a Highly informative dashboard based on Cointegration Search you determine, with all statistical d

## WAPV Full을 사용하여 전문적으로 작동하고 추적할 수 있습니다. 큰 선수 돈은 어디에 있습니까 당신의 손에 혼자 읽기를 수행하는 도구가 있다고 상상해보십시오. 최고의 거래 지역을 보여주는 주요 마켓 플레이어의 가격 및 볼륨 분석을 기반으로 합니다. WAPV Full은 R. Wyckoff의 운영에 100% 초점을 맞춘 완전한 도구입니다. 거래 파동에서 시장 움직임을 매핑하는 것 외에도 매핑합니다. 가격과 거래량을 읽어 시장. 프로페셔널 마켓은 R. Wyckoff의 3가지 법칙에 따라 운영됩니다. # 원인과 결과 # 수요와 공급 # 노력 x 결과 이 모든 것이 WAPV Full로 제공되며 16가지 기본 도구를 제공합니다. 시장을 전문적으로 분석하고 결과적으로 결과를 개선하십시오. 내가 말하는 내용을 이해하려면 이미지와 비디오를 참조하십시오. ## WAPV Fulleul sayonghayeo jeonmunjeog-eulo jagdonghago chujeoghal su isss

Ticks Candles Chart indicator build equi-volume candles and designed for Oracle Strategy The Period in ticks is set directly on the chart Tick chart opens in a separate window Recommended to use tick periods from 50 and above Works on real time only
Input Parameters Ticks_In_Bar - default period in ticks Counting_Bars - how many tick bars of history to build Custom_Symbol_Suffix - additional suffix for symbols

<<Supreme Edge>> BUY ONE FREE ONE, contact me after purchase for your special gift.
Supreme Edge, an advanced Expert Advisor meticulously designed for trading. Leveraging state-of-the-art trend identification algorithms, this system seamlessly adapts to complex market dynamics, capturing high-probability opportunities with precision and agility.
The EA distinguishes itself with its proprietary trend detection mechanism, which analyses and interprets multi-dimensional market data to accuratel
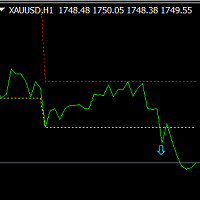
This is an MT4 indicator based on fluctuation statistics, which mainly includes two parts: one is display the fluctuation area, and the other is to display the signal at the same time if there is a signal generated.
Its main principle is to conduct data statistics based on the specified extreme value fluctuation radius, and draw the fluctuation area. If the breakthrough area is displayed, the signal in the same direction will be displayed. Advantage:
Suitable for all breeds. Applies to all cy

GOLD MARKET SCALPER is a hybrid scalping robot on hedge accounts. If you like when your robot is in constant trading and at the same time you feel that you have full control then this robot is perfect for you! No more psychological exhaustion when in manual trading after trade opening the market price goes opposite way and you feel tired of constant drawdowns. This robot trades both directions at the same time and you won't be bothered anymore which direction price moves. Remember how exhaustin
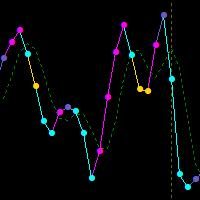
What Is the Relative Vigor Index? The Relative Vigor Index (RVI) is a momentum indicator used in technical analysis that measures the strength of a trend by comparing a security's closing price to its trading range while smoothing the results using a simple moving average (SMA). The RVI's usefulness is based on the observed tendency for prices to close higher than they open during uptrends, and to close lower than they open in downtrends. KEY TAKEAWAYS The Relative Vigor Index (RVI) is a
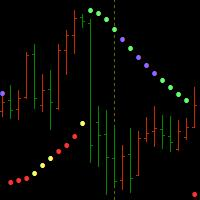
The parabolic SAR indicator, developed by J. Welles Wilder Jr., is used by traders to determine trend direction and potential reversals in price. The technical indicator uses a trailing stop and reverse method called "SAR," or stop and reverse, to identify suitable exit and entry points. The parabolic SAR indicator appears on a chart as a series of dots, either above or below an asset's price, depending on the direction the price is moving. A dot is placed below the price when it is trending u
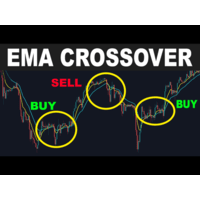
Moving Averages Expert EA is a type of automated trading strategy that utilizes two different moving averages to generate buy and sell signals. The moving averages are based on historical price data, and they are used to identify trends and determine the direction of the market. This EA by default generates buy signals when the fast moving average crosses above the slow moving average , indicating that the market is trending upwards. Conversely, sell signals are generated when the fast moving av
Introduction
This EA uses a simple entry based on a moving average and shows the power of position sizing and money management over entry signals. The trading approach is to grow the account step-by-step reaching a daily trading goal or stopping to trade if the EA exceeds a maximum daily loss.
Define parameters profit target, maximum daily loss, and stop loss to influence the trading results significantly.
The EA takes long and short trades and uses neither a grid system nor a Martingale app

Winner Oscillator. As it is called, it is an oscillator that consists of a heikin ashi candlestick strategy + an oscillator programmed to grab perfect rebounds as it looks good in the photo It is used for scalping and intraday. It works for all seasons! and also for all forex pairs and synthetic indices It works very well also in volatility, jumps, crash and boom!

XCAP TRADER is a hybrid scalping robot on hedge accounts. If you like when your robot is in constant trading and at the same time you feel that you have full control then this robot is perfect for you! No more psychological exhaustion when in manual trading after trade opening the market price goes opposite way and you feel tired of constant drawdowns. This robot trades both directions at the same time and you won't be bothered anymore which direction price moves. Remember how exhausting is whe
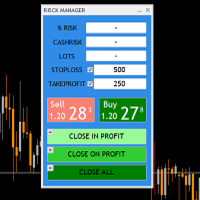
THIS RISK MANAGER WILL HELP YOU IN YOUR DAILLY TRADING, BY CALCULATING THE RISK AND THE LOTS, AND SET STOPLOSS, AND TAKE PROFIT, AND CAN CLOSE TRADES FOR YOU. RISK PERCENTAGE CASHRISK LOTS STOPLOSS TAKE PROFIT SELL AND BUY BUTTONS LOSE IN PROFIT BUTTON WICH WILL CLOSE ALL TRADES IN PROFIT SET BY THE USER CLOSE ON PROFIT BUTTON WICH WILL CLOSE ALL TRADES WHEN THE EQUALITY IS IN PROFIT SET BY THE USER AS WELL CLOSE TRADES BUTTON

Send your trades on the Metatrader 5 platform to your Telegram Group!
Simple to use, just follow the steps below:
Create a group in Telegram and enter the name in the robot parameters; Create a Bot in Telegram with the user BotFather: Send the following message-> /newbot; BotFather will ask for a name for your Bot; Send a message with the desired name; BotFather will ask for a username for your Bot; Send a message with the desired username; BotFather will send the Token; Insert the Token

Timeframe H1 Pair GBPUSD The CableStarV2 follows a trend trading strategy . It uses Bollinger Bands on HeikenAshi Charts to find the perfect entry and exit points in the market. Every position is secured with a stopp loss. The backtests shown in the screenshots were done with the default settings. Do you own testing to find even better settings. Please download the free demo to do your own testing. The CableStarV2 is not using any martingale and/or grid functionalities . Still the tests shown b
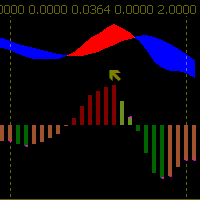
Type(1EMA,2DEMA,3TEMA) FastPeriod SlowPeriod SignalPeriod PriceApplied ( HIGH(H) LOW(L) OPEN(O) CLOSE(C) MEDIAN(HL) TYPICAL(HLC) WEIGHTED(HLCC) )
Deviate Up Deviate Down Deviate Bar
What Is Moving Average Convergence/Divergence (MACD)? Moving average convergence/divergence (MACD, or MAC-D) is a trend-following momentum indicator that shows the relationship between two exponential moving averages (EMAs) of a security’s price. The MACD line is calculated by subtracting the 26-peri

"Step Ahead" is the ultimate breakout expert advisor The basic strategy is trading breakouts from a time range. It takes a start time and an end time as inputs. The EA sets breakout trades at the end of the ranges and manages the trades via breakeven and trailing stops mechanisms. The trades will be closed if SL or TP hits, and you can configure to close all open trades and orders at a specific time as part of the range settings. The strategy requires an SL for each trade. It is not a risky stra

This is similar in it's idea as the Binary Advance/Lite indicator, but this is intended to use as a levels indicator, as well as trend reversal and how ranging the market is. It takes several useful indicators and combines them in such a way as to declutter your charts, yet prove even more useful together, than separate. RSI, RVI, DeMarker, MACD are added together then multiplied by ATR and StdDev to reveal multiple factors: How far the price has changed, and as the price slows down and reverses
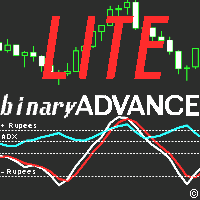
This is a Lite version of my Binary Wave Advance Oscillating indicator: https://www.mql5.com/en/market/product/90734 Free for a limited time! It reduces the less useful indicators, while keeping it's predictive modifications to make each indicator within better than their stock counter part. I reduced it and made it simpler, in the hopes it would be less overwhelming and more approachable. Contains: ADX Chaikin Money Flow Index Each have separate smoothing controls to tame faster periods, as we

There are two stages in the market that we call them "Narrow stage" and "Wide stage". We can expect a big move (wide stage) when the price moves sideways within a low-price range followed with a low volatility. Knowing the exact trigger point is the key to success. The symbols that it trades best are in the inputs and it should be run on GBPNZD H1. For a trading reference please follow the signal for this EA: Copy trades of the MT5 iMasterTrader trading signal for MetaTrader 5 - Mihai Onofre

Inspired investing.com Technical Indicators, this indicator provides a comprehensive view of the symbol by synthesizing indicators including: RSI, StochRSI : have 3 level oversold - red, midle (aqua when upper, pink when lower), overbuy – blue Stoch: oversold – red, overbuy- blue, aqua when main line < signal line, pink when main line > signal line MACD: aqua when main line < signal line, pink when main line > signal line ADX: aqua when line plus > line minus, pink when line plus < line minus
$70 to $17,400 ---- Good for growing small account as well. Massive Discount ongoing . Scalping Requirements:
- Trading pairs ---------- EURUSD and GBPUSD
- Timeframe ---- -- ------ H1
- Minimum deposit --- - Any
- Leverage ------- ---Not important for this EA (Works on all leverage accounts)
- News Trading --------- Allowed
- Risk ------------------- Choose lot size you are comfortable with, EA has high win ratio on EURUSD
- Set Up ------ -- Use Recommended settings. There i
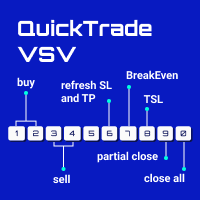
From 0 to 9... the only keyboard buttons you need to trade with this EA!
If I am wrong just write which button should I add in the comment section. I recommend you to test this tool on demo account first. This version of QuickTradeVSV can help you to: 1 - Open buy position with TakeProfit and StopLoss (Lotsize is calculated by your Account Balance and StopLoss). 2 - Open buy position with fixed LotSize. 3 - Open sell position with TakeProfit and StopLoss (Lotsize is calculated by your Account B
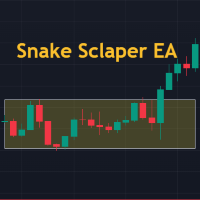
The Snake Sclaper EA is a fully automated scalping robot that uses an optimization breakout strategy. Stop orders are utilized for the entrance to ensure the quickest execution possible. The trigger trailing stop can protect returns. Please test the EA in a demo account first. Recommend using the broker with low spread and VPS with low latency. No grid or martingale functionalities used by this EA!
Monitoring: https://www.mql5.com/en/signals/1863296 https://www.mql5.com/en/signals/1873917
Rec
SYSTEM INTRODUCTION: The Binary Options Momentum System Is Specifically Designed For Binary Options Trading. Unlike Other Systems And Indicators That Were Adopted From Other Trading Environments For Binary Options. Little Wonder Why Many Of Such Systems Fail To Make Money . Many End Up Loosing Money For Their Users. A Very Important Fact That Must Be Noted Is The Fact That Application Of Martingale Is not Required. Thus Making It Safer For Traders Usage And Profitability. A Trader Can Use Fi
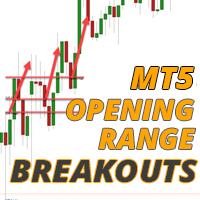
주가 지수 개장 시 발생하는 폭발적인 움직임으로 이익을 얻고 매일 실행 가능한 우위를 확보하십시오. 개시 범위 돌파 EA는 DAX, DOW, NASDAQ 및 S&P500과 같은 주요 주식 지수에서 매일 개장 직후 형성되는 추세를 포착하기 위해 원하는 대로 조정할 수 있습니다. 이러한 개방은 매일 같은 시간에 발생하므로 변동성이 언제 발생하는지 알 수 있으며 종종 이 EA로 캡처하고 전체 거래 세션 동안 탈 수 있는 개방된 강력한 추세 형태 직후에 발생합니다.
개장 범위는 일반적으로 주식 시장 개장 첫 5-15분이며 대규모 시장 참가자가 초기 주문을 한 후 투기 거래가 시작됩니다. 개봉 후 두 가지 중 하나가 발생하는 경향이 있습니다. 1. 지수가 상승, 반전, 반전되는 범위 또는 회전일을 얻습니다. 요즘 전략과 EA는 종종 손익분기점을 넘기거나 작은 손실을 입을 것입니다. 2. 시장이 몇 시간 동안 계속해서 한 방향으로 밀고 가는 경향이 있는 날이 있습니다. 요즘은 전략이 실제로

The concept of Harmonic Patterns was established by H.M. Gartley in 1932. Gartley wrote about a 5-point (XABCD) pattern (known as Gartley) in his book Profits in the Stock Market. This indicator scan and alert when 4th point (C) is complete and predict where D should be. In traditional, Gartley pattern include BAT pattern, Gartley pattern, butterfly pattern, crab pattern, deep crab pattern, shark pattern. Each pattern has its own set of fibonacci. In this indicator, we add more extended patter
Daily Range Breakout EA is a breakout strategy with buys when close of current bar is lowest in past N bars and price of next bar is greater than close of previous bar. Condition for sell trades are the opposite. The idea is based on Larry Williams Smash Day strategy. I trade this strategy live and it works in multiple markets. It works best in Daily timeframe. Not Martingale/Grid Strategy. Real result with stop loss. You can reproduce the result for Gold using the default parameters. IMPORTANT!
ALGOBox is a indicator-sandbox expert advisor which allows for easy implementation of a combination of custom indicators to emulate an ideal manual trading strategy using technical analysis. Trade with an indicator-based strategy in mind to find a profitable setting to run with, perfect for manual forex traders!
This EA is adapted to run with great risk management, using volume, trend-recognition and scaling out to run on a high timeframe setting, using no scalping strategies to jeopardize your

Derivonit EA is fully automated Expert Advisor for trading Boom 1000 Index offered by Deriv formerly known as Binary Dotcom. The EA uses more than seven strategies to open trades and close. It is based on CCI, STOCHASTICH, BANDS, ALLIGATOR and ENVELOPES for opening trades and then uses ATR, ADX, Accelerator Oscillator and RSI for closing trades. The EA will automatically open trades and close on Take Profit. Lot size and number of trades can be also changed depending on account balance you hav

The Bheurekso Pattern Indicator for MT5 helps traders automatically identify candlestick pattern that formed on the chart base on some japanese candle pattern and other indicator to improve accurate. This indicator scans all candles, recognizes and then displays any candle patterns formed on the chart. The candle displayed can be Bullish or Bearish Engulfing, Bullish or Bearish Harami, and so on. There are some free version now but almost that is repaint and lack off alert function. With this ve
Break Of Structure Pro
Is price action king? 1. Price is the ultimate king in the forex market, stock market or any other market. Using price action is the reason we can see more profit over loss. Technical analysis is the art of using data points to your advantage and taking informed decisions while entering, trailing and exiting a position on any timeframe. Break Of Structure Pro can be used to trend trade, scalp, hedge or swing trade.
Price action is a trading technique that allows a trade
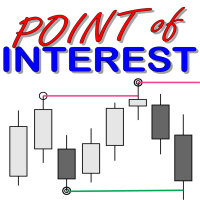
What is a Point of Interest? Traders who follow Smart Money Concepts may call this a Liquidity Point, or areas pools of liquidity have been built up by retail traders for for Big Banks to target to create large price movements in the market. As we all know, retail traders that use outdated and unreliable methods of trading like using trendlines, support and resistance, RSI, MACD, and many others to place trades and put their stop losses at keys points in the market. The "Big Banks" know these me

Obar FX
I would like to offer you the opportunity to create your own system portfolio.
The offer is aimed at all who want to have a diversified portfolio that outperforms the market with significantly lower fluctuation.
therefore I will gradually upload all Exper Advisor, which I use. It should be noted that I run them all together and do not rely on a single strategy. i have additionally checked the individual expert advisors for correlations via quant and calculated the corresponding positio
추세를 따르고 다시 칠하지 않는 외환 거래 게이지.
신호는 완전 자동 방식으로 계산 및 제공되며 이동 평균 교차점을 기반으로 합니다. 이러한 신호는 단순한 매수/매도 화살표의 형태로 표시되므로 초보자에게 친숙한 도구입니다. 그럼에도 불구하고 신호 신뢰성은 정말 견고합니다. 모든 외환 거래 전략과 함께 사용할 수 있습니다.
Trend Signals Alerts Indicator는 모든 종류의 기간 및 통화 쌍에 적합합니다. 메인 트레이딩 차트에 바로 표시됩니다. 기본 설정은 입력 탭에서 직접 수정할 수 있습니다.
Trend Signals Alerts Indicator 자세히 보기 이 지표의 기본 아이디어는 시장 동향과 무역 신호를 보여주는 간단한 방법을 제공하는 것입니다. 결과적으로 초보자와 고급 거래자 모두 도구를 활용할 수 있습니다. 스크린샷에서 MT5에서 활성화되었을 때 어떻게 보이는지 살펴보십시오.
추세 신호 경고 표시기 해부 보시다시피, 그에 따라 거래하기 위한 매
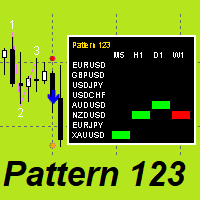
"Pattern 123" is an indicator-a trading system built on a popular pattern, pattern 123.
This is the moment when we expect a reversal on the older trend and enter the continuation of the small trend, its 3rd impulse.
The indicator displays signals and markings on an open chart. You can enable/disable graphical constructions in the settings.
The indicator has a built-in notification system (email, mobile terminal, standard terminal alert).
"Pattern 123" has a table that displays signals from se

RSI Professional is based on an oscillator to hunt ranges and trends where you can also see it catches rebounds in the measurements according to the pair, it can be used for forex and synthetic indices, it works in any temporality, in the pairs that I use it are, eur/usd, usd/jpy, usd/chf and gbp/usd, in synthetics in the crash and boom pairs all, volatility 75, jumps, and range break!
Xrey SP500 Trend
I would like to offer you the opportunity to create your own system portfolio.
The offer is aimed at all who want to have a diversified portfolio that outperforms the market with significantly lower fluctuation.
therefore I will gradually upload all Exper Advisor, which I use. It should be noted that I run them all together and do not rely on a single strategy. i have additionally checked the individual expert advisors for correlations via quant and calculated the correspondi

Xrey Dax Cycle
I would like to offer you the opportunity to create your own system portfolio.
The offer is aimed at all who want to have a diversified portfolio that outperforms the market with significantly lower fluctuation.
therefore I will gradually upload all Exper Advisor, which I use. It should be noted that I run them all together and do not rely on a single strategy. i have additionally checked the individual expert advisors for correlations via quant and calculated the corresponding

Trade on Binance with MT5/MT4 EAs and indicators! GRat_BinanceImport is a tool for manual and automated trading , including ANY available EA, ANY cryptocurrency on the most popular crypto exchange Binance 24/7. Features 1. ALL Binance instruments are available. 2. Import(automatic copying) to the specified Binance currency all trades (made manually or by an EA) from an MT5 account (including demo) by the specified symbol and/or magic number. 3. Import(automatic copying) to the specifie
One of the main Forex secrets is that the majority of these systems don't actually work. They have been developed by marketers, and are designed to sell, and not work. Once you have paid for the signals or automated software, you will not be able to get your money back ,and such tools would hardly bring you any profit. Forex trading may make you rich if you are a hedge fund with deep pockets or an unusually skilled currency trader. But for the average retail trader, rather than being an easy roa
This algorithm uses real time data to generate signals with an accuracy rate of 80%. It shows entries and where you should place both the stoploss and the take profit for each trade. It determines trend! It can even help you to become a signal provider! And it can generate up to 8 signals a day! You get access to a free forex trading community Operates on any broker compatible to synthetic indices and forex
if you need any assistance whatsapp +2774 35 35 744 or telegram link @pipsempire01
트레이딩 전략과 기술 지표를 판매하기에 가장 좋은 장소가 왜 MetaTrader 마켓인지 알고 계십니까? 광고나 소프트웨어 보호가 필요 없고, 지불 문제도 없습니다. 모든 것이 MetaTrader 마켓에서 제공됩니다.
