 MetaTrader 5
 Experts
 지표
 라이브러리
 유틸리티
 위젯
 규칙
MetaTrader 5용 Expert Advisor 및 지표 - 140
 트레이딩 로봇과 지표를 사용하여 외환 거래를 더 수익성 있게 만들 수 있습니다. 트레이딩용 로봇을 사용하면 개점 및 폐점 거래를 자동화할 수 있으며, 지표는 시장 행동을 보다 정확하게 예측할 수 있습니다.
이 페이지에는 MetaTrader 5 응용 프로그램의 카탈로그가 나와 있습니다.
(Multiple Close All) for MT5 a lightweight and efficient utility designed to help traders close their open positions and pending orders directly from the chart.
It provides a clean panel with interactive buttons, allowing quick closing of opened trades and deleting the Pending Orders with one click. Key Features: Close all BUY , SELL , or ALL positions with one click. Close only profitable trades or only losing trades . Close trades filtered by Magic Number or Ticket Number . Perform par
FREE
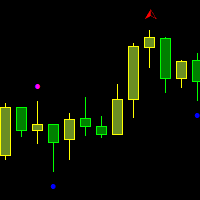
Fractals Broken/Unbroken This indicator detects classic Bill Williams fractals and separates them into two categories: broken and unbroken fractals. The tool helps traders quickly identify which fractal levels have already been broken by price action and which levels remain intact as potential support or resistance zones. The indicator works directly on the chart and displays different fractal types using separate colors for easier visual analysis. How It Works The indicator uses the standard 5-
FREE
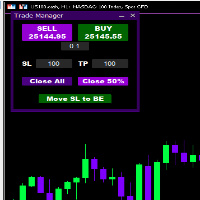
Introducing * *Trader Manager** for MetaTrader 5 - the most efficient tool for managing your trades and it's free! This smart assistant automatically sets **Stop Loss** and **Take Profit** immediately after opening a trade, saving you time and reducing the risk of errors.
With the ability to set a **Maximum Daily Loss** , you'll protect yourself from the dangers of **overtrading** and keep control of your finances.
Plus, you'll get a host of other features for easy position management: -
FREE
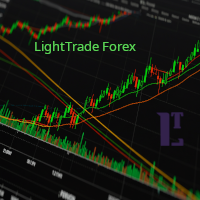
EMA Line Visualizer with Trend Analysis Description:
The Exponential Moving Average (EMA) Line Visualizer EA plots multiple EMAs on your chart (25, 50, 100, 200, and a custom EMA) and analyzes real-time trend direction. It detects whether the market is currently in an Uptrend , Downtrend , or Flat condition based on the latest EMA relationships. Features: Multi-EMA Display
Plot multiple EMAs with customizable periods. Custom Colors
Set distinct colors for each EMA line for better visual trac
FREE

설치 전에 확인하십시오: 이 도구가 하지 않는 것. 이 부분을 먼저 읽으십시오. 아래 항목 중 하나가 찾으시는 기능이라면 이 도구는 맞지 않으며, 차트에 올리기 전에 아는 것이 낫습니다.
- 가상 스탑이나 숨김 스탑은 절대 없습니다. 모든 스탑은 브로커 서버에 실제로 등록되는 스탑이며, 브로커와 프랍 회사 모두에게 보입니다. 어느 쪽에도 아무것도 숨기지 않는 것이 설계 원칙입니다. - 차트당 하나의 심볼. 무료 버전은 부착된 차트의 심볼만 거래합니다. 여유 한도 예측도 이 패널이 이 심볼에서 수행하는 거래만을 대상으로 합니다. 여러 심볼을 동시에 거래하신다면 예측이 계좌 전체를 볼 수 없습니다. 이는 단일 차트 도구의 실제 기능 한계이지, 꺼 놓은 기능이 아닙니다. - 스트래티지 테스터 거래 불가. 클릭 패널은 테스터에서 의미 있게 클릭할 수 없습니다. 패널이 그려지기는 하지만 그것이 전부입니다. - Risk Sentinel 또는 Prop Guardian과 같은 차트에서 사용할
FREE

Click2FiboDrawer – Instantly Draw Fibonacci Retracement Lines with 2 Clicks Click2FiboDrawer is a powerful manual drawing tool for discretionary traders who use Fibonacci retracements in their technical analysis.
With just two mouse clicks, you can draw clean and precise Fibonacci levels directly on your chart — no clutter, no menus, no hassle. Even during fast-paced scalping sessions, this tool enables you to quickly add Fibonacci retracement levels and react to market moves in real-time.
It’s
FREE
EdgeZone EA Inspector - FREE Edition Monte Carlo Analysis Tool for Trading Strategies Important: This is an analysis tool, not a trading robot. It does not execute trades but analyzes strategy data through statistical simulations. The Problem Many Expert Advisors show impressive backtest results but fail in live trading. The most common reason: over-optimization - the strategy was adjusted until it looks perfect for past data, but doesn't work for the future. The Solution: EdgeZone EA Inspector
FREE

MT5 Tick History Sync – Real Tick Downloader, History Verification & Data Export Download. Synchronize. Verify. Export. Make Every Backtest Count. Are you confident that your MetaTrader 5 backtests are using complete real tick history? Missing historical ticks can compromise the reliability of your backtesting results, especially when testing scalping strategies, high-frequency trading systems, and Expert Advisors that depend on precise price movements. MT5 Tick History Sync by Zistilo is a prof
FREE
Breakout Shift Trader – MT5 Indicator Trade Like the Market Architects — Not the Victims. Most traders are fighting blind against a rigged game. Market makers engineer false breakouts, liquidity grabs, and “stop hunts” that wipe out retail accounts in seconds. Breakout Shift Trader flips the script. This MT5 indicator decodes the footprints left by institutional manipulation and aligns your trades with the power brokers driving real price action. Proven Results – Tested, Verified, Relentless N
FREE

This indicator automatically draws horizontal lines at 00s, 20s, 50s and 80s levels. If you trade ICT concepts and are an ICT Student, then you know that these levels are used as institutional support/resistance levels and/or fibonacci retracement anchor points. Features
Draws horizontal lines at 00, 20, 50 and 80 levels above and below current market price . Choose the amount of levels to show on chart Customizable line colors Recommended for forex currency pairs. Saves time looking for thes
FREE

Correlation Coefficient PRO + Moving Average Advanced dual-asset correlation indicator with dynamic smoothing Overview Correlation Coefficient PRO + MA is a powerful indicator that measures the statistical correlation between the current chart symbol and any secondary instrument in real time. Displayed in a separate window, it gives traders an immediate visual reading of how two assets move in relation to each other — whether they trend together, diverge, or move inversely. The built-in Moving A
FREE
Description This is a utility tool for MT5, and it displays some useful information on charts for discretionary trading. Some of the information obtained by using indicators that are standardly installed by MT5 or by manual calculation is displayed on the chart from the beginning.
Benefits of the This Is Something Useful MT5 The minimum necessary information that needs to be confirmed in discretionary trading can be displayed on the chart at any time. By using this tool, you can quickly access
FREE

Colors generated according to the Height and Depth parameter.
The analysis is carried out following the direction of the price and volume traded if the traded value exceeds the calculation base the system changes the color to green, informing you that the price direction is strong to buy, if the traded value is less than the calculation base the system changes to red, indicating that the price is strong for sale.
FREE

Samurai VFX Samurai VFX is a visual indicator that displays an animated samurai character directly on the chart window. It does not generate trading signals and does not modify chart data. The indicator is intended to enhance the visual appearance of the trading workspace. Features The indicator renders an animated samurai figure with multiple visual phases that cycle automatically. Each phase presents a different pose and visual effect, including a resting stance, energy aura, and a charge seq
FREE

Multichart Dashboard — Your Central Command Center for Trading
The **Multichart Dashboard** Expert Advisor transforms your MetaTrader interface into a clean, professional trading hub. Manage up to **6 charts simultaneously** , switch between symbols in an instant and always stay in control — all within one compact, fully configurable panel.
What does Multichart Dashboard do?
**Up to 6 charts in parallel** — Set the desired number of charts (1–6) with a single input. All associated charts are
FREE

Attention ! !! Buffer indicator, PERFECT FOR USE IN THE EXPERT ADVISOR! The DynamicFibo indicator automatically indicates horizontal Fibonacci levels on the chart online. The levels are recalculated automatically online. The levels can be calculated from the current chart as well as from any other time frame. It is convenient to use levels from an older time frame, and trade on a shorter time frame. Any levels are set manually in the indicator settings. IT is IMPORTANT to separate the levels i
FREE
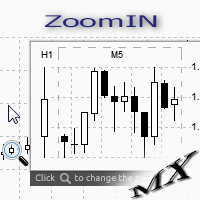
The ZoomIN MT5 indicator is designed for quickly viewing the selected bar on the smaller timeframes in a pop-up window. Once launched, the indicator works in the background, does not take up space on the chart and does not consume system resources. When the indicator is activated by the Shift + i combination (can be changed in the settings), a pop-up window with a chart of a smaller timeframe is created. The displayed timeframe can be changed by a left-click on the magnifying glass icon. To hide
FREE

Signal Navigator - Multi-Timeframe Trend and Momentum Indicator for MetaTrader 5 Signal Navigator is a technical analysis indicator for MetaTrader 5 that combines trend analysis, momentum confirmation
and multi-timeframe market information in a single chart interface.
The indicator uses Moving Average slope analysis together with RSI conditions to evaluate the current market direction and
generate visual Buy and Sell signals. In addition, it provides an overview of the trend situation across sev
FREE

RTrade panel is easy trading panel use both (Stop Loss & Take Profit) based on pips with easy interface can be use by anyone
Panel Feature: -Open position based on (Lot) size
-Auto detect entry price -Use Stop Loss based on (pips) -Use Take Profit based on ( pips ) -Close all position in one button click
i will add more function in future update if you like it write your review
FREE

A indicator for detecting FVGS
I hope this helps you scalp and generate money for yourself
NOTE BETTER:
Trading is risky and you can lose all your funds , use the money you are willing to lose
NOTE BETTER:
Trading is risky and you can lose all your funds , use the money you are willing to lose
NOTE BETTER:
Trading is risky and you can lose all your funds , use the money you are willing to lose
FREE
BBTrend is a powerful trend analysis tool designed to provide a clear overview of market volatility and trends at a glance.
This indicator calculates the difference between two Bollinger Bands of different periods,
visually indicating the strength of upward or downward trends to traders. Clear Trend Visualization: The upward trend is represented in green, and the downward trend in red,
allowing traders to intuitively grasp the direction and strength of the trend. Standardized Percentage Disp
FREE

Santa Donchian Indicator is an efficient way to detect support, resistence and break outs in any market.
The Donchian channel measures the high and the low of a previously defined range. Typically, a trader would look for a well-defined range and then wait for the price to break out to either one side for a trade entry trigger. Advantages Never repaints, never backpaints, never recalculates. Works in all symbols and all timeframes. Perfect trend filter for any strategy or expert advisor. Full
FREE

The Buffer Reader will help you to check and export the custom indicators buffers data for your current chart and timeframe. You can select the number of buffer and historical bars to read/export. The data can be exported in a CSV format and the files will be stored in the folder: \MQL5\Files .
How it works Put the number of buffers to read in the Buffers_Total input parameter. Put the number of rows to display in the Rows_Total. Choose the CSV separator in the parameter. Copy the correct nam
FREE
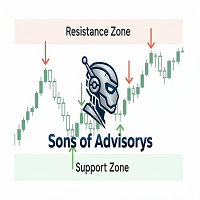
Sons of Advisorys: QuantumLevel This advanced MT5 Expert Advisor automates trading decisions based on a robust Support and Resistance breakout and retest strategy. It performs multi-timeframe analysis across H4, H1, and M15 charts to identify high-probability trade setups with precise zone validation. Key Features: Strategy: Support/Resistance breakout with retest continuation. Multi-Timeframe Detection: Independent analysis and toggle options for H4, H1, and M15 timeframes. Auto-Trading:
FREE

Multi-timeframe trend indicator based on the ADX / ADXWilder indicator with Fibonacci levels
The indicator shows trend areas using ADX or ADXWilder indicator data from multiple timeframes. The impulse mode of the indicator allows you to catch the beginning of a trend, and several "Screens" with different timeframes allow you to filter out market noise. Fibonacci levels are added to the price chart, which have flexible settings.
How the indicator works: if PDI is greater than NDI, then it`s
FREE
Introduction to GARCH Indicator GARCH is the short initial for Generalized Autoregressive Conditional Heteroskedasticity and it is the volatility prediction model commonly used in financial industry. GARCH model was first appeared in the work by Danish Economist, Tim Peter Bollerslev in 1986. The 2003 Nobel Prize winner, Robert F Engle also added much contribution for the refinement of GARCH model with Tim’s work. Our GARCH INM predictor took the original method of Nelder Mead for GARCH model bu
FREE
Overview QuantumEdge Oscillator is a professional-grade trading indicator that combines advanced momentum analysis with sophisticated trend detection algorithms. This 30-day trial version provides full access to all features, allowing you to thoroughly test its capabilities in live market conditions before making a purchase decision. Key Features Dual-Signal System : Combines RSI moving average with smoothed ATR-based volatility bands Multi-Timeframe Analysis : Built-in support for higher timefr
FREE

The indicator ColorCandlesDaily draw candles with different colors depending on the day of the week.
FREE

이 무료 EA는 5분(M5) 차트 전용으로 설계되었습니다.
또한 거래 통화는 일본 엔(JPY) 기준 전용입니다.
USD나 EUR 기준으로 백테스트나 실제 운용은 불가능하도록 설정되어 있습니다.
거래 로트 역시 0.01로 고정되어 있습니다.
어디까지나 백테스트용 EA라는 시험용 제품으로 봐 주시기 바랍니다.
실제로 포워드 테스트에서도 사용하고 있으므로, 라이브 신호 다운로드가 계속된다면 공개할 계획입니다.
TYO EA LAB의 개발 철학
TYO EA LAB에서는 프로프 펌의 운용 사고방식을 도입한 퀀트 EA 개발을 진행하고 있습니다.
중시하는 것은 단일 EA의 일시적인 성과가 아니라, 여러 전략을 조합했을 때의 안정성, 분산성, 그리고 실제 운용에서의 재현성입니다.
개발에는 장기 검증 데이터에 더해 AI를 활용한 데이터 마이닝을 활용하고 있습니다.
시장 데이터를 다각적
FREE

트레이더라면 누구나 아는 절차가 있습니다. 지표 설정을 열고, 숫자를 바꾸고, 확인을 누르고, 차트를 눈을 가늘게 뜨고 들여다보고, 아니라고 판단한 뒤 다시 설정을 엽니다. Relative Vigor Index는 설정할 숫자가 기간 하나뿐이지만, 내 종목에서 10과 14를 비교해 보고 싶을 때마다 그 한 번의 설정창 왕복이 똑같은 '바꾸고 노려보기' 과정을 요구합니다. RVI Live Tuner가 그것을 끝냅니다. 이것은 차트 위에서 실시간으로 조절하는 고전적인 2선 구성의 RVI(RVI와 그 Signal)입니다. 차트 위에 기간 슬라이더가 달린 작은 패널이 놓입니다. 슬라이더를 끌면 두 라인이 보는 앞에서 즉시 다시 계산되고 다시 그려집니다. '10이냐 14냐' 하는 질문은 포럼 글이 아니라 내 차트에서 몇 초 만에 답이 나옵니다. 껍데기가 아닌 진짜 RVI. 이 지표는 교과서적인 계산을 직접 구현합니다. 4개 봉에 대칭 가중치를 준 close-to-open 움직임과 high-to
FREE

DIRECTION STRENGTH is an indicator designed to analyze the current market movement. It helps you understand not only where the price is moving , but also how strong the movement is, how long the current series has lasted, and how likely it is to continue based on historical matches. What do you see on one screen? DIRECTION → where the market is moving
STRENGTH 0–100 → how strong the movement is
SERIES → how many candles the movement has continued
TIME → how long the current series has lasted
H
FREE

One of the simplest Pivot Point indicator, easy to operate, and most complete for a single chart in determining Resistance and Support level lines.
In single chart, it will show R&S Level Line with 5 popular types of Pivot Point, Highest&Lowest of closing price Include the Trend and up to 3 Time Frames.
Five types (Floor, Woodie, Camarilla, DeMark, & Fibonacci) of popular Pivot Points in determining Resistance and Support levels. With just using simple button on the
FREE

Breakout and Rejection Range Trading is a MetaTrader 5 indicator that identifies two range behaviors: breakouts, when price pushes through a level, and rejections, when price fails at a level and turns back. It maps the range and the trigger levels so you can trade both cases. Features Automatic range mapping: tracks the highest high and lowest low over a lookback window to define the current range top and bottom. Breakout and rejection logic: a close beyond the range marks a breakout; a failure
FREE

UMNi-ALRT MT5 Advanced Trade Alert System UMNi-ALRT delivers structured, detailed Telegram alerts for every stage of your trading activity. More advanced than basic notifications, it provides full trade intelligence — including performance metrics, session context, and market data — in a clean, readable format. KEY FEATURES Full trade open / close alerts with deep detail MFE, MAE and exit efficiency tracking Session-aware candle and bias context Chart updates with spread,
스텝 채널 모멘텀 트렌드 지표 (MT5 Indicator) 스텝 채널 모멘텀 트렌드 는 시장 구조와 동적 변동성 분석을 결합하여 트레이더에게 적응형 이점을 제공하도록 설계된 강력한 모멘텀 기반 지표입니다. 이 도구는 고유한 단계 중간선과 ATR 필터 채널을 사용하여 지연에 의존하지 않으면서 트렌드와 범위를 명확하게 구분하는 데 도움을 줍니다. 주요 기능 구조적 단계 중간선 시스템의 핵심은 확인된 가격 피봇에만 기반한 “단계 Midline”입니다. 새로운 고점이나 저점이 확인될 때만 업데이트하여 불필요한 지연을 제거하고 시장 구조 변화에 즉시 반응합니다. 이 단계적 접근법은 명확한 레지므 전환을 생성하고 가격 현실에 머물게 하여 인디케이터 잡음을 피합니다. 중간선은 최근 강세와 약세 간의 균형을 나타내며 방향, 브레이크 아웃 또는 리트레이스에 대한 신뢰할 수 있는 기준점 역할을 합니다. 동적 변동성 밴드 ATR (Average True Range)을 사용하여 위와 아래 밴드를 작성하여
FREE

Risk Basket Planner Risk Basket Planner 는 MetaTrader 5용 수동 바스켓 리스크 계획 도구입니다. 여러 진입 레벨과 기술적 손절가를 설정하고, 수동 주문 전에 각 레이어의 로트 크기와 실제 리스크를 계산할 수 있습니다. 주요 기능 1~5개의 진입 레이어 지원. BUY 또는 SELL 방향 선택. 계좌 Equity 의 비율로 리스크 설정. L1-L5 가격을 직접 입력하거나 차트에서 드래그 가능. 모든 레이어에 공통으로 적용되는 Technical Stop Loss . Auto SL 80%, 100%, 120% 프리셋. 정확한 가격을 지정하는 Manual SL 모드. 진입가, SL, 리스크 %, 방향, 레이어 수 변경 후 자동 재계산. 활성 레이어에 균등 리스크 배분을 시도하고 브로커 로트 반올림 후 실제 리스크 를 표시. 레이어별 로트, 리스크 %, 리스크 금액, 총 로트, 목표 리스크, 실제 바스켓 리스크 표시. 현재 스프레드와 가장 가까운 SL까
FREE

SterlingSniperBot is an advanced trading algorithm meticulously designed for the GBP/USD currency pair, specifically tailored to operate on 4-hour bars and synchronize seamlessly with brokers in the UTC+2 time zone. This sophisticated bot stands out as a precision instrument in the world of forex trading. Key Features: Timeframe Optimization: Operating exclusively on 4-hour bars, SterlingSniperBot focuses on capturing strategic trading opportunities within this specific time frame, aligning with
FREE

The Moving Average
( https://www.youtube.com/c/TheMovingAverage/ )
inspired to create All in One 4MA-s with his color setting.
It Put up 4 Smoothed Moving Averages
With Arty chosed colors.
You can modify the settings / Parameters of the indicator
It's easy to use don't have to waist time to set up all 4 MA-s
just put this up.
Hope its helpfull and Arty don't mind it.
You can donate my work here:
https://discotechnika.hu/MQL/PayPal_Donate.jpg
or here
PayPal.Me/HunSkippy
FREE
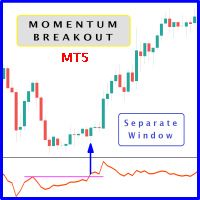
When prices breakout resistance levels are combined with momentum oscillator breaks out its historical resistance levels then probability emerges to record farther higher prices. It's strongly encouraged to confirm price breakout with oscillator breakout since they have comparable effects to price breaking support and resistance levels; certainly short trades will have the same perception. Concept is based on find swing levels which based on number of bars by each side to confirm peak or trough
FREE

VR Locker 는 MetaTrader 4 및 MetaTrader 5용 독특한 전문가 고문으로, 고전적 헤징을 진정한 이익 관리의 예술로 바꿉니다. 시장과 싸우는 대신 VR Locker는 저자의 독특한 포지티브 락 논리를 사용합니다: 로봇이 동일한 수량의 반대 포지션을 열고 가격을 따라 주문 그리드로 「밀어내며」 미실현 이익을 「안전 쿠션」에 축적합니다. 이는 예치금 하락을 줄이고, 종종 0으로 만들며, 트레이더의 스트레스를 덜어줍니다. 9가지 랏 계산 방법, 13가지 거리 유형, 실제 TakeProfit의 4가지 평균화 모드, 여러 락을 동시에 스마트하게 관리하는 기능, Telegram, Push, Email, Alert 통합 알림 시스템은 VR Locker를 시장에서 가장 신중하게 설계된 「락커」로 만듭니다 — 초보자와 전문가 모두에게 이상적인 선택입니다. 설정 파일(set files), 제품 데모 버전, 지침 및 보너스는 [블로그] 에서 확인할 수 있습니다 락 관리

Hello, trading champs! I trust you are doing well. Have you experienced entering a position where the market initially moves in your favour or approach your takeprofit then suddenly the market reversed opposite your position? Well, it has happened to me numerous times and today I decide to fight back.
I present to you a trade manager that help you protect your position(s). This project helps you set your position(s) to breakeven either when a certain amount of pips you specify is reached or a
FREE

# MiniBull Board
**Version 1.14 — MetaTrader 5 indicator (separate window)**
**11 languages: English, Turkish, Russian, Chinese, Spanish, Portuguese, Japanese, German, French, Italian, Korean** — automatically in the language of your MetaTrader terminal, or chosen with a single input.
MiniBull Board is a compact watch-list dashboard for MetaTrader 5. For every symbol you choose it shows where the price stands today, this week and this month: the current price, the day / week / month opening
FREE

Sentimento de Mercado é um indicador que usa os dados do nosso principal indicador: Market Strength Radar.: https://www.mql5.com/pt/market/product/114568?source=Site +Profile+Seller Ele imprime um gráfico de linhas que deve ser comparado com o gráfico de preço para entendermos o sentimento do mercado. As divergencias são pontos importantes de inflexão. As convergências mostram força da tendência atual.
FREE
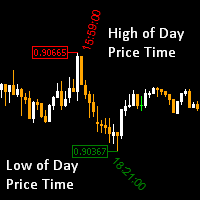
High of the Day and Low of the day Time and Price Fractal Studies is an indicator that will help you identify certain patterns that tend to repeat themseleves at certail times of the day or at certain prices.
It is used to study Daily Highs ad Lows in relation to time and price.
You will get to answer certail questions like:
At what time of day does this market usually turn around. At what price does the market turn. Is it at round numbers etc
FREE
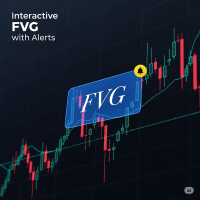
FVG Indicator with Alerts Description: This is a simple and effective indicator for identifying and displaying Fair Value Gaps (FVGs) on any timeframe. The indicator helps you see important price imbalances and provides powerful interactive tools for your analysis. Key Features: Detects FVGs: Clearly identifies and draws boxes around Bullish and Bearish Fair Value Gaps. Midline Level: Displays the 50% equilibrium level inside each FVG box, a critical point of interest. Complete Alert System: Rec
FREE
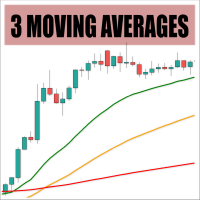
This is a customizable three-moving-averages indicator designed for crossover trading strategies. You can configure each moving average individually, including calculation method (e.g., exponential, simple), period, and price type, all from a single input dialog.
Parameters: Period <1,2,3> - Period of a moving average Shift <1,2,3> - Shift of a moving average Method <1,2,3> - Method of calculation for each moving average set separately Applied Price <1,2,3> - Set price type for calculations for
FREE
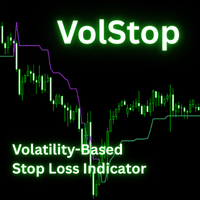
The VolStop Adaptive Volatility-Based Trailing Stop Indicator for MT5 VolStop is a precision volatility-stop indicator for MetaTrader 5, built for traders who want to stay in winning trades longer and exit with discipline. Instead of fixed pips or moving averages, VolStop dynamically tracks price action with ATR-based bands, automatically adapting to market turbulence. Key Features Adaptive Volatility Stops – Calculates a dynamic trailing stop using ATR and a user-set multiplier to match changi
FREE

The euro index on your chart, built live from your own broker's five euro pairs. When EURUSD falls you cannot tell from EURUSD alone whether the euro is weak or the dollar is strong. An index answers it. Put this under any chart and you are looking at the euro on its own terms, measured against the pound, the yen, the franc and the krona as well as the dollar. It uses the New York Board of Trade Euro Currency Index formula. EUR/USD 31.55% EUR/GBP 30.56% EUR/JPY 18.91% EUR/CHF 11.13% EUR/SEK 7.85
FREE

Product name: BVCandleStream Overview Background service that automatically creates custom tick-based symbols (equal-tick bars) for scalping and price action analysis.
It converts raw ticks of standard symbols into custom bars with a fixed number of ticks per bar, so you can apply any standard MT5 indicators or EAs to these synthetic tick charts.
Key Features 1. Tick-Based Bar Generation Monitors the symbol of the open chart and automatically groups ticks into bars at the specified count ( InpT
FREE

BS Trade Panel: Revolutionize Your Trading Approach Introducing the BS Trade Panel , the ultimate solution for traders seeking efficiency, speed, and accuracy in their market operations. Crafted with cutting-edge technology, our panel is designed to simplify your trading, making it more intuitive, swift, and effective. Innovative Features: Quick Orders with Shortcut Keys: Execute market orders or pending orders swiftly using configurable shortcut keys. Perfect for traders who need speed when ent
FREE

Collective TP SL Manager is a MetaTrader 5 utility that manages a combined take-profit and stop-loss across many open positions on one symbol. Instead of setting TP/SL per order, it watches the net profit or loss of all (or filtered) positions and closes the basket when your target is reached. Features Basket-level targets: one collective take-profit and one collective stop-loss for the whole group of positions. Net P/L monitoring: continuously sums the profit/loss of all selected positions in
FREE

InnovaDash 로트 크기 계산기: 원클릭 위험 관리 터미널 더 이상 로트 크기를 추측하거나 의도한 것보다 더 많은 위험을 감수하지 마십시오. InnovaDash 로트 크기 계산기는 전문적인 위험 관리 및 빠른 실행 기능을 MT5 차트로 직접 가져오도록 설계된 정확하고 컴팩트한 거래 유틸리티입니다. InnovaDash Analytics 팀이 개발한 이 도구는 귀하와 같은 트레이더를 위해 완전히 무료로 배포됩니다. 빠른 실행이 필요한 스캘퍼이든, 진입을 계획하는 스윙 트레이더이든, 이 도구는 실시간 시장 데이터, 매수/매도(Bid/Ask) 스프레드 및 심볼 틱 가치를 기반으로 위험 계산을 즉각적으로 처리합니다. 핵심 기능 동적 위험 계산: 자본 위험을 관리할 방법을 정확하게 선택하십시오. 계좌 잔액의 정확한 위험 비율(%) 또는 고정된 현금($) 금액 간에 쉽게 전환할 수 있습니다. 스마트 레벨 감지 (SL 및 TP): 손절매 (Stop Loss): 포인트 단위로 거리를 입력하거나
FREE

GoldPro EA - 귀하의 전문 XAUUSD 트레이딩 파트너 검증된 여러 전략으로 자신감 있게 금 거래하기 GoldPro EA 는 MetaTrader 5에서 XAUUSD(금) 거래를 위해 독점적으로 제작된 정교한 Expert Advisor입니다. 추세 거래, 돌파 거래 또는 스캘핑 기회를 찾고 있든, 이 EA는 지능적인 전략 선택과 전문적인 리스크 관리로 시장 상황에 적응합니다. GOLDPRO EA가 돋보이는 이유 XAUUSD 전문가 - 일반 멀티 페어 EA가 아닙니다 금 거래를 위해 독점 최적화 - XAUUSD 변동성에 맞춰 모든 매개변수 조정 금의 고유한 가격 행동 및 시장 역학 이해 귀금속 거래를 위해 특별히 작동하는 전문 전략 하나의 EA에 3가지 강력한 전략 1. 추세 추종 - EMA 교차 + RSI 확인으로 강한 방향성 움직임 포착 2. 돌파 거래 - 모멘텀 필터로 지지/저항 돌파 활용 3. 스캘핑 모드 - 과매수/과매도 수준에서 빠른 반전 (선택사항)

Thank you for your interest in The Tail.
I have been trading since 2018. Or rather, it’s not me who trades, but the army of my robots, which I constantly develop. Tail is one such candidate.
This robot works on moving averages, filters trades by RSI.
The robot provides the functionality of volume and position control.
Combine different approaches. I recommend using it in a group of 3-5 of the same robots on different instruments for the best result.
I recommend keeping a high value of the
FREE

The Real Flow Defense Levels indicator is a proprietary tool designed to identify and plot significant, high-conviction price zones directly onto your main trading chart. It uses a dynamic, volume-based analysis to determine where the market has previously demonstrated the strongest defense or concentration of activity . These plotted lines serve as dynamic support and resistance levels , highlighting the prices where major participants are most likely to enter or defend their positi
FREE

1️⃣ SHORT DESCRIPTION (Market Preview Text) Smart Basket Pro is an RSI-based basket grid Expert Advisor for MT5, using fixed-lot grid trading (no martingale) with smart basket take-profit and built-in safety protections. Designed for stable, long-term automated trading on Forex pairs. 2️⃣ FAQ – BUYER QUESTIONS (Very Important for Sales) What strategy does Smart Basket Pro use? Smart Basket Pro uses RSI extreme levels to open an initial trade and manages positions using a fixed-lot grid

Institutional Price Discovery & Automated Structure Mapping
The Adaptive Auction Range Engine MT5 is a professional-grade structural mapping tool engineered for traders who specialize in Auction Market Theory , Liquidity Sweeps , and Market Structure Shift (MSS) . Unlike standard fixed-period box drawing indicators that clutter your screen with dead data, this engine tracks the physical footprint of institutional volume footprint in real time. It uses a Price-Adaptive Algorithm that d
FREE

Mahdad Candle Timer 는 가볍고 정밀한 MetaTrader 5용 지표로, 현재 캔들이 마감될 때까지 남은 시간을 최신 봉 옆에 실시간으로 표시합니다. 스캘핑, 데이 트레이딩, 또는 스윙 트레이딩에서 캔들 확정을 기다리는 등 정확한 타이밍을 중시하는 트레이더에게 적합합니다. 주요 기능 정확한 카운트다운 – HH:MM:SS 형식으로 남은 시간 표시 (옵션: 밀리초) 동적 위치 조정 – 차트 확대/축소와 관계없이 항상 최신 캔들과 정렬 스마트 색상 적응 – 배경 및 캔들 방향(상승/하락)에 따라 텍스트 색상 자동 변경 사용자 알림 – 캔들 마감 X초 전에 사운드 또는 팝업 알림 제공 완전한 사용자 설정 – 글꼴, 크기, 색상, 새로고침 속도, 알람 설정 가능 가볍고 효율적 – CPU 사용 최소화, 다른 지표나 EA와 충돌 없음 ️ 입력 파라미터 Sow Milliseconds (true/false) Update Interval (ms) Bullish/Bearish C
FREE

Indicador Volatilidade Histórica Indicador é um oscilador que faz o plot da volatilidade histórica de um ativo, representado pelas fórmulas: Volatilidade Histórica = Raiz quadrada da média das diferenças ao quadrado * Fator de anualização. Média das diferenças ao quadrado = soma de todas as diferenças de retorno diário / número total das diferenças. Retorno diário = (preço atual - preço anterior) / preço anterior. Nesse indicador estamos utilizando os preços de fechamento de cada barra e fazemos
FREE

Multi-timeframe trend indicator, based on the ADX / ADXWilder indicator The indicator shows trend areas using ADX or ADXWilder indicator data from multiple timeframes. The impulse mode of the indicator allows you to catch the beginning of a trend, and several "Screens" with different timeframes allow you to filter out market noise.
How the indicator works: if PDI is greater than NDI, then it`s bullish movement; if PDI is less than NDI, then it`s bearish movement; to determine any trend, it is
FREE

DS Trend is a free trend indicator that colorizes candles directly on the chart, making it easy to identify the current market direction at a glance.
Candle colors: - Blue: uptrend in progress - Gray: neutral market / consolidation - Red: downtrend in progress
Parameters: - Period (default 20): controls the indicator responsiveness to recent price action - Sensitivity (default 2): adjusts the threshold for trend detection
Works on all symbols and timeframes. No repainting. Simple visual read
FREE

Introducing Steady Runner NP EA (Free Version): Precision Trading for GBPUSD M5 What is Steady Runner NP EA?
Steady Runner NP EA is a mathematically designed Expert Advisor (EA) exclusively crafted for the GBPUSD M5 timeframe . Built with advanced algorithms and statistical models, this EA automates your trading strategy to deliver precision, consistency, and discipline in every trade. Whether you're a seasoned trader or just starting out, Steady Runner NP EA is your reliable par
FREE
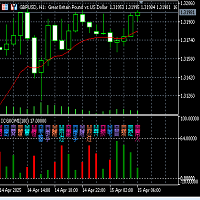
Fuxi Guaxiang Dual-color Oscillation Indicator Function and Usage Instructions (V2.1)
Fuxi Guaxiang Dual-color Oscillation Indicator Instructions: (1) This Guaxiang change indicator is based on the Yin-Yang transformation thought of the "Book of Changes" philosophy in ancient Chinese culture, integrating the results of the long-short game in each candlestick K-line period of the financial trading K-line chart, using China's oldest predictive coding method, in the form of the 64 Guaxiang of the
FREE

This indicator, the Phoenix Moving Average Panel, is a professional-grade visual dashboard designed to remove guesswork from trend-following strategies. It transforms a standard Moving Average into a functional trading workstation. Here is how it assists a trader in making precise decisions: 1. Identifying the Buy/Sell Zone (The Trend Matrix) Instead of looking at just one line, the panel provides a Three-Tier Trend Confirmation: Current Trend: Shows the immediate momentum on your active chart.
FREE

MSX Heikin Ashi Advanced Overview MSX Heikin Ashi Advanced is a MetaTrader 5 indicator designed to provide a smoothed visual representation of price movement using a modified Heikin Ashi calculation. The indicator applies Heikin Ashi calculations to user-selected price sources and displays color-based candles that may assist with trend observation and market structure analysis. Features • Modified Heikin Ashi candle calculation • Real-time candle updates • Multiple applied price options • Color
FREE

Candle color RSI (Relative Strength Index) indicators change candlestick colors on the price chart to visually show RSI conditions like overbought/oversold levels or bullish/bearish momentum, using colors like red for overbought/bearish and green for oversold/bullish, helping traders spot reversals or strength at a glance without looking at the separate RSI pane. These custom indicators often color candles red above 70 (overbought), green below 30 (oversold), and keep default colors in between
FREE
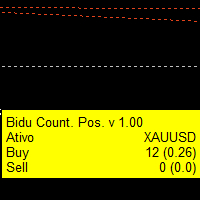
Indicador que cria um painel para acompanhamento to total de posições abertas no ativo do gráfivo.
São apresentados os dados: Ativo do gráfico Total de posições de venda em aberto Quantidade do volume de posições de venda em aberto Total de posições de compra em aberto Quantidade do volume de posições de compra em aberto.
Painel simples mas eficiente para o equilíbrio das ordens
FREE

パラボリックのデータをもとにトレンドの方向性を1分足から月足まで表示します。 1分足から 月足 まで表示されているので今どの方向に価格が動いているのかがすぐに分かります。
更新はティク毎ではなくディフォルトでは1秒毎、もちろん変更も可能なのでチャートの表示が遅くなるようなことはありません。
機能:
どの通貨でも表示可能になります。
アイコンの色を指定することが可能になります。
表示位置(X軸、Y軸)が変更可能 になります。
表示位置 (左上 、 右上 、 左下 、 右下) が 指定 が可能 になります。
フォント を指定することが可能になります。
フォントサイズ が 変更可能 になります。
アイコンのサイズ が 変更可能 になります。
週足、 月足 の非表示 が 可能 になります。
FREE

시장 팔레트는 관성 및 가격 변동의 가속을 기반으로 거래 결정을 필터링하기위한 강력한 도구입니다.
_________________________________
지시자 신호를 이용하는 방법:
표시기는 세 가지 색상의 히스토그램 신호를 생성합니다. 표준 색 구성표에서 파란색 열이 나타날 때 긴 포지션 만 유지하고 빨간색 열이 나타날 때 짧은 포지션 만 유지하고 회색 열이 나타날 때 거래 행동을 삼가하는 것이 좋습니다. 더 높은 열의 모양은 가격 움직임의 임계점의 형성을 의미합니다-열의 색상을 변경할 확률이 높습니다.
_________________________________
표시기 매개 변수는 히스토그램 표시 스타일을 변경하는 것이 좋습니다. 계산에 사용되는 매개 변수를 변경하는 것은 제공되지 않습니다-이 내 제품의 철학 때문이다:안정성과 객관성.
_________________________________
귀하의 질문 및 제안을 환영하며 비공개 메시지로 보낼 수 있습니
FREE
MetaTrader 마켓은 개발자들이 거래 애플리케이션을 판매할 수 있는 간단하고 편리한 사이트이다.
제품을 게시하고 마켓용 제품 설명을 어떻게 준비하는가를 설명하는 데 도움이 됩니다. 마켓의 모든 애플리케이션은 암호화로 보호되며 구매자의 컴퓨터에서만 실행할 수 있습니다. 불법 복제는 불가능합니다.
