MetaTrader 5용 새 기술 지표 - 63

Hey there! If you are using Moving Average indicator into RSI indicator's window and always wondering if there could be a way to get alerts on your smartphone when those two indicators get a crossover that would be great, right!? Then you have found the right tool for that. This indicator is nothing but a mix of MA indicator and RSI indicator into one indicator window as well as it will give you alerts for crossovers on your smartphone app, email and also on your trading terminal's (desktop) cha
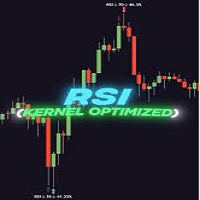
GENERAL OVERVIEW
Introducing our new KDE Optimized RSI Indicator! This indicator adds a new aspect to the well-known RSI indicator, with the help of the KDE (Kernel Density Estimation) algorithm, estimates the probability of a candlestick will be a pivot or not. For more information about the process, please check the "HOW DOES IT WORK ?" section. Features of the new KDE Optimized RSI Indicator :
A New Approach To Pivot Detection
Customizable KDE Algorithm
Realtime RSI & KDE Dashboard
Alert
OVERVIEW
A Lorentzian Distance Classifier (LDC) is a Machine Learning classification algorithm capable of categorizing historical data from a multi-dimensional feature space. This indicator demonstrates how Lorentzian Classification can also be used to predict the direction of future price movements when used as the distance metric for a novel implementation of an Approximate Nearest Neighbors (ANN) algorithm. This indicator provide signal as buffer, so very easy for create EA from this indi
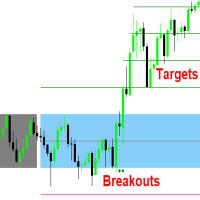
This indicator measures and displays the price range created from the first period within a new trading session, along with price breakouts from that range and targets associated with the range width. The Opening Range can be a powerful tool for making a clear distinction between ranging and trending trading days. Using a rigid structure for drawing a range, provides a consistent basis to make judgments and comparisons that will better assist the user in determining a hypothesis for the day's pr

This indicator automatically draws trendlines, Fibonacci levels, support and resistance zones, and identifies BOS (Break of Structure) and CHOCH (Change of Character) patterns on the chart. Just by placing it on the graph, it handles the essential technical analysis tasks for traders, providing a streamlined, effective trading tool this tools is alway make every one easy for trading.

Supply & Demand Visible Range Indicator with Smart Alerts
Master the art of supply and demand trading with this powerful indicator that brings institutional-grade volume analysis to your charts! This sophisticated tool helps you identify key market levels where big players are active.
Key Features: - Dynamic supply and demand zone identification based on volume analysis - Smart alerts at crucial price levels (supply, demand, and mid-point zones) - Volume-weighted average calculations for pr
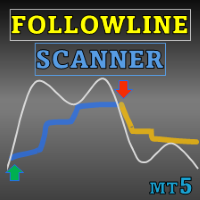
Special offer : ALL TOOLS , just $35 each! New tools will be $30 for the first week or the first 3 purchases ! Trading Tools Channel on MQL5 : Join my MQL5 channel to update the latest news from me Follow Line MT5와 스캐너로 거래에서 앞서 나가세요. 이 고급 변동성 기반 지표는 진지한 트레이더를 위해 설계되었습니다. 이 도구는 Bollinger 밴드의 강력한 기능과 맞춤 설정을 결합하여 가격 움직임에 대한 정확한 통찰력을 제공합니다. See more MT4 version at: Follow Line MT4 with Scanner See more products at: https://www.mql5.com/en/users/ndhsfy/seller Follow Line의 핵심은 가격이 1
FREE

Golden Spikes Indicator Technical indicator for synthetic indices trading on M1 timeframe. Compatible with Boom/Crash indices on Deriv platform and Gain/Pain indices on Weltrade platform. send me A private message to receive trade ASISTANT EA.. booklet guide: https://drive.google.com/file/d/1knQJqGHZSP5eQN24ndRz2ayZVCst6XhN/view?usp=sharing
Also check my premium spikes bot: https://www.mql5.com/en/market/product/142350 Features Uses Parabolic SAR, RSI, and Bollinger Bands analysis Three risk

이 지표는 사용자가 원하는 두 가지 색상 간의 부드러운 전환을 적용하여 차트의 외관을 완전히 변화시킬 수 있도록 설계되었습니다. 이 기능을 통해 차트의 배경에 매력적인 그래디언트를 추가하면 차트가 더욱 신선하고 현대적인 느낌을 주게 됩니다. 시각적으로 더 매력적인 차트를 만들어 거래를 할 때 더욱 쾌적한 경험을 제공할 것입니다. 지표가 차트에 첨부되면 현재 차트에 있는 모든 지표 창에 그래디언트가 자동으로 적용됩니다. 이후에 추가되는 새로운 지표 창에도 동일한 그래디언트 효과가 적용되므로, 모든 지표가 일관된 외관을 유지하게 됩니다. 이 지표를 한 번 사용해 보세요! 차트의 외관을 새롭게 변화시켜 더 매력적이고 눈에 띄는 거래 환경을 만들어 보세요. 그래픽적으로 개선된 차트는 거래에 대한 집중력을 높이고 더 나은 결정을 내리는 데 도움이 될 것입니다.
FREE
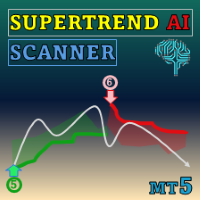
Special offer : ALL TOOLS , just $35 each! New tools will be $30 for the first week or the first 3 purchases ! Trading Tools Channel on MQL5 : Join my MQL5 channel to update the latest news from me MetaTrader 5 (MT5) 용의 혁신적인 거래 도구인 SuperTrend AI Clustering MT5 with Scanner 로 AI의 힘을 발견하세요. 이 지표는 K-means 클러스터링과 널리 알려진 SuperTrend 지표를 결합하여 시장 분석을 재정의하고, 거래자가 트렌드와 신호를 탐색할 때 유리한 위치를 차지할 수 있도록 합니다. See more MT4 version at: SuperTrend AI Clustering MT4 with Scanner See more products at:
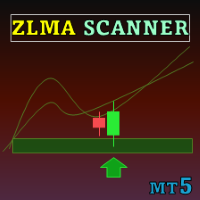
Special offer : ALL TOOLS , just $35 each! New tools will be $30 for the first week or the first 3 purchases ! Trading Tools Channel on MQL5 : Join my MQL5 channel to update the latest news from me Zero Lag MA Trend Levels MT5 스캐너 지표는 Zero-Lag 이동평균(ZLMA)과 표준 지수이동평균(EMA)을 결합하여 트레이더에게 시장 모멘텀과 주요 가격 수준에 대한 포괄적인 뷰를 제공합니다. 또한 스캐너와 알림 기능을 통해 트레이더는 여러 통화 쌍 및 타임프레임에서 신호를 쉽게 추적하여 거래 기회를 더 잘 포착할 수 있습니다. See more MT4 version at: Zero Lag MA Trend Levels MT4 with Scanner See more products

Times and Sales Pro: 거래 흐름의 불균형으로 거래를 강화하세요 작은 가격 변동의 기회
Times and Sales Pro 는 Times and Trades 를 통해 주문 흐름을 운영하는 분석가들에게 필수적인 도구입니다. 스캘퍼에게 이상적이며, 높은 정확도로 작은 가격 변동을 활용하고자 하는 분들을 위해 설계되었습니다. 고급 계산을 통해 이 지표는 거래의 불균형을 식별하여 빠른 진입 및 퇴출을 위한 귀중한 신호를 제공합니다. 중요: MT5에서의 Times and Trades 이용 가능성
Times and Sales Pro 를 사용하기 전에 브로커가 MT5에서 Times and Trades 에 대한 접근을 제공하는지 확인하세요. 이 지표는 실시간으로 정확한 계산을 생성하기 위해 이 데이터에 의존하며, MT5는 거래 이력을 저장하지 않습니다. 따라서 이 지표는 실시간에서만 작동하며, 시장에서 실행된 거래에 대한 즉각적인 통찰을 제공합니다. Ti

궁극의 트렌드 분석 인디케이터 소개 트렌드 분석 인디케이터 로 트레이딩을 한 단계 업그레이드하세요! 이 고급 도구는 정확하고 깊이 있는 분석을 원하는 트레이더를 위해 설계되었습니다. 독자적인 수학적 알고리즘 을 활용하여 백테스트를 수행하고, 시장에서 가장 강력한 트렌드를 분석 및 식별합니다. 주요 기능 정확한 스나이퍼급 진입 신호 더 이상 추측은 필요 없습니다 : 트렌드 분석 인디케이터는 트렌드 방향을 매우 높은 정확도로 감지하고 확인하여 최적의 시점에 시장에 진입할 수 있도록 도와줍니다. 수학적 우위 : 독점적인 계산법을 사용하여 시장의 잡음을 제거하고 명확한 매수 및 매도 신호를 제공합니다. 이를 통해 높은 확률의 트레이딩 기회를 포착할 수 있습니다. 통합 백테스트 및 상세 결과 제공 데이터 기반의 신중한 의사 결정 : 이 인디케이터는 단순한 트레이딩 도구가 아닙니다. 고급 백테스트 기능 을 제공하여 과거 데이터를 기반으로 인디케이터의 성능을 즉시 확인할 수 있습니다. 이를 통해
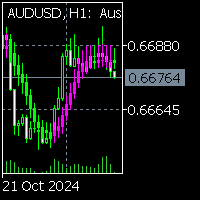
모든 상품과 차트주기에 걸쳐 원활하게 작동하도록 설계된 강력한 도구인 MQL5용 선형 회귀 캔들 인디케이터를 소개합니다.
이 고급 지표는 선형 회귀를 사용하여 캔들 차트에 직접 정확한 추세 시각화를 제공하므로 트레이더가 가격 방향과 잠재적 반전을 정확하게 파악할 수 있습니다.
외환, 주식, 원자재를 거래하든 이 다용도 도구는 시장 역학에 대한 명확한 인사이트를 제공하여 의사결정을 향상시킵니다.
추세 및 박스권 트레이딩에 이상적인 선형 회귀 캔들 인디케이터는 모든 시장 상황에 적응하여 모든 수준의 트레이더에게 일관되고 신뢰할 수 있는 결과를 보장합니다.
궁금한 점이 있으면 언제든지 문의하세요!
https://www.mql5.com/en/users/dennisfinimento (메시지 보내기)
구매자용: 수익성 있는 자동 전략에 포함시키고 싶으시면 언제든지 저에게 연락해 주시면 요청과 피드백에 따라 개인적으로 작업하거나 EA를 시장에 업로드해 드리겠습니다!
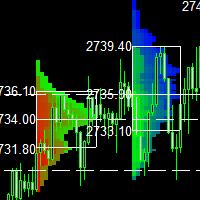
This indicator is a classic implementation of the Market Profile (Volume Profile Visible Range), allowing for the display of price density over time while highlighting the most significant price levels, the value area, and the control price within a specific trading session. MT4-version: https://www.mql5.com/en/market/product/125261
The indicator can be applied across timeframes from M1 to D1, enabling the analysis of market profiles for daily, weekly, monthly, or intraday trading. Utilizing
This indicator helps you monitor multiple currency pairs and timeframes all at once. It displays the occurrence of divergences between price and the MACD indicator in a clear and easy-to-read table. Monitoring multiple timeframes and currency pairs in one place helps traders identify a divergence without needing to switch between charts. Divergences can be bullish or bearish. For example, if the price forms a higher high while the MACD forms a lower high, this indicates bearish divergence. On th
The ATR (Average True Range) Indicator is a powerful tool designed to measure market volatility. This indicator provides accurate data on price movement ranges, helping traders manage risk more effectively and make well-informed trading decisions. Based on the widely-used ATR indicator, it’s suitable for both professional and beginner traders to analyze market volatility. The ATR Indicator allows you to track the current price movement range and use this information to set stop-losses, select en
FREE

This SMT (Smart Money Technique) divergence indicator identifies discrepancies in price movement between two different trading symbols, helping traders detect potential market reversals. This tool compares the price action of two correlated assets, such as two currency pairs or indices, to spot divergences where one asset's price moves in the opposite direction of the other. For example, while one symbol may be making higher highs, the other might be making lower highs, signaling a divergence. T
FREE
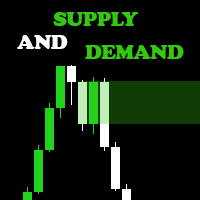
Are you ready to elevate your Forex trading game? Introducing the Supply and Demand Indicator , a powerful tool designed to help traders identify key market zones and make informed decisions with confidence! Key Features: Accurate Zone Identification : Our indicator pinpoints critical supply and demand zones, allowing you to spot potential reversal points and areas of price consolidation. User-Friendly Interface : With an intuitive design, you'll easily navigate through the settings and customiz

Enhance your trading analysis with the Hull Suite MT5, a complete set of Hull Moving Average tools designed for smooth, low-lag trend visualization and enhanced precision. Developed from Alan Hull’s Hull Moving Average (HMA) concept introduced in 2005, this indicator integrates multiple Hull variations into a single flexible system, giving traders the ability to fine-tune responsiveness and visual style for clearer trend identification across forex, indices, commodities (like XAUUSD), and crypt
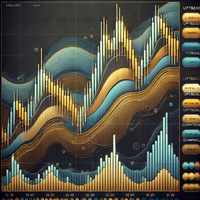
MrGoldTrend is a sophisticated trend-following indicator designed exclusively for XAUUSD (Gold) traders on the MQL5 platform. With clear, easy-to-interpret visual signals, this indicator helps you quickly identify the prevailing trend and make informed trading decisions on the H1 timeframe. MrGoldTrend’s gold lines indicate an uptrend, while blue lines signify a downtrend, providing immediate visual clarity for trend direction. Key Features: Clear Trend Visualization : Gold lines for uptrends, b
FREE

The Simple Market Sessions Indicator helps traders visualize the current status of major forex market sessions: Asian , London , New York , and Sydney . It shows whether each market is Open , Active (based on volume) , or Closed directly on the chart. With customizable session times and a volume threshold, this tool helps traders monitor session activity and volume strength, making it easier to decide the best times to trade.
Key features: Displays status: Open, Active (High Volume), or Closed
FREE

During volatile market conditions brokers tend to increase spread. int OnCalculate ( const int rates_total, const int prev_calculated, const datetime &time[], const double &open[], const double &high[], const double &low[], const double &close[], const long &tick_volume[], const long &volume[], const int &spread[]) { int spread_array[];
FREE

Multi-Timeframe Fractal Indicator Description for MQL5 Introducing the Multi-Timeframe Fractal Indicator! Key Features: Multi-Timeframe Analysis: Analyze Fractals on a timeframe independent of your chart's current timeframe. Gain insights from higher timeframes for informed trading decisions. Customizable Parameters: Timeframe: Choose the timeframe on which Fractals will be calculated (e.g., Daily, H4, etc.). Number of Bars: Specify the number of bars considered around a potential Fractal for c

The Zero-Lag MA Trend Levels indicator combines a Zero-Lag Moving Average (ZLMA) with a standard Exponential Moving Average (EMA) to provide a dynamic view of the market trend. This indicator automatically plots the EMA and ZLMA lines on the chart. The colors of the lines represent the market trend.
With EMA: ++ green (uptrend) when EMA > zlma ++ red (downtrend) when EMA < zlma With ZLMA: ++ green (uptrend) when the line is trending up ++ red (downtrend) when the line is trending down
When th

# Indicador MultiZigZag Pro para MetaTrader 5
O MultiZigZag Pro é um poderoso indicador técnico para a plataforma MetaTrader 5 que identifica, de forma inteligente e flexível, os principais pontos de inflexão e tendências nos gráficos de preços.
## Características principais: - Algoritmo avançado que filtra ruídos e movimentos irrelevantes do mercado - Múltiplos timeframes para análise de tendências de curto a longo prazo - Parâmetros de profundidade e desvio personalizáveis para adaptação a
A buy signal can be seen on the dashboard when the previous signal is red and the next signal is green, then the SAR is green and the RSI is green.
A Sell Signal can be seen on the dashboard when the previous Signal is green and the Signal after it is red, then the SAR is red and the RSI is red.
Line function - shows on the chart the lines of Opening, Stop Loss, Take Profit. With this function, it is easy to create a new order and see its additional characteristics before opening. TP and SL
FREE
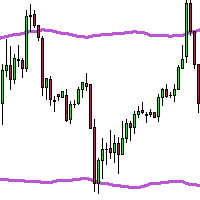
TMA & ATR Adjusted Indicator The TMA & ATR Adjusted indicator for MetaTrader 5 is a powerful tool that combines the Triangular Moving Average (TMA) with the Average True Range (ATR) to provide dynamic market insights. This advanced indicator adapts to market volatility and offers a clear visualization of trends with customizable upper and lower bands. Key Features: Triangular Moving Average (TMA): A smooth moving average that gives more weight to central data points, providing a refined trend an
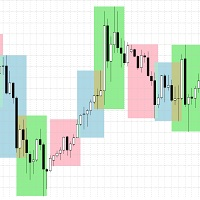
Session Boxes - Advanced Market Sessions Visualization Indicator
Overview The Session Boxes indicator is a powerful and highly customizable tool designed to help traders visualize major trading sessions directly on their charts. By clearly displaying the Asian, London, New York, Sydney, and Frankfurt sessions, traders can easily identify optimal trading times and potential market volatility periods.
Key Features
Multiple Session Support - Asian Session (Default: 00:00-09:00) - London Session

SuperTrend , RSI , Stochastic 의 힘을 하나의 포괄적인 지표로 결합하여 트레이딩 잠재력을 극대화하는 궁극의 트레이딩 도구 인 Quantum TrendPulse를 소개합니다. 정밀성과 효율성을 추구하는 트레이더를 위해 설계된 이 지표는 시장 추세, 모멘텀 변화, 최적의 진입 및 종료 지점을 자신 있게 식별하는 데 도움이 됩니다. 주요 특징: SuperTrend 통합: 주요 시장 추세를 쉽게 따라가고 수익성의 물결을 타세요. RSI 정밀도: 매수 과다 및 매도 과다 수준을 감지하여 시장 반전 시점을 파악하는 데 적합하며 SuperTrend 필터로 사용 가능 확률적 정확도: 변동성이 큰 시장에서 숨겨진 기회를 찾기 위해 확률적 진동 을 활용하고 SuperTrend의 필터로 사용 다중 시간대 분석: M5부터 H1 또는 H4까지 다양한 시간대에 걸쳐 시장을 최신 상태로 유지하세요. 맞춤형 알림: 맞춤형 거래 조건이 충족되면
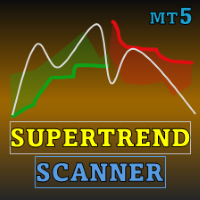
Special offer : ALL TOOLS , just $35 each! New tools will be $30 for the first week or the first 3 purchases ! Trading Tools Channel on MQL5 : Join my MQL5 channel to update the latest news from me SuperTrend ATR Multiplier with Scanner for MT5 를 소개합니다 – 시장 트렌드를 앞서기 위해 설계된 다기능 강력한 도구로, 사용자 맞춤형 기능과 실시간 알림을 제공합니다. Kivanc Ozbilgic 의 신뢰할 수 있는 SuperTrend 로직을 기반으로 한 이 지표는 정확한 트렌드 신호를 제공합니다. ATR 계산 방법을 RMA (상대 이동 평균)와 SMA (단순 이동 평균) 중에서 선택하여 최대한의 유연성을 제공할 수 있습니다. 기본 설정으로 ATR 기간은 10, 배수는 3
FREE
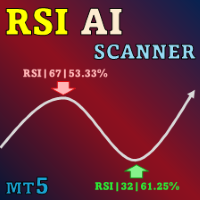
Special offer : ALL TOOLS , just $35 each! New tools will be $30 for the first week or the first 3 purchases ! Trading Tools Channel on MQL5 : Join my MQL5 channel to update the latest news from me MT5용 혁신적인 RSI Kernel Optimized with Scanner를 소개합니다. 이 최첨단 도구는 강력한 커널 밀도 추정(KDE) 알고리즘을 통합하여 전통적인 RSI 분석을 재정의합니다. 이 고급 지표는 실시간으로 시장 트렌드에 대한 인사이트를 제공할 뿐만 아니라, 여러 통화쌍과 시간 프레임을 동시에 스캔할 수 있는 대시보드를 포함하고 있습니다. 이 도구가 당신의 거래 도구 상자에 필수적인 이유를 살펴보겠습니다. See more MT4 version at: RSI Kernel Optimized M

MT5 CCI 대시보드 스캐너 MT5 CCI 대시보드 스캐너는 다양한 시간대와 금융 상품에서 상품 채널 지수(CCI) 수준을 추적하는 데 도움을 주며 새로운 신호가 감지될 때 실시간 경고를 제공하는 도구입니다. 사용하기 쉽고 컴퓨터의 계산 자원을 적게 사용하여 모든 컴퓨터에서 원활한 성능을 보장합니다. 주요 기능 자동 기구 그룹화 : 스캐너는 시장 관찰 목록의 모든 기구를 수집하고 이를 카테고리(메이저, 마이너, 엑조틱, 기타)로 정리합니다. 설정에서 간단한 체크박스 인터페이스를 사용하여 스캔할 기구를 쉽게 선택할 수 있습니다. 사용자 지정 가능한 시간대 선택 : 스캔을 위해 21개의 서로 다른 시간대 중에서 선택할 수 있습니다. 선택한 모든 시간대는 대시보드에 표시되며, 각 시간대에 대해 새로운 신호 알림이 전송됩니다. 쉬운 CCI 설정 : 기간 및 적용 가격을 포함한 CCI 설정을 조정하고 매수/매도 수준을 설정할 수 있습니다. 현재 캔들이나 가장 최근에 닫힌 캔들에 따라 스캔할
FREE
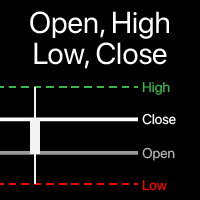
차트에서 시가, 고가, 저가, 종가 수준의 시각화 현재 것뿐만 아니라 모든 시간 프레임을 선택할 수 있습니다. 계산된 바의 오프셋은 조정 가능합니다 : 현재 (변동) 바, 또는 설정된 수의 이전 바. 다기능 유틸리티 : 66개 이상의 기능 포함 | 문의 사항이 있으면 연락주세요 | MT4 버전 지표 설정에서 다음을 구성할 수 있습니다: 계산된 바의 오프셋 : 0 = 현재 바, 1 = 이전 바, 2 = 2 바 전... " 여러 바 포함 " 옵션:
만약 > 0: 여러 바가 결합되어 최고가 와 최저가 를 결정합니다. 계산된 시간 프레임 . 각 수준(OHLC)은 개별적으로 활성화/비활성화 될 수 있습니다. 선 시각화 : 색상, 스타일, 크기, 배경 옵션. 추가 정보: 비활성화 가능; 선 가격만; 선 정보만; 둘 다: 정보 + 가격; 글꼴 크기 및 스타일 ('추가 정보'가 활성화된 경우). 프로그램 파일은 " Indicators " 디렉토리에 위치해야 합니다.

Suitable for the EurTrendSniper trend indicator. Please download and place it in the Indicators folder of MT5.
A key element in trading is identifying the areas or levels where decisions are made to buy or sell financial instruments. Although major participants attempt to hide their presence in the market, they inevitably leave traces. Our task is to learn how to identify these traces and interpret them correctly. Bullish Signal:
The price (candlestick) is above the band-colored block, the ban
FREE

The Accumulation/Distribution (AD) Technical Indicator is a tool used in technical analysis to determine whether an asset is being accumulated (bought) or distributed (sold) in the market. Key Characteristics of the AD Indicator: Purpose: The AD indicator is used to assess the balance between buying (accumulation) and selling (distribution) of an asset. This helps traders and investors evaluate the strength of the current trend and potential reversals. Interpretation: Rising Indicator: Whe

The Accelerator Oscillator (AC) technical indicator measures the acceleration or deceleration of the current market strength. It is designed to identify potential trend reversal points and is used to determine the moment of buying or selling assets. The indicator helps traders make decisions based on changes in market dynamics. This implementation of the indicator is its creative version. Since the standard version is very limited by its built-in settings, this implementation has significantly

The AO (Accumulation/Distribution) technical indicator is a successful indicator for measuring market dynamics, which reflects specific changes in the market's driving force, which helps determine the strength of a trend, including its formation and reversal points. The AO indicator is a technical analysis tool that will help you trade more effectively. Main characteristics of the AO indicator: Purpose: The AO indicator is used to assess the balance between purchases (accumulation) and sales (di
This indicator is the mql5 version of the SSLHybrid indicator. MT4 Version Find out more here: https://www.mql5.com/en/users/rashedsamir/seller
Description of TradingView version: This script is designed for the NNFX Method, so it is recommended for Daily charts only.
Tried to implement a few VP NNFX Rules
This script has a SSL / Baseline (you can choose between the SSL or MA), a secondary SSL for continiuation trades and a third SSL for exit trades.
Alerts added for Baseline entries, SSL
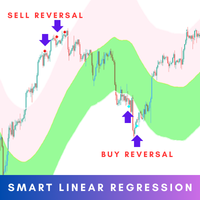
The Smart Linear Regression indicator is a powerful, non-repainting tool designed for traders looking for enhanced accuracy in market analysis. Unlike the typical linear regression channels that often repaint, this indicator provides reliable insights without changing past values, making it more trustworthy for forecasting future price movements. MT4 Version - https://www.mql5.com/en/market/product/124893/ Overview: The Smart Linear Regression Indicator goes beyond the basic linear regr
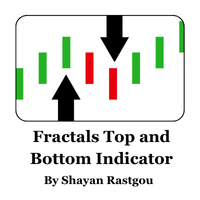
Discover the power of fractals to uncover significant market reversals! This custom Fractals Indicator for MetaTrader 5 is designed to help traders quickly and effectively spot potential swing highs and lows, providing visual cues that make trading decisions easier. Key Features: Clear Buy & Sell Signals: Green and red arrows highlight bullish and bearish fractals, helping you effortlessly identify significant price pivots. Customizable Analysis Depth: Choose the number of bars to evaluate for f
FREE

Antabod Genius Indicator—an advanced trading tool designed to give you accurate buy and sell signals directly on your MetaTrader 5 platform. Harnessing the combined power of Moving Averages (MA) and the Stochastic Oscillator, this indicator helps you identify optimal entry and exit points with ease. Key Features: • Precision with Dual Moving Averages: The Genius Indicator uses a fast and slow MA to detect key market momentum shifts. Crossovers between the MAs serve as reliable indicators for pot

Antabod Multiplier , the ultimate trading indicator designed to simplify your decision-making process and maximize your trading potential. Built with a robust combination of moving averages and stochastic oscillators, this tool provides clear, actionable signals for both buy and sell opportunities. The Antabod Multiplier stands out with its dynamic trend detection and precision filtering, giving you real-time visual signals to catch trend reversals and optimal entry/exit points with ease. Whethe
A Renko Tick chart based on continuously adjusting percentage.
Live Renko bricks formed by tick data
Adjustable brick width expert for indicator attached Scalp with a Renko, get weird.
The settings can and will break the script if you turn them up too high. Turning off outline mode will not look as nice, but can potentially allow for a larger number of bricks.
FREE

This is a very simple multiple moving average indicator.
It can display 12 moving averages. The time axis of the moving averages can be changed in the input field of the indicator. The process is faster than the 12 moving averages included with MT5.
We also have a buffer set up so you can access it from an Expert Advisor. *For advanced users.
If you have any questions or requests, please message me.
Thank you.
MT4 Version: https://www.mql5.com/en/market/product/122857
FREE

Tyr Bands Indicator (IC MARKETS GOLD). Just drag and drop. This indicators gets you entry points for the market. it is for gold, but you can configure for any other currency. Tyr Band works with BB and 3 different deviations, plus the Stochastic confirmation. So when the price closes below/above the BB Reversal Band (Red) and the Stochcastic is in the confirmation zone, then the arrow (buy/sell) appears. This arrow indicates that we can entry to the market up/down on the next opening. Since it i
FREE
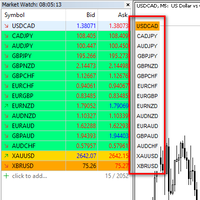
I want to quickly view the chart, so I created a small tool. I hope it can help you. Functions:
Use up/down arrow keys or mouse clicks to quickly open charts for currency pairs. Use left/right arrow keys to change the timeframe of the current chart. Automatically update the order based on the Market Watch
If you have any request or errors please tell me to help it better.
Donate us , Thank u!
Telegram: 0388894014
FREE

Automatic Fibonacci Levels Indicator The Automatic Fibonacci Levels Indicator is an essential tool for traders seeking to incorporate Fibonacci retracement and extension levels into their technical analysis seamlessly. This innovative indicator automatically identifies significant price movements and calculates key Fibonacci levels, providing traders with valuable insights into potential support and resistance areas. Key features: Automatic Calculation : Effortlessly plots Fibonacci levels base

Automatic Trendline Indicator The Automatic Trendline Indicator is a powerful tool designed to simplify technical analysis by automatically identifying and drawing trendlines on a price chart. It analyzes price movements to detect key support and resistance levels, plotting ascending and descending trendlines based on historical price action. This indicator helps traders identify market trends, potential breakout points, and reversal areas with minimal effort. Key features: Automatic Detection
MT5 Drawdown Tracker – Track Your EA’s Performance with Precision! Take your trading analysis to the next level with our MT5 indicator designed to monitor, record, and report the drawdown of any Expert Advisor. Whether you’re fine-tuning your strategies or optimizing risk management, this tool gives you the insights you need. Key Features: Effortless Tracking: Automatically monitors the drawdown levels of your EAs with precision. Comprehensive Data Storage: Accurately logs each drawdown event,

Special Fair Value Gap (SFVG) Indicator
Unlock your trading potential with the Special Fair Value Gap (SFVG) Indicator! This innovative tool identifies critical price imbalances in the market, helping you pinpoint potential buying and selling opportunities with precision.
Key Features: - Multi Timeframe - Smart Money Tool - Identifies Key Price Levels: Automatically detects STRONG HIGH PROBABILITY gaps in price action where retracements are likely to occur, allowing you to make informed tra

The "Profit and Fee" indicator was developed in MQL5 to help traders clearly visualize the fees involved in operations on the stock exchange (B3). It calculates and displays, in real time, the fees for emoluments and registration, allowing traders to understand the impact of these fees on their profit or loss.
Advantages and Features:
1. Financial Transparency: The indicator shows exactly how much you are paying in fees, providing a clear view of the real value of your operations. This helps

The Area of Interest (AOI) Indicator is a powerful tool designed to help traders identify key market zones where price reactions are highly probable. This indicator specifically highlights two critical zones: Seller AOI (Area of Interest) : This zone represents areas where sellers are likely to enter the market, often acting as resistance. When the price approaches or touches this zone, it signals that a potential sell-off could occur. Buyer A OI (Area of Interest) : The BOI zone identifie
FREE

Viking Strategy Indicator – The Beating Heart of the BT 3.0 System The Viking Strategy Indicator is not just another indicator…
It’s one of the pillars of the revolutionary BT 3.0 trading system , built to transform the trading experience for everyone — from beginners to experts . BT 3.0 is much more than a tool:
It’s a complete trading solution , both semi-automated and fully automated , integrating 6 powerful indicators and a smart assistant that analyzes, detects, alerts, and executes b
그만큼 FVG 존 인디케이터 MT5 시장에서 공정가치 갭(FVG)을 식별하도록 설계된 강력한 도구로, 공정가치와 시장 가격 간의 가격 불균형을 강조합니다. 이러한 갭의 정확한 식별을 통해 트레이더는 잠재적인 시장 진입 및 종료 지점을 파악하여 정보에 입각한 거래 결정을 내리는 능력을 크게 향상시킵니다. 직관적이고 사용자 친화적인 인터페이스를 갖춘 FVG Zone Indicator는 공정 가치 갭에 대한 차트를 자동으로 스캔하여 가격 차트에 이러한 구역을 실시간으로 표시합니다. 이를 통해 트레이더는 다가올 가격 수정 또는 추세 지속을 나타낼 수 있는 잠재적인 가격 불균형을 빠르고 쉽게 인식할 수 있습니다. 주요 특징은 다음과 같습니다. 실시간 갭 감지: FVG가 나타나면 자동으로 식별하여 표시합니다. Pips 단위로 갭 크기 표시: 이 지표는 식별된 각 갭의 크기를 핍 단위로 표시하여 트레이더가 갭의 중요성을 이해하는 데 도움이 됩니다. 현재

그만큼 지원 저항 속삭임 MT5 시장에서 중요한 지지선과 저항선을 트레이더가 식별하도록 돕기 위해 설계된 강력한 도구입니다. 이 지표는 가격 움직임을 사용하여 차트에 빨간색 저항선과 녹색 지지선을 동적으로 그려 잠재적인 시장 반전이나 돌파가 발생할 수 있는 주요 가격 구역을 명확하고 시각적으로 표현합니다. 프랙탈에 의존하는 기존 방법과 달리 이 지표는 사용자 지정 가능한 룩백 기간 동안 최고가와 최저가를 기반으로 지지선과 저항선을 계산하여 지연을 피합니다. 주요 특징: 룩백 기간: 특정 수의 캔들에 대한 가격 데이터를 분석하기 위해 지표를 사용자 정의합니다. 룩백기간 매개변수. 이를 통해 트레이더는 지지 및 저항 수준의 민감도를 미세 조정할 수 있습니다. 과거 데이터 분석: 표시기는 최대 500개의 과거 막대를 스캔할 수 있습니다(조정 가능) 역사 시장 가격 변동에 대한 포괄적인 분석을 보장하기 위

YOU CAN NOW DOWNLOAD FREE VERSIONS OF OUR PAID INDICATORS . IT'S OUR WAY OF GIVING BACK TO THE COMMUNITY ! >>> GO HERE TO DOWNLOAD
This system is an Heiken Ashi system based on RSI calculations . The system is a free open source script originally published on TradingView by JayRogers . We have taken the liberty of converting the pine script to Mq4 indicator . We have also added a new feature which enables to filter signals and reduces noise on the arrow signals.
Background
HEIKEN ASHI
Th
FREE

The Neuro Trend Indicator leverages modern technology to provide early signals of trend reversals in the markets. Through precise color coding, the indicator displays the current trend direction: Green signals rising prices (bullish trend), while Red indicates falling prices (bearish trend). The further the indicator moves from the zero point, the stronger the trend. Values above zero indicate a strong upward trend, while values below zero point to a clear downward trend. With two customizable p

Advanced Dynamic RSI The **Advanced Dynamic RSI** indicator builds on the classic Relative Strength Index (RSI) developed by J. Welles Wilder. It incorporates volatility-adaptive overbought and oversold levels using moving averages and standard deviation calculations. This adaptation helps the levels adjust to current market conditions, offering a more responsive oscillator compared to fixed thresholds. The indicator is suitable for various instruments and timeframes, supporting analysis in diff
FREE

MT5 Enveloping Pattern Detector: Your competitive advantage in trading Are you looking for a tool to help you accurately identify the best trading opportunities in the forex market? Our Engulfing Pattern Detector provides you with a highly reliable buy or sell signal, based on one of the most recognized and effective Japanese candlestick patterns: the engulfing pattern. With an average success rate of 70%, this indicator will allow you to make safer and more profitable investment decisions. Don'
FREE

MT5 Hammer Pattern Detector: Your guide to more profitable operations
Tired of searching for the best trading opportunities? Our innovative indicator gives you a competitive advantage by automatically identifying hammer patterns on your charts. Known for its high probability of success, the hammer pattern has been a fundamental tool in the arsenal of experienced traders for decades. Our indicator, designed to accurately detect this key pattern, will allow you to:
Identify trend reversals earl
FREE
This indicator is the mql version of the Linear Regression Candles indicator. There are many linear regression indicators out there, most of them draw lines or channels, but this one actually draws a chart.This script includes features such as linear regression for open, high, low, and close prices, signal smoothing with simple or exponential moving averages. Find out more here: https://www.mql5.com/en/users/rashedsamir/seller I welcome your suggestion for improving the indicator
To incre
FREE

Support Resistance Indicator The "Support Resistance" indicator is a versatile tool designed to help traders identify key support and resistance levels based on an underlying algorithm. These levels indicate price points where an asset historically experiences buying (support) or selling (resistance) pressure. The indicator allows traders to visualize these levels on their charts, making it easier to make informed decisions. All Products | Contact PARAMETERS: Timeframe :
Users can select the
FREE
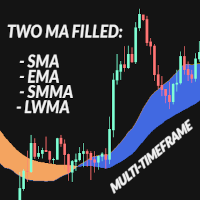
The Two MA Filled is a two moving averages indicator designed for traders seeking a more sophisticated and visual technical analysis. This indicator combines two customizable moving averages with a filling visual between them, allowing you to quickly visualize market trends and identify entry and exit opportunities. Key Features: Customizable Moving Averages: Set the periods and types of moving averages (SMA, EMA, SMMA, LWMA) for the fast and slow averages, tailoring the indicator to your tradin

Attention all Boom and Crash traders! Elevate your market monitoring with the cutting-edge RSI indicator, Market Watch . - Customize alert settings for periods, volatility thresholds, and price spikes - Receive voice notifications when your targets are hit - Seamless integration with MetaTrader5 for real-time data
The indicator works on all five Boom and Crash Markets!
Default settings: Number of timeframes: Timeframe 1 - True Timeframe 2 - True Timeframe 3 - True Timeframe 4 - True Timeframe
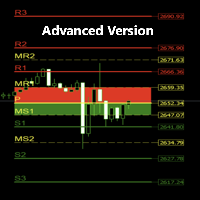
Detailed Description: The Pivot Points Buy Zone Advanced Indicator takes the concept of pivot points to a whole new level, providing traders with enhanced functionality, customizations, and in-depth visualizations. Unlike the free basic version, this advanced indicator allows users to customize more settings, analyze current and historical pivot points, enable potential buy (green) and sell (red) set-ups on the chart, use alerts and pop-up messages, ... etc. Extra Key Advanced Features: Fully C

This indicator is based on the strategy shared by TheMas7er on his youtube channel.
The IDR/DR range will help you identify the high and low of the day once a candle closes above or below the the DR levels.
The IDR/DR range is determined 1 hour after session open, 09:30 am est.
I have incorporated the fibonacci tool to help you mark the retracement for a good entry in the premium or discount zone.
Important
This indicator is designed for the indices and M5 timeframe, but you
Daily Drawdown Indicator for MT5
Unlock your trading potential with our Daily Drawdown Indicator! This powerful tool provides real-time monitoring of daily drawdown levels, allowing traders to stay informed and make smarter decisions. Easily track your performance and manage risk by visualizing drawdown in a clear, user-friendly interface. Whether you're a beginner or an experienced trader, this indicator is essential for maintaining discipline and optimizing your trading strategy. Elevate you

About indicator > The indicator is a function based on one value (open/high prices up to now) and then it is a mathematical representation of the whole function that is totally independent from any else values. So, if you ask yourself will the future be as it is on the graph... I can tell you - as it was the same as the trading function up to the moment "now"... In conclusion, the point of the indicator is to try to show the future of the trading function into eternity.
The graphic is sometime

The Supply and Demand Zone Indicator is a powerful and easy-to-use tool designed to help traders identify critical supply and demand zones on the chart. These zones can provide valuable insight into potential market reversals, breakouts, and important price levels where buyers or sellers are likely to take control. The best FREE Trade Manager . If you want to create your own Hedging or Grid strategies without any coding make sure to check out the ManHedger Key Features: Automatic Zone Detect
FREE
MetaTrader 마켓은 MetaTrader 플랫폼용 애플리케이션을 구입할 수 있는 편리하고 안전한 환경을 제공합니다. Strategy Tester의 테스트를 위해 터미널에서 Expert Advisor 및 인디케이터의 무료 데모 버전을 다운로드하십시오.
MQL5.community 결제 시스템을 이용해 성능을 모니터링하고 원하는 제품에 대해 결제할 수 있도록 다양한 모드로 애플리케이션을 테스트할 수 있습니다.
트레이딩 기회를 놓치고 있어요:
- 무료 트레이딩 앱
- 복사용 8,000 이상의 시그널
- 금융 시장 개척을 위한 경제 뉴스
등록
로그인
계정이 없으시면, 가입하십시오
MQL5.com 웹사이트에 로그인을 하기 위해 쿠키를 허용하십시오.
브라우저에서 필요한 설정을 활성화하시지 않으면, 로그인할 수 없습니다.