 MetaTrader 5
 Experts
 지표
지표
 라이브러리
라이브러리
 유틸리티
유틸리티
 위젯
위젯
 규칙
규칙
MetaTrader 5용 새 기술 지표 - 199
 기술 지표의 시그널은 주식 및 외환 시장에서 거래를 개시 및 종료하는 데 중요한 역할을 합니다. 지표의 본질은 미래의 가격 변화를 예측하기 위한 금융 시그널 값의 수학적 변형입니다.
기술 지표를 테스트하여 시장 행동과 그로 인한 이익을 더 잘 예측할 수 있습니다.
기술 지표의 시그널은 주식 및 외환 시장에서 거래를 개시 및 종료하는 데 중요한 역할을 합니다. 지표의 본질은 미래의 가격 변화를 예측하기 위한 금융 시그널 값의 수학적 변형입니다.
기술 지표를 테스트하여 시장 행동과 그로 인한 이익을 더 잘 예측할 수 있습니다. 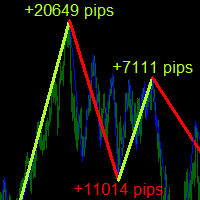
Description
ABC Trend Detector Pro is an indicator that identifies impulses and trends in the market and displays their presence on the price chart. Found patterns are drawn as colored connecting lines between their highs and lows. Above / below each extreme, the value of the range (the number of pips) of the trend is displayed.
Recommendations
You can use this indicator to determine the trend and, accordingly, to determine the direction of opening a position or closing an opposite position

Display the date, time and price according to the movement of the mouse cursor on the chart This is useful for discretionary trading.
It is an indispensable tool for verifying and studying past market prices and trades. Characteristic Date,Time and Price are displayed.
The value follows the movement of the mouse.
You can change the color of the text. Please refer to the video on youtube. For MT5 only.
FREE

Price activity indicator showing the trend zone - flat, not redrawing previous values. The indicator is very sensitive to current price activity and displays signals quite well. The state of the market, the phase of its movement largely determines the success of the trader and his chosen strategy. The color version of the indicator signals a trend change. The indicator allows you to see a rising or falling trend. In addition to the trend direction, the indicator shows a change in the angle of in

Despite the apparent simplicity of the indicator, inside it has complex analytical algorithms with which the system determines the moments of inputs. The indicator gives accurate and timely signals to enter and exit the transaction that appear on the current candle.
The main purpose of this indicator is to determine the moments of entry and exit from transactions, therefore, the Trend Revers indicator will display only the trend line and entry points, that is, displays the entry points to the
At its most basic, the "Average Directional Movement Index Wilder" (ADXW) can be used to determine if a security/index/currencie is trending or not. This determination helps traders choose between a trend-following system or a non-trend-following system. Wilder suggests that a strong trend is present when ADXW is above 25 and no trend is present when ADXW is below 20. There appears to be a gray zone between 20 and 25. ADXW also has a fair amount of lag because of all the smoothing techniques. Ma
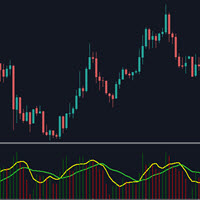
This indicator will show the the change of volumes via 2 lines of SMA: . Fast line (default is 5 candles) . Slow line (default is 13 candles) We can use the crossing point of fast line and slow line to know investors are interesting in current price or not. Pay attention: The crossing point is not signal for entry. Absolutely that we must use in combination with other indicators for sure. Parameters: . Fast line periods: the periods (candles) to calculate SMA of fast line . Slow line periods: th
FREE
Media Móvel Grátis para uso em conjunto ao Diamond Indicator Atenção. Essa é a mm para conjugar ao indicador. Esse não é o indicador. Comprem o indicador que está tendo ótimos resultados. A seguir informações sobre o indicador: Indicador Para Opções Binarias. Usa dois gales. Instalar em mt5 Esse indicador é para ser usado no tempo de vela de 5 minutos e em M5. Este também funciona em M1, porém é mais eficiente em M5. Só descompactar e copiar os arquivos na pasta de dados do seu MT5. Arquivos
FREE
Только что открыли позицию, а цена резко пошла в другую сторону..Что делать? Просто потерпеть, усредниться или отстопиться (закрыться) и снова войти в сделку, но уже в противоположную сторону? Как поступить...а может просто снимать сливки и торговать по разворотным импульсам ….в этом Вам поможет и подскажет Индикатор тенденций и разворотов на базе коллекции паттернов советника ReversMartinTral https://www.mql5.com/ru/market/product/28761
который кроме рекомендаций и сигналов реверса включа

******** 5 INDICATORS IN 1 *********** In statistics, the Zscore tells us the number of standard deviations by which the value of a raw score is above or below the mean value of what is being observed or measured. In trading the Zscore tells us the number of standard deviations by which the value of price is above or below a moving average of choice. For example a Zscore of 1.5 in a period of 20 tells us the closing price is currently 1.5 x standard deviations above the 20 period Moving Average

FibTracer is an interactive Fibonacci tool that is aim to improve and facilitate your Fibonacci trading style. This Indicator can generate Fibonacci Retracement levels in two different ways. You can select whether to draw Fibonacci Retracement levels based on you favourite ZigZag settings or you can let the indicator to draw Fibonacci Retracement level based on given number of periods. You can also set Mobile and Email notification for your favourite Retracement levels individually. With this i

This Indicator draws Fibonacci Extension levels in two different ways. You can select whether to draw Fibonacci Extension levels based on your favourite ZigZag settings or you can let the indicator to draw Fibonacci Extension level based on given number of Bars or Candles. You can also set Mobile and Email notification for your favourite Extension levels individually. With this indicator you will not have to feel lonely as the it can generate Voice alerts, which will keep you focused on your

Indicador Para Opções Binarias. Indicator for Binary Options Usa dois gales. Instalar em mt5 Esse indicador é para ser usado no tempo de vela de 5 minutos e em M5. Este também funciona em M1, porém é mais eficiente em M5. Só descompactar e copiar os arquivos na pasta de dados do seu MT5. Arquivos indicator na pasta MQL5 - Indicator. Baixe também a Media Movel totalmente gratis:
https://www.mql5.com/pt/market/product/50400
Esse Indicador é para a próxima vela. Apareceu a seta, só aguardar a próx
The Raschke Oscillator (LBR-RSI) indicator is the famous oscillator described in the book " Street Smarts: High Probability Short-term Trading Strategies " This indicator is perfect for a variety of researchs and it can be suitable to be used in combination with your own strategy just for trend trading or range-bound trading. The personal preference is to use it when the trend is not too strong, for example you can combine it with ADX to measure the strength of the trend and use it when ADX is b
***Please Give Some Feedback and Reviews*** This is an indicator which shows the direction and the strength of the selected Symbol based on the two outputs, Signal and Value. The Signal indicates the directions as Buy equals 2(Blue) and Sell equals 1(Red). The Value output indicates the strength of the signal between -100 to 100. This indicator is both trend and fast preliminary indicator by choosing appropriate parameters. Indicator uses the Normalized ADX value as the hitting catalyst, which

BlueDigitsFx 공식 생태계 액세스 인프라 업데이트, 트레이딩 리소스, 제품 출시 정보 및 BlueDigitsFx 공식 생태계에 대한 액세스를 받아보세요. Telegram 생태계
웹사이트
MT4 버전 BlueDigitsFx Easy 123 System MT5 — MT5용 강력한 반전 및 돌파 감지 시스템 시장 반전과 돌파를 포착하기 위한 올인원 비재도색(Non-Repaint) 시스템 — 구조적 분석, 명확성 및 확인 기반 트레이딩을 중요하게 생각하는 트레이더를 위해 설계되었습니다. BlueDigitsFx Easy 123 System은 시장 구조 변화, 돌파 및 추세 반전을 쉽고 명확하게 식별할 수 있도록 도와주는 MT5용 시각적 지표 및 알림 시스템입니다. 이 지표는 구조화된 "123" 패턴을 기반으로 작동합니다. 1단계 : 잠재적인 추세 소진 구간에서 큰 화살표(Big Arrow)를 표시하여 새로운 고점 또는 저점을 식별합니다. 2단계 : 시장 구조 돌파를 감지하여 잠

The ALPHA TRADER Indicator For MT5 is an indicator that leverages the effectiveness of the Average Directional Movement Index and ATR indicator, which is able to provide solid insights into the market trend and the respective oversold and overbought zones that give life to reversal signals, therefore, it is an incredibly reliable resource used to formulate an indicator capable of visually providing investors with reversal signals - because, ultimately, what this indicator does is that it accurat
BW Dance - Bill Williams Trading Chaos Signal MTF Indicator for MetaTrader 5
!!! This indicator is not a trading system !!!
This is only a convenient tool for receiving signals of the Bill Williams trading system in visual and sound mode - Signals are not redrawn/ not repainting
The main idea of the indicator:
display current signals of the BW system on the right edge of the chart, according to the principle HERE and NOW output signals in three ways:
next to the price scale under / abo
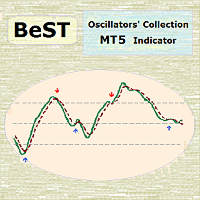
BeST_Oscillators Collection is a Composite MT5 Indicato r including the Chaikin , Chande and TRIX Oscillators from which by default Chaikin and TRIX Oscillators but not Chande Momentum Oscillator are contained in MT5 platform. It also provides for each Oscillator the option of displaying or not a Mov. Average as a Signal Line and the resulting Signals as Arrows in a Normal (all arrows) or in a Reverse Mode (without showing up any resulting successive and of same type arrows).
Analytically fo
FREE

Super Zone For several years of observing the principles of the market, Super Zone worked, both then and now, because the indicator allows you to see the trading range of the week and even the month that major market participants use. It’s very easy to use, we work on H4 in the weekly range ( in the tester it doesn’t work in the demo mode ) - we sell from the upper zones, we buy from the lower ones. It marks the zones from the beginning of the week (month) that are not redrawn , works on
Бинарный индикатор находит свечной паттерн "Поглощение" и рисует соответствующий сигнал для входа рынок. Имеет встроенные фильтры и панель для просчета количества успешных сделок. Демо версия является ознакомительной, в ней нет возможности изменять параметры. Полная версия . Особенности Работает для всех валютных пар и любых таймфреймов. Индикатор рассматривает комбинацию из 2-х или 3-х свечей в зависимости от настроек. Имеется возможность фильтровать сигналы путем настройки количества свече
FREE
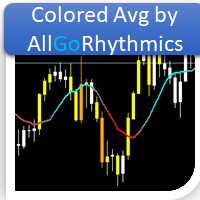
Média Móvel que possui todos tipos de Cálculo comum: Simples Exponencial Suavizada Ponderada Conta com suporte para aplicação sob outros indicadores!
Seu principal diferencial é o esquema de cores em GRADIENTE que, de acordo com a mudança no ângulo da média, altera suas cores conforme demonstrado nas imagens abaixo. Com isso, espera-se que o usuário tenha uma percepção mais suavizada das pequenas alterações.
Bons trades!!
FREE
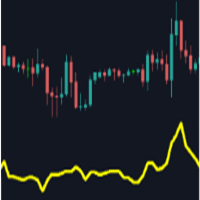
Main purpose: This indicator calculates the average of previous candles (a half of candle points). This value represent the strength of market (buy/sell) in each candle.
Parameters: . Period: indicating previous candles to calculate average . Shift: draw line at a shift on chart.
Tip: We can use this value to consider TP and SL of a position before opening.
FREE
Это специальная утилита, для подключения внешнего индикатора к торговой панели . Она позволяет получать данные из буфера индикатора и рисует стрелочные объекты для передачи их в торговую панель. Входные параметры
Number of call buffer - номер индикатора для покупки Number of sell buffer -номер индикатора для продажи Indicator window - окно индикатора Indicator position in list - позиция индикатора в списке Default value of indicator - значения по умолчанию для индикатора Show information - показ
FREE

Stochastic Reversal allows you to recognize reversals professionally. Stochastic Indicator: This technical indicator was developed by George Lane more than 50 years ago. The reason why this indicator survived for so many years is because it continues to show consistent signals even in these current times. The Stochastic indicator is a momentum indicator that shows you how strong or weak the current trend is. It helps you identify overbought and oversold market conditions within a trend. Rules

Hurst Fractal Index Фрактальный Индекс Херста - показатель персистентности временного ряда При значении индикатора >0.5 временной ряд считается персистентным (тенденция сохраняется) При значениях индикатора явно < 0.5 временной ряд считается антиперсистентным (возможна смена направления движения) Для наглядности значения индекса усредняются периодом 2-3. Настройки индикатора: Max Bars - глубина истории расчета (кол-во баров на графике для которых произведён расчет) Data from Timeframe - исполь

Yasha Firooz에 대한 정보
Yasha는 2012년에 자산 관리 회사의 직원이었습니다. 그는 다양한 사무 및 기술 업무를 위임받았으며, 일부 자산 관리 팀과 설립자의 요구 사항을 연결할 수 있었습니다. 자산 관리 회사는 거래 산업에 많은 투자를 했습니다.
FX Fishing MT4(Meta Trader 4 지표)에 대한 정보
Yasha는 시장 변동성에 대해 걱정했고, 황소와 곰 사이의 시장 파동을 느낄 수 있는지 고민했습니다. 따라서 그렇게 할 수 있는 지표를 전략화했습니다. 모든 상승 핍은 계산되고 모든 하락 핍은 계산됩니다. 이 두 개의 틱은 아래에 표시된 지표 이미지와 같이 표시됩니다.
- 녹색 숫자(상승 틱/핍)
- 주황색 숫자(하락 틱/핍)
중앙 아래에 표시된 숫자는 상승 및 하락 변동성의 차이입니다. 강한 황소 또는 곰 볼륨을 나타냅니다.
낚시 지표는 1:2 비율로 작동하며, 오른쪽의 색상 점에 표시됩니다. 녹색 = 황소 빨간색 = 곰 주황색 = 측면

**Resistances and Support — 강도 평가와 알림이 있는 지지/저항 존**
지지와 저항은 진입 시 가장 중요한 요소 중 하나입니다. 이 지표는 이를 자동으로 찾아 각 존의 강도를 보여줍니다.
단순한 선이 아니라 지지와 저항을 ‘존(영역)’으로 그립니다. 가격은 정확한 가격이 아니라 영역에 반응하기 때문입니다. 각 존은 가격이 몇 번 존중했는지로 평가되며, 강한 존일수록 굵게 그려집니다. 어떤 레벨이 가장 중요한지 즉시 알 수 있습니다.
**사용법:** - 지지 존과 저항 존 사이에서 거래하세요 - 손절은 존 바깥에 둡니다(매도는 위, 매수는 아래) - 익절은 다음 존에 설정합니다 - 여러 존이 간격 없이 몰려 있으면 기다리는 편이 좋습니다 — 혼잡한 구간입니다
**기능:** - 최근 스윙에서 여러 지지/저항 존을 자동 감지 - 각 존을 강도(터치 횟수)로 평가 — 강할수록 굵게 - 저항은 가격 위, 지지는 아래에 각자 색으로 표시 - 각 존에 유형과 강도를

The WT Vwap Bands indicator is an indicator that combines price and volume, helping to show whether the price is within the "fair price", overbought or oversold.
The indicator code was designed for performance and has already been tested in a real trading account.
In addition to the visual inputs (color, thickness and line style), the user can define a% value that depends on the price.
The default values work with the most distant band at 1% of the price and then dividing this distance in
Some candles have a strong tendency to continue the movement, or its turn. Using the Colored candles and patterns indicator, such candles are clearly visible. This indicator calculates the parameters of each candle, as well as its volume, and after that it colors the candles depending on its strength and direction. Bullish candles turn green and bearish candles turn red. The greater the strength of the bulls or bears, the brighter the color. If desired, the colors can be changed. In addition, t
Trend indicator, draws 2 bars of different colors on the chart. A change of one lane to another signals a market reversal in the opposite direction. The indicator also places on the chart 3 parallel dashed lines High, Middle, Low line which show respectively the top, middle, bottom of the forming reversal.
Parameters
Depth - Depth of indicator calculation, the higher the parameter, the longer-term signals; Deviation - Deviation of the indicator during drawing; Backstep - The intensity of the d
Elite SR - Advanced Level Indicator for automatic detection of support and resistance levels with different degree of credibility should become a part of your trading arsenal. This indicator is accessible via iCustom function and provides level values as well as their degree of credibility. Elite SR is fully adjustable and can work on any time-frame with any trading instrument!
Important information For all detailed information about this indicator you can visit 747Developments website.
Featur

VolumeFlow is a Volume Accumulation / Distribution tracking indicator. It works in a similar way to OBV, but it is much more refined and includes the options to use: Classical Approach = OBV; Useful Volume Approach; Gail Mercer's approach; Input Parameters: Input Parameters: Approach Type: Explained above; Volume Type: Real or Ticks; Recommendations: Remember: The TOPs or BOTTONS left by the indicator are good Trade Location points. This is because the players who were "stuck" in these regions w
FREE
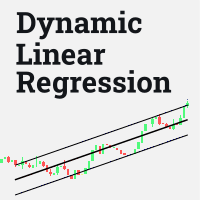
Este indicador traça uma reta baseada em regressão linear, esta reta é dinâmica e é atualizada a cada tick. O cálculo de regressão linear é feito considerando o número de candles definido pelo tamanho da janela fornecida pelo usuário. São traçadas duas linhas, uma superior e uma inferior, para guiar a estratégia do usuário, a distância dessas linhas para a linha central deve ser configurada. É possível definir os estilos, cores e espessuras de cada uma das linhas.
Esse indicador foi inicialmen
FREE

Classic RSL This is the classic indicator "Relative Strength Levy" (RSL), according to Dr. Robert Levy's study, called "The Relative Strength Concept of Common Stock Pricing", which was released as a hardcover book in late 60's of the last century.
Key concept Use this indicator on various instruments to compare their relative strength: The resulting analysis values will fluctuate around 1 The strongest instruments will have the highest RSL values (above 1) and the weakest instruments wi
XP Moving Average MT5 – Your All-in-One Trading Powerhouse Master the markets with XP Moving Average MT5 , the ultimate moving average indicator for MetaTrader 5. Whether you’re scalping , swing trading , or investing long-term , this versatile tool combines 9 advanced moving averages in one—enhanced with a modern graphical dashboard and real-time alerts . With AI-powered insights coming soon , XP Moving Average is your key to smarter, more profitable trades . Why Choose XP Moving Average?

I present to you an indicator for manual trading on DeMark's trend lines. All significant levels, as well as the indicator signals are stored in the buffers of the indicator, which opens the possibility for full automation of the system. Bars for calculate (0 = unlimited) - Number of bars to search for points DeMark range (bars) - Shoulder size to determine point

The Stepper indicator generates Signals in strong Trend zones. Even when the Trend is set, we must filter when to ENTER or HOLD the trigger. The Trend is represented by two lines: Trend UP and Trend DOWN. W e are in a Bullish trend when the Trend UP (Green line) is above. And in a Bearish trend when the Trend DOWN (Pink line) is above.
When the momentum is aligned with the Trend , this indicator generates: BUY signals (LIME line) SELL signals (RED line) The user is alerted of the scenario, at
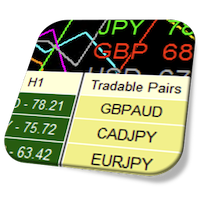
Currency Strength Meter is the easiest way to identify strong and weak currencies. This indicator shows the relative strength of 8 major currencies + Gold: AUD, CAD, CHF, EUR, GBP, JPY, NZD, USD, XAU. Gold symbol can be changed to other symbols like XAG, XAU etc. By default the strength value is normalised to the range from 0 to 100 for RSI algorithm: The value above 60 means strong currency; The value below 40 means weak currency;
This indicator needs the history data of all 28 major currency
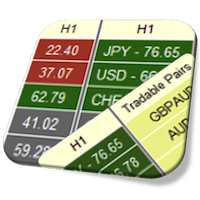
Currency Strength Meter is the easiest way to identify strong and weak currencies. This indicator shows the relative strength of 8 major currencies + Gold: AUD, CAD, CHF, EUR, GBP, JPY, NZD, USD, XAU. Gold symbol can be changed to other symbols like XAG, XAU etc.
By default the strength value is normalised to the range from 0 to 100 for RSI algorithm: The value above 60 means strong currency; The value below 40 means weak currency;
This indicator needs the history data of all 28 major currency
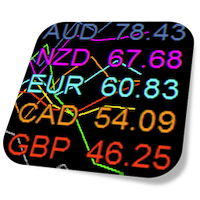
Currency Strength Meter is the easiest way to identify strong and weak currencies. This indicator shows the relative strength of 8 major currencies + Gold: AUD, CAD, CHF, EUR, GBP, JPY, NZD, USD, XAU. Gold symbol can be changed to other symbols like XAG, XAU etc.
By default the strength value is normalised to the range from 0 to 100 for RSI algorithm: The value above 60 means strong currency; The value below 40 means weak currency;
This indicator needs the history data of all 28 major currency
이 다중 시간 프레임 및 다중 기호 표시기는 스토캐스틱 신호 라인이 스토캐스틱 메인 라인을 교차하는 시기를 식별합니다. 대안으로 스토캐스틱이 과매수/과매도 영역을 벗어나는 경우(본선을 가로지르는 신호선 없이) 경고할 수도 있습니다. 보너스로 볼린저 밴드와 RSI 과매수/과매도 교차를 스캔할 수도 있습니다. 자신의 규칙 및 기술과 결합하여 이 지표를 사용하면 자신만의 강력한 시스템을 만들거나 향상시킬 수 있습니다. 특징 Market Watch 창에 표시되는 모든 기호를 동시에 모니터링할 수 있습니다. 지표를 하나의 차트에만 적용하고 전체 시장을 즉시 모니터링하십시오. M1에서 MN까지 모든 시간 프레임을 모니터링할 수 있으며 교차가 식별되면 실시간 경고를 보냅니다. 모든 Metatrader 기본 경고 유형이 지원됩니다. 표시기에는 대화형 패널이 포함되어 있습니다. 설명은 별도의 스크린샷을 참조하십시오. 표시기는 신호를 텍스트 파일에 쓸 수 있습니다. 또는 전역 변수
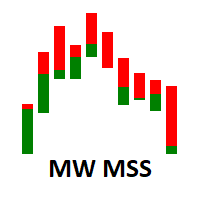
The Martinware Market Sides' Strength indicator shows the candlestick chart in a different manner allowing for a clearer view of which side, bullish or bearish is dominating the asset in the current period. As a bonus, it can also show an internal area that can be used to visualize two levels of Fibonacci retracements inside the bars.
The default configuration shows the MSS bars with 4 main colors, two representing the bullish force, and two representing the bearish one. The primary colors ar
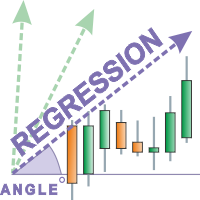
The Regression indicator shows the direction of the trend. The graph shows up to 3 regression lines with different time periods. The straight line is built as the average inside the wave channel of the price movement (shown on one ScreenShot).
In this case, you can disable any of the lines. Also, the indicator allows you to change the color for each line. It is interesting to calculate the relative angle in degrees. The angle display can also be turned off.
Thanks to this indicator, you can s

The indicator draws support and resistance lines on an important part of the chart for making decisions. After the trend line appears, you can trade for a breakout or rebound from it, as well as place orders near it. Outdated trend lines are deleted automatically. Thus, we always deal with the most up-to-date lines. The indicator is not redrawn .
Settings:
Size_History - the size of the calculated history. Num_Candles_extremum - the number of candles on each side of the extremum. Type_Arrow
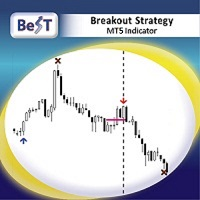
BeST_Breakout Strategy MT5 is an Metatrader Indicator based on a proprietary algorithm implementing a very powerful tool that can exploit every breakout leading to huge market movements.It timely locates the most likely points for Entering the Market as well as the most suitable Exit points and can be used successfully as a standalone Trading System which performance is often accompanied by very impressive statistics of % Success Ratio and Profit Factor . The BeST_Breakout Strategy is a non-rep
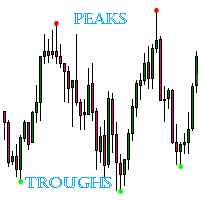
The indicator detects important peaks and troughs (extremes) on the chart. These points can be used to plot support/resistance levels and trend lines, as well as any other graphical analysis. These points can serve as reference points for setting trading orders. The indicator does not redraw .
Settings:
Size_History - the size of the calculated history. Num_Candles_Right - number of candles to the right of the peak or trough.
Num_Candles_Left - number of candles to the left of the peak or

Do you use volume in your reading of the market?
Certainly many traders use it, and do not imagine operating without it.
The Color Histogram Volume Set indicator allows the user to choose the value that he considers interesting to monitor.
When you pass this you will have visual confirmation and if you want you will also have the audible alert that is given by the indicator.
Of course, there are other ways to try to find a high volume, such as assessing whether the volume is above av

Do you use volume in your reading of the market?
Certainly many traders use it, and do not imagine operating without it.
The Color Candle Volume Set indicator allows the user to choose the value that he considers interesting to monitor.
When you pass this you will have visual confirmation on the price chart and if you want you will also have the audible alert that is given by the indicator.
Of course, there are other ways to try to find a high volume, such as assessing whether the vol

Trend Factor is an indicator based on the calculation of price values to answer questions about what direction the trend is acting on the market at the moment and when this trend will end.
By launching the Trend Factor indicator, the user will see two lines and bars of different colors, which can change color to green during an uptrend, to red during a downtrend or to be yellow during an uncertainty.
The trader uses the Trend Factor indicator to determine the market situation. This is a tre

Simple Calendar Events is an indicator that will mark important Important Economy Events on your chart. For example, if you are trading something that is USD based, you would like to know when some important events are coming, you can expect some volatility or some different Price action, so you can base your strategy on it. If you trade something that is country based you can also choose that, and it will show you when the event is, so you can be prepared for it. When you hover with the mouse
FREE

Introduction to Fractal Pattern Scanner Fractal Indicator refers to the technical indicator that makes use of the fractal geometry found in the financial market. Fractal Pattern Scanner is the advanced Fractal Indicator that brings the latest trading technology after the extensive research and development work in the fractal geometry in the financial market. The most important feature in Fractal Pattern Scanner is the ability to measure the turning point probability as well as the trend probabil
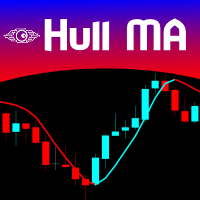
The Hull Moving Average is not very well know in novice and maybe in intermediate trading circles, but it is a very nice solution created by the trader Alan Hull - please visit www.AlanHull.com for full details of his creation. The purpose of this moving average is to solve both problems that all famouse and common moving averages have: Lag and Choppiness . The implementation we did has, apart of the Period configuration and Price type to use in the calculations, a "velocity" factor, which could
FREE
Chart Slice is a very convenient multi-timeframe indicator, with which you can see market information at once on several time slices. This will allow the trader to learn quickly and most importantly understand the vibrant market . The author himself went this way and this indicator helped incredibly. You probably have often wanted to see in detail why at a given point in time the price was rapidly moving away from a certain level or, on the contrary, stopping there. And for this you had to chan
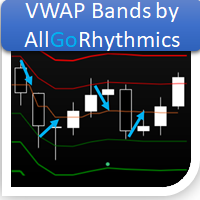
This indicator calculates the Daily VWAP and projects its Bands in 3 upper levels and 3 lower levels (Supports and Resistances), offset by the Standard Deviation selected by the user.
How to configure: Choose the symbol and the desired graphic time; Choose the type of price that is most suitable to calculate the Desired VWAP; Choose whether or not you want the Bands to be plotted; Choose the type of Volume you want to use (Ticks or Real); Choose the type of Calculation of the Bands (Deviation

This indicator allows you to monitor and correlate several assets simultaneously. Using an operational reading technique applied in Multimarkets, the user is able to observe the behavior of other assets visible to the current asset that is operating. With this, the user's ability to make decisions becomes more robust and grounded.
The indicator has the capacity to list up to 4 assets, with the possibility, also, to change the type of quote and be used both for the current price and the past pr

The Larry Wiliams' indicator named WillSpread considers the influence of the secondary Asset (Symbol) on the current Asset (trading). Indicator essence is to transform the correlation between assets in accumulated history data, providing an opportunity to detect various peculiarities and patterns in price dynamics which are invisible to the naked eye. Based on this information, traders can assume further price movement and adjust their strategy accordingly. As exposed on his Book, Larry says: "a

Gossamer is a moving average ribbon indicator that uses a novel approach to identify breakout trades in trending markets. By applying a progressive period shift to each moving average, levels of consolidation become visible. Enter trades when price breaks out in the direction of the prevailing trend. Stoploss should be located on the other side of the consolidation from the breakout. Profits can be taken at the next consolidation or the stoploss trailed and the position built. Applicable to a
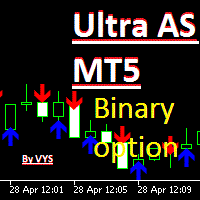
The indicator is designed for binary options trading. The "period" parameter can be adjusted to fit your trading strategy, allowing you to customize the number and quality of signals. A red arrow pointing down indicates a sell signal, while a blue arrow pointing up indicates a buy signal. Recommended expiration time is one candle. You can enter a trade either when the signal appears or on the next candle. Attention: the signal may sometimes disappear on the current candle, so it's important to
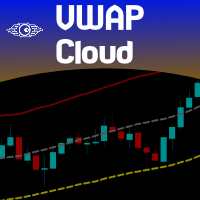
Do you love VWAP? So you will love the VWAP Cloud . What is it? Is your very well known VWAP indicator plus 3-levels of Standard Deviation plotted on your chart and totally configurable by you. This way you can have real Price Support and Resistance levels. To read more about this just search the web for "VWAP Bands" "VWAP and Standard Deviation".
SETTINGS VWAP Timeframe: Hourly, Daily, Weekly or Monthly. VWAP calculation Type. The classical calculation is Typical: (H+L+C)/3 Averaging Period to
FREE

A very useful Price Action point is the previous day Closing VWAP. We call it Big Players Last Fight . This indicator will draw a line showing on your chart what was the last VWAP price of the previous trading session. Simple and effective. As an additional bonus, this indicator saves the VWAP value on the Public Terminal Variables, so you EA could read easily its value! Just for the "Prefix + Symbol name" on the variables list and you will see!
SETTINGS How many past days back do you want to s
FREE
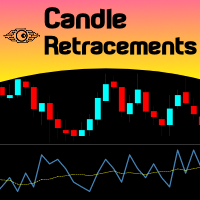
Do you want to know how much, how frequent and at what level a candlestick retraces over the previous one, just drop Candles Retracement over your chart and see it visually! Just choose your desired timeframe and the indicator will show it graphically. As simple as that... In addition you have the option to calibrate a Moving Average over this sub-window chart monitor. This indicator could be used to study candle retracements levels so you can comfortably expect during a trade what to expect fro
FREE
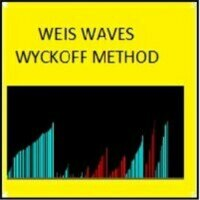
through this indicator you can make analysis and also can to distinguish possible weakness or continuous strength on price, it is an indicator initially developed by David Weis. This version is for the meta trader 5 platform. The Weis Waves indicator is based on volume and is aligned with the price, being able to find not only possible strenght and weakness, but also possible divergences between price and volume, bringing an interesting analysis between both.

The 9-5 Count is designed to track a very powerful cycle that runs through all freely traded markets. This is not a time cycle but a price cycle. The time spent between two points is not as important as the price traveled between them. The 9-5 Count is called that because one complete upward cycle consists of measurement of 9 units plus 5 units of cycle time. This tool takes into account price and pattern together, so it’s more than just a simple cycle. The 9-5 theory classifies market movemen

PROMOTIONAL PERIOD - ONLY 2 COPIES LEFT OF FIRST 10 BUYERS AT PRICE 300,00$!!!
CHECK SCREENSHOTS AND COMMENTS FOR OUR STRATEGY RULES AND LIVE TRADES SIGNALS PULL IT BACK is a revolutionary trading system and a complete strategy with advanced algorithm developed to detect the trend direction after a PULLBACK , a RETREACEMENT or a KEY LEVEL BOUNCE . The goal of this indicator is to get as many pips as possible from market trend. Following strictly the rules of the strategy, you can become a
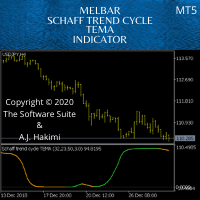
Schaff Trend: A Faster And More Accurate Indicator In Combination With The TEMA MACD - Scalping Systems Advantage
The Schaff Trend Cycle (STC) is a charting indicator that is commonly used to identify market trends and provide buy and sell signals to traders. Developed in 1999 by noted currency trader Doug Schaff, STC is a type of oscillator and is based on the assumption that, regardless of time frame, currency trends accelerate and decelerate in cyclical patterns. https://www.investopedia.c

In which direction should I trade today? For “TREND followers”, we need to determine the TREND . This indicator determines the Trend based on the price High, Low and Close of every bar, for a given period and timeframe. Calculating and plotting the Trend UP and Trend DOWN lines. If the: “Trend UP” line (Green) is above the “Trend DOWN” line (Red), then it is a BULLISH Trend (see "Screenshots" tab). “Trend DOWN” line (Red) is above the “Trend UP” line (Green), then it is a BEARISH Trend (see "
FREE

Volume Weighted Average Price (VWAP) The volume weighted average price (VWAP) is a trading benchmark used by traders that gives the average price a security has traded at throughout the day, based on both volume and price. It is important because it provides traders with insight into both the trend and value of a security. This indicator VWAP V2 is free and is the manual version of the extended Easy VWAP indicator (30 Euro), where the date and time properties are automatically entered. With
FREE
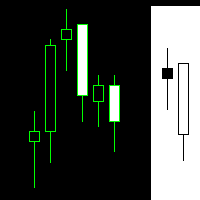
The Martinware Manual Trading Helper indicator is aimed at helping people start their lives in manual trading. It can be used to display both some generic images at the right side of the graph, where custom operational remarks may be displayed or just a blank rectangle hiding the chart while backtesting. Moreover, it can periodically play a list of sounds. To show a blank rectangle, let the first image name input field empty and select the desired color. To show one or more custom images inste
FREE

This tool draws candles at different TIMEFRAME from the 'pattern' displayed on the screen... ...In the 'Standard Chart' M1, he draws the Candles in M15. For example: The 'Standard Chart' in M1, the 'OHLC' in M15 are drawn the Candles (boxes) of M15 behind the candles of M1.
Download the demo version... ...see how it can help you notice Support/Resistance points as well as good moves with highs and lows in the 15M.
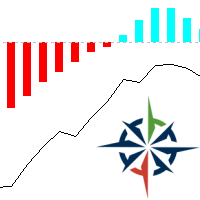
Designed by Fábio Trevisan, VolumeCapacitor is an indicator that, in addition to showing the volume quantity, shows its direction, having as main characteristic, the possible price tops and bottoms, or pullback areas. With its simple but not simplistic calculation method, it is able to determine areas where the defense of long and short positions can be assessed with a simple observation. VolumeCapacitor uses in its unique formula the OBV (Balance of Volume, or On-Balance Volume) idealized by J
MetaTrader 마켓은 개발자들이 거래 애플리케이션을 판매할 수 있는 간단하고 편리한 사이트이다.
제품을 게시하고 마켓용 제품 설명을 어떻게 준비하는가를 설명하는 데 도움이 됩니다. 마켓의 모든 애플리케이션은 암호화로 보호되며 구매자의 컴퓨터에서만 실행할 수 있습니다. 불법 복제는 불가능합니다.
