 MetaTrader 5
 Experts
 지표
지표
 라이브러리
라이브러리
 유틸리티
유틸리티
 위젯
위젯
 규칙
규칙
MetaTrader 5용 무료 기술 지표 - 11
 기술 지표의 시그널은 주식 및 외환 시장에서 거래를 개시 및 종료하는 데 중요한 역할을 합니다. 지표의 본질은 미래의 가격 변화를 예측하기 위한 금융 시그널 값의 수학적 변형입니다.
기술 지표를 테스트하여 시장 행동과 그로 인한 이익을 더 잘 예측할 수 있습니다.
기술 지표의 시그널은 주식 및 외환 시장에서 거래를 개시 및 종료하는 데 중요한 역할을 합니다. 지표의 본질은 미래의 가격 변화를 예측하기 위한 금융 시그널 값의 수학적 변형입니다.
기술 지표를 테스트하여 시장 행동과 그로 인한 이익을 더 잘 예측할 수 있습니다. 
개요
MetaTrader 5 전용으로 설계된 초경량 고성능 거래량 분포 지표인 Anchored Volume Profile을 통해 프로 등급의 오더 플로우(Order Flow) 분석을 경험해 보세요. 로우 메모리 캔버스(Canvas) 메커니즘을 사용하여 처음부터 새로 구축된 이 지표는 표준 사각형 객체 프로필과 일반적으로 관련된 심각한 CPU 지연, UI 깜빡임 및 차트 멈춤 현상을 완전히 제거합니다.
터미널 고유의 틱 볼륨을 방향성 매트릭스로 처리함으로써 시장 경매 구조의 시각적으로 뛰어난 픽셀 단위의 완벽한 레이아웃을 제공하므로 기관의 지지, 저항 및 핵심 유동성 풀을 절대적인 정밀도로 정확하게 찾아낼 수 있습니다. 핵심 프로페셔널 기능: 캔버스 엔진(Canvas Engine): 전체 프로필 배열을 플랫 스크린 공간 메모리 비트맵에 직접 그립니다. 레이아웃은 새로운 틱이 발생할 때 단일 스레드 사이클에서 즉시 업데이트되어 화면 지연을 완전히 제거합니다. 방향성 업/다운 틱 분할
FREE

Smart Flow - Institutional Aggression Tracker Smart Flow is a powerful and intuitive indicator designed to read the true market order flow and identify zones of strong institutional aggression. Instead of guessing tops and bottoms, Smart Flow directly paints your chart's candles whenever it detects a relevant directional capital injection, making your trading decisions highly objective. Working Principle The indicator performs an advanced mathematical calculation on every candle to estimate the
FREE

The indicator draws the daily open line. Parameters
GMT shift (minutes) The time zone could be shifted. The value is given in minutes. Draw closest regular bar's open price This parameter could fine-tune the open price line when using GMT shift. Yes - Draw the open line based on the current chart period's closest regular bar No - Draw the open line based on the M1 chart's closest bar. Let's assume that your shift is 10 minutes, and you are using H1 chart and the first candle in every day is 0
FREE

Market Structure and Liquidity Market Structure and Liquidity is a chart-analysis indicator for price-action traders. It combines confirmed market structure, Break of Structure (BOS), Change of Character (CHoCH), equal highs/lows, and liquidity sweeps on a single chart. Optional alerts and a dashboard provide additional information about current market bias, structure, and reference levels. What It Is
A visual analysis tool for studying market structure and liquidity behavior. What It Is Not
I
FREE

Weis Wave Scouter Basic은 MetaTrader 5용으로 설계된 당사의 유명한 인디케이터의 기본 버전으로, Wyckoff 방법론과 VSA(Volume Spread Analysis) 개념을 쉽고 효율적으로 탐색하려는 트레이더를 위해 설계되었습니다. 볼륨 파동 읽기를 기반으로 하여 시장 움직임을 명확하게 식별할 수 있으며, Richard Wyckoff가 가르친 노력 대 결과 및 수요 공급 원칙에 중점을 둡니다. Weis Wave Scouter Basic을 사용하면 기본 색상 테마(Classic)로 상승 및 하락 파동을 직관적인 히스토그램으로 시각화할 수 있어 트렌드 및 반전 해석이 쉬워집니다. Brick Size 및 Volume Scale Factor와 같은 기본 조정을 지원하며, 틱 볼륨 또는 실제 볼륨을 사용할 수 있는 옵션을 제공하여 Forex, 주식, 암호화폐 등 다양한 시장에 적합합니다. 초보자나 간단한 도구를 원하는 트레이더에게 완벽한 Weis Wave Sco
FREE

Heatmap Volume is a MetaTrader 5 indicator that measures how far the current volume deviates from its moving average, expressed in standard deviations. It helps you spot abnormal volume the instant it happens instead of judging bars by eye. Features Standard-deviation volume engine: calculates stdbar = (Current Volume - SMA of Volume) / Standard Deviation, so volume is graded against its own recent norm. Five threshold levels: Extra High, High, Medium, Normal and Low, each with its own color, so
FREE

Scale Enforcer is a chart utility for MetaTrader 5. It addresses a common platform behavior: every time you change the symbol or timeframe, MT5 switches the chart back to automatic price scaling, and vertical dragging of the price axis stops working until you re-enable the fixed scale manually.
The indicator switches the chart to a fixed scale automatically and fits it to the bars on screen, so the chart can be dragged up and down at once after any symbol or timeframe change. When the indicator
FREE
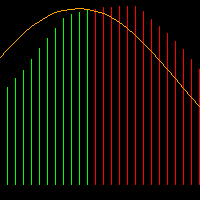
The Impulse MACD is a technical indicator that combines the power of multiple moving averages to create a unique momentum oscillator. Unlike traditional MACD indicators, this tool uses three different moving averages applied to high, low, and weighted price data to generate more precise market impulse signals. Its strength is its excellent filtering capability during ranging markets. Visual Elements Color-coded Histogram : Dynamic green/red bars that change color based on momentum direction Sign
FREE

TM Price Stretch Map은 캔들이 밴드 밖에서 마감한 뒤 다음 확정 캔들이 밴드 안으로 돌아왔는지 차트에 표시합니다. 실선 밴드는 해당 시점까지 확인된 가격만 사용하는 인과적 가우시안 커널 계산을 기반으로 합니다. 상단 밴드 위에서 마감하면 빨간 점, 하단 밴드 아래에서 마감하면 청록색 점이 표시됩니다. 그 다음 확정 캔들이 두 밴드 안에서 마감하면 상단 이탈 뒤에는 아래쪽 화살표, 하단 이탈 뒤에는 위쪽 화살표가 표시됩니다. 점과 화살표는 실선 밴드만 기준으로 계산됩니다. 선택 가능한 점선 밴드는 과거 데이터를 소급하여 평활화하므로 새 캔들이 생기면 과거 곡선이 다시 그려질 수 있습니다. 점선은 시각적 분석용이며 점이나 화살표를 생성하지 않습니다. 커널 대역폭, 밴드 폭, 가격 소스, 표시 기간, 색상, 중심선과 마커를 설정할 수 있습니다. 자동 매매를 하지 않으며 가격 반전을 보장하지 않습니다.
FREE

Viprasol Sniper Confluence Viprasol Sniper Confluence is a multi-factor technical analysis indicator for MetaTrader 5. It combines several market conditions into a single chart interface to help traders evaluate market direction, momentum, trend structure, volatility, and price position. The indicator calculates bullish and bearish conditions and presents the information through chart signals and an optional market dashboard. A configurable confluence filter can be used to require several condit
FREE

정밀하게 시장의 심리를 마스터하세요 시장은 인간의 심리와 기관의 오더 플로우에 의해 강하게 구동됩니다. TradingLabs Round Number Indicator는 차트에서 심리적 가격 수준을 자동으로 식별하고 플롯하도록 설계된 프리미엄 차트 작성 도구입니다. 외환, 금, 지수 중 무엇을 거래하든 가격 액션은 자연스럽게 둥근 숫자(라운드 넘버)로 끌리는 경향이 있습니다. 대형 기관, 은행, 알고리즘 트레이딩 시스템은 정확히 이러한 심리적 수준에 대규모 미체결 주문, 테이크 프로핏(수익 실현), 손절매를 지속적으로 배치합니다. 이 지표를 사용하면 '스마트 머니(Smart Money)'의 렌즈를 통해 시장을 바라보게 됩니다. 수동으로 지지선과 저항선을 긋는 추측 작업을 없애주므로 시장 분석에 있어 심오하게 단순하면서도 매우 수익성 높은 접근 방식입니다. 이 지표가 필수 도구인 이유: 자연스러운 지지 및 저항: 둥근 숫자는 보이지 않는 장벽 역할을 합니다. 상승하는 가격은 주요 둥근
FREE

이 지표는 여러 시간대를 사용하여 호황 1000의 최고 매수 항목을 분석합니다. 이는 호황 급등 시에만 거래하는 데 도움이 되도록 맞춤화되었습니다. 표시기에는 두 개의 화살표가 있습니다. 빨간색과 파란색 것. 빨간색 화살표가 형성되면 구매 진입 신호인 파란색 화살표에 대비해야 함을 나타냅니다. 표시기는 종료 지점을 제공하지 않습니다. 항상 3핍을 모으세요. 즉, 10230.200에 거래를 시작한 경우 SL을 1핍, 즉 10220.200에 10260.200에 청산할 수 있습니다. 해당 규칙을 준수하고 규율을 유지한다면 이 지표가 거래에 도움이 될 수 있습니다.
지표가 왜 필요한가요?
-시장을 분석하고 알림 형태로 휴대폰, 태블릿 또는 컴퓨터에 실시간 신호를 보냅니다.
-신호 알림을 받고, 거래를 하고, 다음 알림을 기다리는 동안 다른 작업을 수행합니다.
요구 사항은 무엇입니까?
-실시간 신호 알림을 위한 표시기를 호스팅하려면 vps가 필요합니다.
-VPS의 거래 터미널에서
FREE
AlgoRhythm ZLSMA - The Ultimate Trend Trading Solution Unlock the power of precision trading with AlgoRhythm ZLSMA , an advanced technical indicator designed to deliver razor-sharp trend signals. Engineered for MetaTrader 5, this cutting-edge Zero Lag Smoothed Moving Average (ZLSMA) combines sophisticated smoothing techniques, multi-timeframe analysis, and dynamic bands to give traders a competitive edge in any market. Whether you're a scalper, swing trader, or long-term investor, AlgoRhythm ZLS
FREE

Trading Session Indicator The Trading Session Indicator visualizes the high and low points as well as the start and end times of the Asian, London, and New York trading sessions directly on your chart. Features: Visualization of major trading sessions Highlighting of high and low points Display of start and end times for each session Customizable session times User-friendly and efficient Customizability: Each trading session (Asian, London, New York) can be individually customized to match speci
FREE

Quanty HTF Candles shows the candles of higher timeframes, such as H4, D1 and W1, in a small floating panel on your chart. The candle forming now sits on the right of each timeframe, with its change and the time left until it closes, so you can follow the multi timeframe picture without switching charts.
The panel - Drag it by its header to any place on the chart. - Resize it by dragging its right edge, its bottom edge or the grip in the corner. The text grows and shrinks with it. - The minus
FREE

Trend Arrow NR는 빠른/느린 EMA 교차와 ATR 배수로 측정한 최소 이격을 쓰는 단순 추세 필터로 매수/매도 화살표를 표시합니다. 리페인트 없음(정직) 화살표는 확정 봉에만 기록됩니다(버퍼 인덱스 ≥ 1). 형성되는 봉에는 화살표가 없습니다. 과거 화살표는 새 틱에 움직이지 않습니다. 알림은 신호 봉당 한 번(팝업/푸시/이메일 — 선택). 입력 - Fast EMA / Slow EMA 기간 - ATR 기간과 신호 무장용 최소 ATR 배수 - 팝업, 푸시, 이메일 알림 - 포인트 단위 화살표 오프셋 대상 - 확정 봉의 단순한 시각 힌트가 필요한 재량 트레이더 - 수동 리스크·청산 도구(예: Risk Trade Panel)의 무료 동반 지표 요구 사항 - MetaTrader 5 - 관찰하는 임의 심볼/타임프레임 사용 방법 1. TrendArrowNR을 Indicators에 넣고 필요 시 컴파일 후 차트에 첨부합니다. 2. 타임프레임에 맞게 EMA/ATR을 조정합니다. 3. 원
FREE

ICT Premium Discount Ote Tjmas is a FREE institutional MetaTrader 5 indicator that automatically maps Multi-Timeframe Dealing Ranges (100% Premium, 50% Equilibrium EQ, 0% Discount) and the Optimal Trade Entry (OTE 0.62 - 0.705 - 0.79) zone with clean Right-Margin Brackets ']'. Built 100% natively in MQL5 with zero lag for Index Futures/CFDs (US100/NQ, US500/ES, US30/YM), Gold (XAUUSD), Crypto (BTCUSD), and Forex. KEY INSTITUTIONAL FEATURES: 1. Multi-Timeframe Dealing Range (100% Premium / 50% EQ
FREE
멀티 타임프레임 지원, 사용자 정의 시각적 신호 및 고도로 구성 가능한 알림 시스템을 갖춘 Traders Dynamic Index(TDI) 지표.
프리랜서 프로그래밍 서비스, 업데이트 및 기타 TrueTL 제품은 제 MQL5 프로필 에서 확인하실 수 있습니다.
피드백과 리뷰는 매우 감사하게 받겠습니다!
TDI란 무엇인가요? Traders Dynamic Index(TDI)는 Dean Malone이 개발한 복합 지표로, RSI, RSI에 적용된 볼린저 밴드, RSI의 두 이동 평균을 하나의 디스플레이에 결합합니다. 모멘텀, 변동성 및 추세 방향을 포함한 시장 역학에 대한 포괄적인 시각을 제공합니다. 이 지표는 다섯 개의 선으로 구성됩니다: RSI 가격선(원시 RSI), 거래 신호선(RSI의 빠른 MA), RSI 신호선(RSI의 느린 MA, 변동성 밴드의 중심선이기도 함), 변동성 밴드 상단 및 하단(RSI에 적용된 볼린저 밴드). 기능: 독립적으로 스타일이 설정된 다섯 개의 선:
FREE
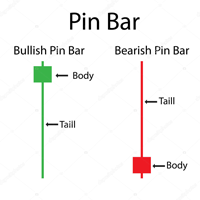
Pin bar pattern is characterized by a long upper or lower wick with a small body relative to the size of the wick with little to no lower or upper shadows. Pin bars are not to be traded in isolation , but need to be considered within the larger context of the chart analysis. A pin bar entry signal, in a trending market, can offer a very high-probability entry and a good risk to reward scenario.
Inputs Multiplier ; AlertOn - enable alerts; EmailAlert - enable email alerts; PushAlert - en
FREE
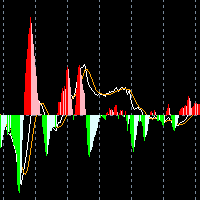
Necessary for traders: tools and indicators Waves automatically calculate indicators, channel trend trading Perfect trend-wave automatic calculation channel calculation , MT4 Perfect trend-wave automatic calculation channel calculation , MT5 Local Trading copying Easy And Fast Copy , MT4 Easy And Fast Copy , MT5 Local Trading copying For DEMO Easy And Fast Copy , MT4 DEMO Easy And Fast Copy , MT5 DEMO MACD is called Convergence and Divergence Moving Average, which is developed from the double e
FREE

### Best Order Block Detector Indicator for MT5
The Order Block Detector is a technical analysis indicator designed for MetaTrader 5 (MT5). It identifies potential order blocks (OBs) in the market, which are key price levels where significant buying or selling activity has occurred, often acting as support or resistance zones. These blocks are detected based on volume pivots and market structure swings, helping traders spot areas of institutional interest for potential reversals or continuation
FREE

ZigZag Support and Resistance Levels 는 여러 시간대의 ZigZag 전환점을 기반으로 지지선과 저항선을 식별하는 지표입니다. 선택한 시간대의 가격 수준을 하나의 차트에 통합하여 트레이더가 잠재적인 컨플루언스 영역(여러 가격 수준이 겹치는 구간)과 중요한 가격 수준을 파악할 수 있도록 도와줍니다. 이 지표는 ATR을 기반으로 서로 가까운 가격 수준을 지지 및 저항 영역으로 그룹화하고, 유효한 수준과 돌파된 수준을 구분하며, 차트 내 대화형 제어 패널을 통해 표시 요소를 실시간으로 관리할 수 있습니다.
주요 기능 1. 다중 시간대 분석 여러 시간대의 지지선과 저항선을 동시에 분석합니다. M1,M5,H1 과 같이 쉼표로 구분된 목록을 사용하여 원하는 시간대 조합을 설정할 수 있습니다. 시간대를 지정하지 않으면 현재 차트의 시간대를 자동으로 사용합니다. 상위 시간대의 지지선과 저항선을 현재 차트에 직접 표시합니다. 서로 다른 시간대의 가격 수준이 모이는 잠재
FREE

SVP Zones SM ICT (Lite) — Institutional Accumulation Zones, Breakout Signals, and Live Chart Statistics
Most traders see price movements after the fact—when the momentum has already occurred, and the entry stop-loss is too large. SVP Zones SM ICT solves the main problem of intraday trading: it detects the hidden limit accumulation phase after the momentum in real time and provides an entry point at the start of a new move with a pre-calculated Stop Loss and three Take Profit targets.
The Lite
FREE

Cybertrade Keltner Channels - MT5 Created by Chester Keltner, this is a volatility indicator used by technical analysis. It is possible to follow the trend of financial asset prices and generate support and resistance patterns. In addition, envelopes are a way of tracking volatility in order to identify opportunities to buy and sell these assets.
It works on periods longer than the period visible on the chart. All values are available in the form of buffers to simplify possible automations.
FREE

Auto Trendline Breakout Arrows MT5
Auto Trendline Breakout Arrows is a powerful non-repainting indicator designed to automatically detect trendlines and generate accurate breakout signals.
This tool automatically draws trendlines based on recent market structure and provides BUY and SELL arrows when a valid breakout occurs.
The indicator is suitable for XAUUSD (Gold), Forex pairs, and indices, especially on M5, M15, and H1 timeframes.
Key Features:
- Automatic trendline detection - Accurat
FREE
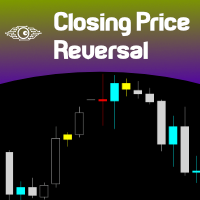
Closing Price Reversal is a very well known and traded candlestick pattern. This little indicator paints with specific (user-selected) colors the Closing Price Reveral Up and Down patterns, as well as the Inside Bars (as a bonus). Higher timeframes are more effective as with all other candlesticks patterns. Do NOT trade solely on this indicator. Search the web for "Closing Price Reversal" to learn about the several approaches that can be used with this pattern. One of them is combining short/me
FREE
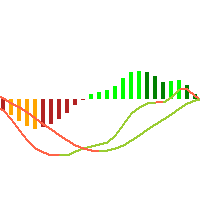
This is just a MACD with multi symbols, multi timeframes, and multi colors. features. different symbols and timeframes from the main chart. draw main line, signal line, and histogram. each line can be erased. the ascent and descent can be distinguished. Due to the above features, this MACD is suitable for multiple lineups in a single chart. This can be used in the same way as MiniCandles.
FREE

Stop chasing every flickering candle. Most candlestick indicators fail because they treat a "Hammer" in the middle of a trend the same as a "Hammer" at a major reversal point. Candlestick Pattern Analytics changes that by filtering for structure, strength, and logic.
## Why This Indicator is Different While common tools "spam" your chart with every pattern they find, this indicator focuses on Quality over Quantity. Swing-Based Intelligence: By default, signals only appear at local swing highs o
FREE

Smart Trendline Detector Smart Trendline Detector is an automatic multi-timeframe trendline analysis indicator for MetaTrader 5 that detects and ranks rising support and falling resistance structures using market swing points. Instead of filling the chart with every possible trendline, the indicator evaluates qualifying structures and displays only a controlled number of the strongest candidates according to configurable ranking criteria. The result is a cleaner chart with relevant trendline str
FREE

Pinbar Yoshi Pro – Clean Multi-Timeframe Pin Bar Detection for MetaTrader 5
Pinbar Yoshi Pro is a clean and practical MT5 indicator designed for traders who use price action, candlestick rejection, support and resistance, market structure and multi-timeframe analysis in their daily trading routine. The purpose of this tool is simple: to help traders detect bullish and bearish Pin Bar candles more clearly, more consistently and with less manual chart scanning.
In real trading, a Pin Bar is not
FREE

Know exactly how much time remains before the current candle closes. HMS Candle Timer MT5 is a lightweight and customizable candle countdown indicator designed for traders who want a clear view of the remaining time on the active candle. The countdown is displayed directly near the current candle, keeping important timing information visible without turning your chart into a complicated dashboard. Whether you trade lower timeframes or monitor longer market structures, HMS Candle Timer provides a
FREE

Smart Structure Buy Sell Signals is a visual market structure indicator developed primarily for Gold (XAUUSD) intraday trading on MetaTrader 5. The indicator combines market structure, momentum, liquidity behaviour and supply-demand zones to identify potential Buy and Sell opportunities. It provides clear trading levels while keeping the final trading decision completely under the user’s control. This is a manual trading indicator. It does not open, modify or close real trades. Main Features • C
FREE

Liquidity Break Retest Scanner – Overview
The Concept: Smart Money's Three-Step Process
This isn't just another indicator that paints lines on a chart and hopes for the best. This is a complete market structure analysis engine that tracks exactly what institutional traders do: they create liquidity, they break structure to trap retail traders, and they come back to retest key zones before continuing their move.
Every successful institutional trade follows a predictable pattern. First, price
FREE

Master FlowPulse는 MetaTrader 5용으로 개발된 전문 시장 흐름 지표입니다. 하나의 독립적인 지표에서 시각적 흐름 프로필, 방향성 구간, 캔들 카운트다운 및 동적 꼬리 반전 감지 기능을 결합합니다. 프로필은 가격 눈금 근처에 표시되어 메인 차트 영역을 보존하면서 매수 및 매도 압력을 명확하게 확인할 수 있습니다. 주요 기능: 매수 및 매도 흐름을 나타내는 시각적 프로필 동적 유동성 및 강도 구간 상승 압력과 하락 압력의 자동 분석 현재 심볼 및 시간대 식별 W1, D1, H4, H3, H2 및 H1 시각적 기준 H1, M30, M15 및 M5 캔들 카운트다운 현재 캔들 옆에 표시되는 이동식 카운트다운 위쪽 및 아래쪽 꼬리의 동적 감지 가능한 반전이 감지될 때 시각적 펄스 표시 청록색 계열을 사용한 매수 반전 표시 자홍색 계열을 사용한 매도 반전 표시 노란색 계열을 사용한 양방향 반전 표시 오래된 화살표 및 확인된 캔들 표시 자동 정리 다양한 차트 크기에 대응하는
FREE

Altın Karaborsacısı M5 Gold Scalper M5, 5 dakikalık zaman diliminde (M5) kısa vadeli XAUUSD analizi için tasarlanmış teknik bir göstergedir . Potansiyel AL ve SAT kurulumlarını belirlemek için trend yönünü, EMA geri çekilme koşullarını, RSI momentum onayını ve ATR volatilite filtrelemesini birleştirir. Bu gösterge, sinyal mantığını basit ve odaklı tutmakla birlikte, doğrudan grafik üzerinde net bir görsel öneri sunmak üzere tasarlanmıştır. Nasıl Çalışır Gold Scalper M5, sinyal üretmeden önce
FREE

Gold doesn’t forgive a bad entry. It sweeps stops, tricks anyone reading the candle at face value, and reverses right when everyone’s convinced the trend is set. RBM Gold Liquidity Hunter shows you exactly where those traps happen, before you walk into one.
The indicator maps yesterday’s high and low automatically and draws the Asian session range live on your chart, that window that usually decides where the day is headed once London and New York show up. When price breaks one of those levels
FREE

TrendIQ Pro — MT5용 적응형 변동성 추세 지표 TrendIQ Pro는 적응형 변동성 인텔리전스를 통해 높은 확률의 매수/매도 시그널을 원하는 포렉스, 골드(XAUUSD), 지수, 크립토 및 스캘핑 트레이더를 위해 설계된 전문가급 MT5 추세 거래 지표입니다. 고급 ATR 기반 추세 감지, 엘러 슈퍼 스무더(Ehlers Super Smoother) 필터링, 모멘텀 스코어링 및 다이내믹 추세 클라우드 기술을 기반으로 구축된 TrendIQ Pro는 MetaTrader 5 트레이더에게 리페인팅(값 재지정) 없는 깔끔한 추세 시그널, 스마트한 풀백(조정) 진입 시점, TP/SL 시각화 및 실시간 시장 구조 분석을 제공합니다. M1, M5, M15, H1, H4를 포함한 모든 타임프레임에서 인트라데이(당일 매매), 스윙 트레이딩 및 스캘핑에 최적화되어 있습니다. 주요 특징 리페인팅 없는 매수 및 매도 시그널 (Non-Repainting) 적응형 변동성 추세 엔진 스마트 추세 클라우
FREE
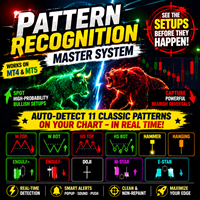
Product Overview Pattern Recognition Master System is a main‑chart classic candlestick pattern auto‑recognition indicator designed for both the MT4 and MT5 platforms. It automatically detects and labels eleven classic reversal and continuation patterns on the main chart, covering double tops and bottoms, head‑and‑shoulders tops and bottoms, hammer and hanging man, engulfing, doji, and morning and evening stars, with an independent cooldown period assigned to each pattern category to suppres
FREE
A simple indicator that automatically highlights all FVGs (Fair Value Gaps) formed on the chart, as well as FVGs on history. It is possible to select colors for FVGs of different directions (long or short), select the time interval, select the color of middle point and you can also choose whether to delete filled FVGs or leave them on the chart (the option is beneficial for backtesting). The indicator can be very useful for those, who trade according to the concept of smart money, ICT, or simply
FREE

AI Range Compression Scanner automatically finds periods of tightening volatility - price squeezes - and highlights them as a shaded zone on the chart, then marks the breakout the moment price escapes the squeeze. Volatility contraction almost always precedes an expansion move, and this indicator lets you see it building in real time. The indicator continuously compares a short-term price range against a longer-term baseline range. When the short-term range compresses below your chosen percentag
FREE

무료 — 지지/저항 자동 레벨: 전일 고가/저가, 전주 고가/저가, 라운드 넘버(정수 가격대)를 자동으로 그리고 항상 최신 상태로 유지합니다.
100% 무료이며 어떤 제한도 없습니다. 이 도구가 차트에 자리 잡는다면, 짧은 리뷰 하나가 저희에게 가장 큰 도움이 됩니다 — 30초면 충분하고, 다른 트레이더가 이 도구를 발견하는 계기가 됩니다.
플랫폼: MetaTrader 5 전용 — MetaTrader 4 버전은 없습니다.
대부분의 데이트레이더가 매일 아침 손으로 긋는 바로 그 레벨입니다. 이 인디케이터는 이를 자동으로 그리며 절대 낡은 상태로 두지 않습니다.
=== 그리는 내용 ===
- 전일 고가/저가 — 실선(기본 파랑).
- 전주 고가/저가 — 파선(기본 보라).
- 라운드 넘버 레벨 — 점선(기본 회색), 현재가 위아래로 설정한 개수만큼.
- 각 선에는 이름과 정확한 가격이 툴팁으로 표시됩니다.
=== 리페인팅 없음 ===
일간·주간 레벨은 완성된 D1/W1 봉에서
FREE

The Breakout Finder (BF) is a technical analysis indicator designed for MetaTrader 5 (MT5) platforms. It identifies potential breakout and breakdown patterns in price action by analyzing pivot highs and lows over a specified period. The indicator detects "cup" formations—clusters of pivot points within a narrow price channel—indicating areas of consolidation that may lead to strong directional moves when broken. EA: BlackHole Breakout EA https://www.mql5.com/en/market/product/149206
Key Featur
FREE

======================================================== OFX orderflow — MQL5 MARKET PRODUCT DESCRIPTION (formatting notes: **bold** = editor Bold button; lines starting with "•" = bullet-list button; UPPERCASE lines = section headings) ========================================================
SHORT TITLE (product name field): OFX orderFlow — CMF + MFI Money-Flow & Divergence for XAUUSD (Gold)
------------------------------------------------------- OVERVIEW ---------------------------------
FREE
TimeLeftCandle – Countdown Clock for Candles in MT5 Overview
TimeLeftCandle is an indicator for MetaTrader 5 that displays in real time the remaining time until the current chart candle closes. Its design is minimalist, clear, and movable, adapting to any type of chart and trading style. Ideal for traders who need to precisely track candle closing times and make timely decisions. Main Advantages Clear and precise display: A digital-style counter to know exactly how much time is left before the
FREE
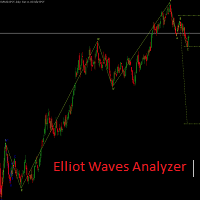
Elliot Waves Analyzer calculates Elliot Waves to Help Identify Trend direction and Entry Levels. Mainly for Swing Trading Strategies. Usually one would open a Position in trend direction for Wave 3 or a Correction for Wave C . This Indicator draws Target Levels for the current and next wave. Most important Rules for Elliot Wave Analysis are verified by the Indicator. This free version is limited for Analyzing one Timperiod Waves. Waves are Shown only in PERIOD_H4 and above. Not Useful for Intr
FREE
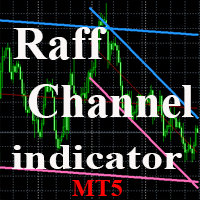
The indicator plots a trend channel using the technique by Gilbert Raff. The channel axis is a first-order regression. The upper and lower lines show the maximum distance the Close line had moved away from the axis line. Therefore, the upper and lower lines can be considered as resistance and support lines, respectively. A similar version of the indicator for the MT4 terminal
As a rule, most movements of the price occur within a channel, going beyond the support or resistance line only for a sh
FREE

어제의 고가와 저가, 주간 시가, 지난주 변동폭. 대부분의 트레이더가 매일 아침 손으로 다시 긋는 바로 그 선들입니다. Daily Weekly Monthly Key Levels 는 쓰시는 브로커의 봉에서 이 선들을 자동으로 그리고, 현재가가 각 구간에서 얼마나 떨어져 있는지 알려 줍니다. 아무리 확대해도 사라지지 않습니다. 화면 밖으로 나간 구간은 차트 가장자리에 붙어 이름과 가격이 적힌 가격 칩과 화살표로 남기 때문입니다. 신호 없음, 리페인트 없음, 차트가 지저분해지지도 않습니다. 무엇을 그리는가 전일 고가, 저가, 종가. 전주 고가와 저가. 일간 및 주간 시가 . 장중에 많이 주시하는, 진행 중인 시가입니다. 전월 고가와 저가 (선택). 각 구간은 이름이 붙은 선이고 기간별로 색이 다릅니다. 간결한 패널이 기간별로 묶어 모든 구간과 그 가격, 그리고 현재가가 얼마나 떨어져 있는지 보여 줍니다. 거리는 핍, 가격, 퍼센트 중에서 골라 표시할 수 있습니다.
FREE

시장 구조로부터 평행 채널을 자동으로 구축 — 수동으로 그릴 필요 없이 채널이 스스로 가격을 따라갑니다. • 알고리즘이 최근 3개의 피벗(고점 2 + 저점 1 또는 저점 2 + 고점 1)을 추적해, 그중 두 점을 지나는 메인 레이와 세 번째 점을 지나는 평행 레이, 그리고 중간선을 그립니다. • 채널 색상이 기울기를 반영: 상승인지 하락인지 한눈에. • 피벗 위에 HH / HL / LH / LL 구조 라벨. • 업데이트 모드: HTF 캔들 마감, 차트 캔들 마감, 또는 매 틱. • 멀티 타임프레임: 여러 타임프레임의 채널을 한 차트에. • 채널 라인 터치 알림(기본값은 꺼짐). 차트 위 컨트롤 패널: 타임프레임 선택과 설정 창이 있는 드래그 가능한 패널 — 11개 인터페이스 언어, 다크/라이트 테마, 18색 팔레트, 30–300% 패널 크기 조절. 모든 설정은 자동 저장됩니다. 사용 중 문제나 버그를 발견하시면 언제든지 연락해 주세요. 신속하게 수정해 드리겠습니다. 그리고 리뷰도 남
FREE
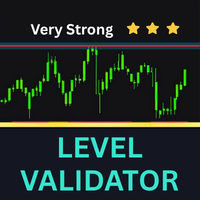
Level Validator - 터치 검증을 통한 지지와 저항
어떤 레벨이 정말 중요한지 더 이상 추측하지 마세요. 수평선 하나만 그으면 Level Validator가 자동으로 가격 영역으로 감싸고, 해당 레벨에 닿은 모든 캔들을 세고, 그 강도를 평가합니다. 차트의 임의의 선이 아니라 실제로 검증된 레벨을 거래할 수 있습니다.
기능
- 각 선 주위의 자동 영역: 영역의 절반 폭을 포인트로 설정하면, 지표가 한눈에 읽을 수 있는 깔끔하고 구성 가능한 영역을 그립니다.
- 터치 카운터와 강도 등급: 각 레벨이 실제 터치 횟수를 별 등급(약함, 보통, 강함, 매우 강함)과 함께 표시합니다. 강한 레벨은 색상과 별로 두드러집니다.
- 멀티 차트 동기화: 한 차트에 레벨을 그리면 같은 종목의 모든 차트에 자동으로 나타납니다. 모든 시간대에서 하나의 레벨 세트를 관리하세요.
- 조정 가능한 카운트 구간: 드래그할 수 있는 수직 시작선이 터치 집계가 시작되는 지점을 정의하여, 오래되고
FREE

GF MACD MA Cross Indicator for MT5 See momentum, trend and reversals in one sub-window, with alerts that tell you when to look. GF MACD MA Cross builds on a standard MACD (8, 18, 5) and applies three moving averages to the MACD data itself. Instead of watching price and MACD separately, you read momentum shifts directly in the sub-window and get arrows and popups when they happen. Key Features MACD background (8, 18, 5): a familiar momentum view that shows strength building or fading. Moving ave
FREE
전문가 자문(Expert Advisor) 버전 수동 신호 대신 자동 매매를 선호한다면, 이 지표의 전문가 자문 버전을 여기에서 확인할 수 있습니다: https://www.mql5.com/en/market/product/148310
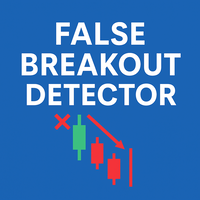
False Breakout Detector 는 가격이 최근 지지선 또는 저항선을 잠시 돌파한 후 다시 범위 내로 되돌아오는 가짜 돌파(fail breakout) 상황을 자동으로 감지하는 기술적 분석 도구입니다. 이러한 시나리오는 역추세 전략 이나 비유효한 브레이크아웃 식별 에 유용할 수 있습니다. 주요 기능: 최근 N개의 캔들에 대한 가짜 브레이크아웃 자동 감지 화살표, 선, 배경 색상 을 이용한 직관적인 시각적 표시 팝업 및 푸시 알림 지원 , 실시간 신호 확인 가능 사용자 설정 가능 : 분석할 캔들 수, 핍 허용 오차, 화살표 거리, 색상 등 경량화된 고속 코드 , 백테스트 및 실거래 모두에 적합 호환성: 타임프레임 : M1 ~ H4 대상 자산 :
FREE
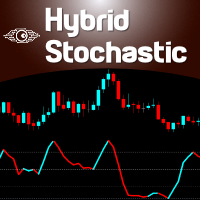
The Hybrid Stochastic indicator is a Stochastic RSI described by the famous Tushar Chande and Stanley Kroll in their book called " The New Technical Trader" . The main goal of this indicator is to generate more Overbought and Oversold signals than the traditional Relative Strength indicator (RSI). Combining these 2 indicators expands the range of the overbought and oversold territory. The idea behind it is to use the Stochastic formula over RSI values. If you want to know more about its internal
FREE

Artemis RSI는 시장에 맞춰 스스로 조정되는 MetaTrader 5용 무료 RSI 지표입니다.
일반 RSI는 항상 같은 기간과 같은 레벨을 사용하지만, 시장은 계속 변합니다. Artemis는 60가지 RSI 설정을 동시에 테스트하고 지금 시장에 가장 잘 맞는 설정을 보여줍니다.
제공 기능: - 현재 시장에 가장 잘 맞는 RSI 라인 - 시장에 따라 움직이는 과매수·과매도 레벨 - 시장 상태(횡보, 추세, 조용함, 노이즈)를 알려주는 작은 패널 - 자동으로 그려지는 일반 다이버전스와 히든 다이버전스 - 전환점에 표시되는 매수·매도 화살표
모든 종목과 모든 타임프레임에서 작동합니다: 외환, 금, 지수, 암호화폐.
Artemis RSI는 차트를 읽기 위한 도구입니다. 대신 거래하지 않습니다.
무료, MetaTrader 5용, TradeToolsOfficial 제공.
FREE

Harmonic Signal Alerts is a free indicator for MetaTrader 5 that finds ABCD, Gartley and Bat patterns on the chart. When price reaches a pattern's potential reversal zone, it draws the XABCD lines, the zone and an arrow. It can also alert you. It works only from swings that are already confirmed and from closed bars. A pattern is drawn on the bar where it became known. It is never moved or removed afterwards. Quick start Attach the indicator to a chart. It scans the last 3000 closed bars. Leave
FREE

AI Trend Strength Meter ADX Dashboard tells you, at a glance, whether a symbol is actually trending or just chopping sideways - across six timeframes simultaneously. Using the classic Average Directional Index (ADX) plus its +DI/-DI components, it classifies every timeframe as Weak/Range, Trending, or Strong Trend, along with the current directional bias. KEY FEATURES
- Calculates ADX, +DI, and -DI on six timeframes at once: M15, M30, H1, H4, D1, and W1.
- Classifies trend strength into three cl
FREE

ICT Enter Here V1.1 — 깔끔하고 간단한 ICT 신호 초보자도 쉽게 사용할 수 있는 전문 ICT 인디케이터입니다. 차트를 복잡하게 만들지 않고 명확한 매매 신호를 제공합니다. 주요 기능: Order Block 숨김 — 오더블록 구역을 자동으로 숨겨 차트를 깔끔하게 유지합니다. 명확한 매수・매도 화살표: 녹색 화살표 = 매수(BUY) 신호 ("Enter Here") 빨간색 화살표 = 매도(SELL) 신호 ("Enter Here") 유동성 스위프 신호 (SSL/BSL) — 가격이 고점이나 저점을 쓸어갈 때 강력한 "Enter Here (LS)" 화살표 표시. 강・약 Order Block 화살표 — 녹색은 상승 OB, 빨간색은 하락 OB. 자동 손절점 표시 — 추천 SL(스탑로스) 위치를 명확하게 보여줍니다. 트레이드 추적 라인 — 진입부터 청산까지 경로와 손익을 표시. 실시간 대시보드 — 현재 신호, 진입 가격, SL, 거래 상태를 한눈에 확인. 실시간 손익(P&L) 표시
FREE
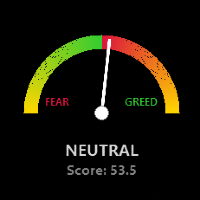
Global Market Risk Sentiment Meter 1. Overview
The Global Market Risk Sentiment Meter is an analytical indicator designed for the MetaTrader 5 (MQL5) platform. It employs an Inter-Market Analysis approach to assess the aggregate data of specific global financial markets. By evaluating real-time price changes across US Indices, Global Equities, Cryptocurrencies, and historical Safe Haven assets (Gold and the US Dollar Index), the indicator calculates a composite sentiment score. This data is vis
FREE
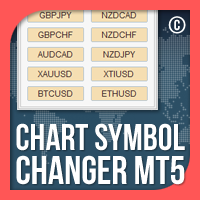
MT5용 차트 심볼 체인저는 패널에서 심볼 버튼을 클릭하여 첨부된 현재 차트 심볼을 변경할 수 있는 옵션을 제공하는 표시기/유틸리티입니다. MT5용 Chart Symbol Changer는 가장 관심을 갖고 거래하고 싶은 쌍을 추가하여 32개의 기호 버튼을 개인 취향에 맞게 구성할 수 있는 옵션을 제공합니다. 이렇게 하면 몇 번의 클릭만으로 차트에서 시장을 더 빨리 볼 수 있기 때문에 기회를 절대 놓치지 않을 것입니다.
MT5용 차트 심볼 체인저 설치/사용 설명서 | 구매한 제품의 업데이트
특징 동일한 차트에서 좋아하는 악기를 모니터링할 수 있는 패널의 32개의 사용자 정의 가능한 기호 모든 기호/도구, 계정 유형 또는 브로커에서 원활하게 작동
MT5용 차트 심볼 체인저는 일반적으로 거래 및 위험 관리와 수동 거래를 돕기 위해 거래 패널의 형태로 제공됩니다. 수동 무역 패널 MT5: https://www.mql5.com/en/market/prod
FREE
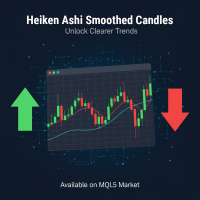
Heiken Ashi Smoothed 지표 (MT5 전용) 노이즈 제거 + 스무딩 기능 탑재 Heiken Ashi. 가짜 신호 감소, 트렌드 조기 포착. 외환, 지수, 암호화폐에 최적 (H1-D1). 작동 원리 및 스무딩 방식 기존 Heiken Ashi는 과거 시가・종가・고가・저가를 평균화하여 캔들을 계산, 이미 작은 변동 영향을 줄입니다. 그러나 Heiken Ashi Smoothed 는 "원시" 가격(raw)에 추가 스무딩 필터를 적용하여 이 접근을 향상시킵니다. 직접 가격 대신 이동평균(EMA 또는 SMA, 설정 가능)을 사용해 입력 데이터를 처리, 더 안정적이고 유연한 트렌드를 나타내는 캔들을 생성합니다. 이 스무딩 과정은 두 단계로 진행됩니다: 기본 Heiken Ashi 계산 : 가격을 평균화하여 초기 캔들 형성. 강세 캔들(보통 녹색 또는 백색)은 상승 트렌드, 약세(적색 또는 흑색)는 하락 트렌드를 나타냅니다. 재귀적 스무딩 : 결과에 이동평균 적용, 돌발 피크 제거 및
FREE

Contextualize the Narrative: Multi-Timeframe Structure Simplified The HTF Period Cycles is a high-performance visualization tool designed for traders who need to anchor their intraday analysis to Higher Timeframe (HTF) levels without the friction of switching tabs. By projecting the Open, High, Low, and Close (OHLC) of completed HTF cycles directly onto your lower timeframe (LTF) chart, you can maintain a crystal-clear bias while executing in the "now." Why This belongs in Your Toolkit Successfu
FREE

Aggression Volume Indicator is the kind of indicator that is rarely found in the MQL5 community because it is not based on the standard Volume data provided by the Metatrader 5 platform. It requires the scrutiny of all traffic Ticks requested on the platform... That said, Aggression Volume indicator requests all Tick Data from your Broker and processes it to build a very special version of a Volume Indicator, where Buyers and Sellers aggressions are plotted in a form of Histogram. Additionally,
FREE

MetaTrader 5용 KS 패턴 지표
이 지표는 모든 차트와 시간대에서 캔들스틱 및 프라이스 액션 패턴을 자동으로 식별합니다.
감지되는 캔들스틱 패턴 (ShowCandlestick = true 설정 시 활성화):
Doji (도지) – 시장의 불확실성을 나타내는 중립 패턴 ("Doji")
Bullish Engulfing (상승 장악형) – 강세 반전 신호 ("Bullish Engulfing")
Bearish Engulfing (하락 장악형) – 약세 반전 신호 ("Bearish Engulfing")
Hammer (망치형) – 강세 반전 신호로, 잠재적 바닥권에서 자주 출현 ("Hammer")
Shooting Star (유성형) – 약세 반전 신호로, 잠재적 천장권에서 자주 출현 ("Shooting Star")
Morning Star (샛별형) – 강력한 강세 반전 패턴 ("Morning Star")
Evening Star (석별형) – 강력한 약세 반전 패턴 ("Evening St
FREE

======================================================== OFX CVD — MQL5 MARKET PRODUCT DESCRIPTION (formatting notes: **bold** = editor Bold button; lines starting with "•" = bullet-list button; UPPERCASE lines = section headings) ========================================================
SHORT TITLE (product name field): OFX CVD — Cumulative Volume Delta + Divergence for XAUUSD (Gold)
------------------------------------------------------- OVERVIEW ------------------------------------------
FREE

AI Volume Profile Session Indicator plots a professional, session-by-session Volume Profile directly on your chart - the same tool institutional and prop-firm traders use to identify where the real trading activity happened, automatically rebuilt fresh for every new session with zero manual work. KEY FEATURES
- Automatically detects each new trading session (day) and builds a complete volume-by-price histogram for that session using tick-volume-weighted bar overlap.
- Highlights the Point of Con
FREE

SMC Zones is a free smart money concepts indicator for MetaTrader 5. It draws order blocks, fair value gaps and BOS / CHoCH structure lines on any symbol and timeframe, with alerts for new and touched zones. It is a charting tool. It draws zones and sends alerts; it places no trades and does not say when to buy or sell. Every zone is decided on a closed bar, so it does not repaint. Standalone: everything is built in. You do not need to buy or install any other product named on this page. Quick s
FREE
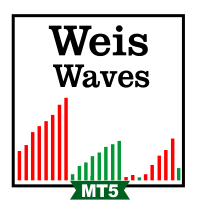
The Weis Waves RSJ Indicator sums up volumes in each wave. This is how we receive a bar chart of cumulative volumes of alternating waves. Namely the cumulative volume makes the Weis wave charts unique. It allows comparing the relation of the wave sequence characteristics, such as correspondence of the applied force (expressed in the volume) and received result (the price progress).
If you still have questions, please contact me by direct message: https://www.mql5.com/en/users/robsjunqueira/
FREE

Professional Volume Weighted Average Price (VWAP) indicator for MetaTrader 5.
FEATURES: - 6 modes: Session, Daily, Weekly, Monthly, Rolling, Custom - Dynamic color line: Green above VWAP, Red below VWAP - Volume-weighted standard deviation bands (adjustable multiplier) - Auto session detection with reset - Smart volume handling (real/tick volume fallback) - Non-repainting calculation - Works on all symbols and timeframes
INPUTS: - VWAP Mode: Choose calculation method - Anchor Timeframe: For c
FREE
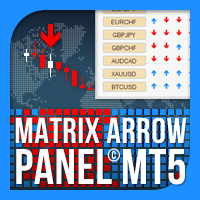
Matrix Arrow Indicator Multi Timeframe Panel MT5 는 Matrix Arrow Indicator MT5 를 위한 무료 추가 기능이자 훌륭한 자산입니다. 5개의 사용자 맞춤형 타임프레임과 총 16개의 수정 가능한 기호/기기에 대한 현재 매트릭스 화살표 표시기 MT5 신호를 보여줍니다. 사용자는 Matrix Arrow Indicator MT5 로 구성된 10개의 표준 표시기를 활성화/비활성화할 수 있습니다. Matrix Arrow Indicator MT5 에서와 같이 10개의 모든 표준 지표 속성도 조정 가능합니다. 매트릭스 화살표 표시기 다중 시간 프레임 패널 MT5는 16개의 수정 가능한 기호 버튼 중 하나를 클릭하여 첨부된 현재 차트를 변경할 수 있는 옵션도 제공합니다. 이렇게 하면 다른 기호 간에 훨씬 빠르게 작업할 수 있고 다시는 거래 기회를 놓치지 않을 수 있습니다.
이 무료 Matrix Arrow Indicator Multi Timef
FREE
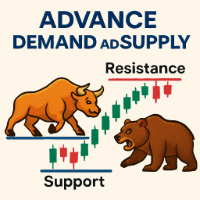
This Demand & Supply Zone Indicator with Volume Filtering is a technical analysis tool for MetaTrader that identifies key price zones where buying (demand) or selling (supply) pressure is concentrated. It uses fractals, volume analysis, and price action to detect and highlight these zones on the chart. Key Features: Zone Detection Based on Fractals Identifies demand (support) and supply (resistance) zones using fractal patterns (local highs/lows). Zones are formed from open prices ar
FREE

Smif — Statistical Market Inflection Forecasting
Smif shows where the current price move is likely to run out of steam, and what has typically happened after moves like it. Instead of fixed pip targets, every forecast is based on how this symbol has actually behaved in the past. Each one shows a suggested entry, stop loss and take profit, the number of past cases behind it, and how often those levels were reached. When there isn't enough evidence for a solid setup, Smif shows no forecast at all
FREE
MetaTrader 마켓은 과거 데이터를 이용한 테스트 및 최적화를 위해 무료 데모 거래 로봇을 다운로드할 수 있는 유일한 스토어입니다.
어플리케이션의 개요와 다른 고객의 리뷰를 읽어보시고 터미널에 바로 다운로드하신 다음 구매 전 트레이딩 로봇을 테스트해보시기 바랍니다. 오직 MetaTrader 마켓에서만 무료로 애플리케이션을 테스트할 수 있습니다.
