 MetaTrader 5
 Experts
 지표
지표 라이브러리
라이브러리 유틸리티
유틸리티 위젯
위젯 규칙
규칙MetaTrader 4용 Expert Advisor 및 지표 - 124
 트레이딩 로봇은 자동으로 시장거래를 수행하는 반면 지표는 가격을 더 잘 분석하고 가격 행동을 예측할 수 있게 해줍니다.
이러한 어플리케이션을 사용하면 MetaTrader 4에서 더 많은 기회를 포착하는 동시에 보다 정보에 입각한 방식으로 거래를 수행할 수 있습니다.
트레이딩 로봇은 자동으로 시장거래를 수행하는 반면 지표는 가격을 더 잘 분석하고 가격 행동을 예측할 수 있게 해줍니다.
이러한 어플리케이션을 사용하면 MetaTrader 4에서 더 많은 기회를 포착하는 동시에 보다 정보에 입각한 방식으로 거래를 수행할 수 있습니다. 
This is a simple indicator to show if global and local trend directions are the same. It uses two timeframes, a "local" timeframe and a higher order "global" timeframe. The indicator shows price action only and has no lag. It generates a square wave (green line), the output signal is above zero if the price tendency is bullish upward, and below zero for bearish downward tendency. The red line shows the tendency of a higher order timeframe (the global tendency). The idea is to trade long when pri
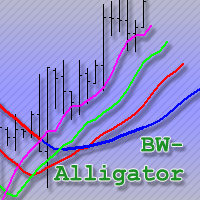
An improved version of the classic Alligator indicator by Bill Williams.
Description The Alligator technical indicator is a combination of moving averages (balance lines). Blue line (Alligator Jaw) is a 13-period smoothed moving average, shifted by 8 bars into the future; Red line (Alligator Teeth) is an 8-period smoothed moving average, shifted by 5 bars into the future; Green line (Alligator Lips) is a 5-period smoothed moving average, shifted by 3 bars into the future; Purple line (Fast Gato

The main goal of the indicator is to determine the most optimal points of entry and exit from a trade. The indicator consists of three parts. The first one is arrows displaying the most efficient market entry/exit points. The up arrow is a buy signal, the down arrow is a sell one. The indicator contains an analytical analysis algorithm that includes a set of standard indicator readings, as well as a custom algorithm. The second part is data in the upper right corner (works on М1-D1 timeframes) o

The Master Pivot indicator is a very interesting generator of static levels based on historical percentage variation. The levels are completely customizable changing the input numbers. Period can also be modified to select the preferred Time Frame. The color is flexible so you can change color easily, we recommend a red color upper and lower green for a contrarian style, conversely instead for a style follower trend. This indicator used in a confluent way offers some really interesting ideas.
I

This indicator displays the short-term trend direction and flat areas in the same way as the classic Heiken Ashi indicator, but it is not plotted using candles or a moving average, but rather the Skynet Moving Average indicator.
Advantages no delay, or a slight delay when using the 'smooth' parameter. customizable parameters for any price data and timeframes. visualization of the flat and the short-term trend. unlike the classic Heiken Ashi indicator, the frequency of candles changing from bull

The indicator displays potential entry points on a trend, displaying buy level, sell level and golden point which will determine where to get out of the trade or trail your stops. If an entry is detected, the indicator shows and Arrow, either pointing down for Short and up for Long positions. When the golden point is passed during a trade, it will start drawing potential points for trailing, is then up to you how to manage your trade. This indicator has been built for best results on H1 Time fra
Buy or rent it and request a copy of the Antimartingale EA for free Trendline based utility, you design your trendlines or horizontal lines, the EA opens trades for you Possibility to trade on break and/or bounce events Indipendent break and bounce settings Configurable market, stop and limit orders T1T2 Logic to lock profits and minimize losses Trailing Stop Loss Max Spread check Notifies you when your trendlines are crossed No strange trendline name or syntax, you decide the color of tr

The algorithm of this Expert Advisor determines the significant price levels, where the trend often turns into a flat or reverses. Stochastic Oscillator serves as an additional filter of overbought/oversold zones. The EA sets stop loss and take profit after opening an order. The underlying trailing strategy applies a trailing stop. The EA is recommended for simultaneously use on three trading instruments: EURUSD M5, GBPUSD M5, EURCHF M5. Settings:
Comment to order - comment to orders. MaxRisk -
xCalper Triad works as a Target scanner tool. Its algorithm calculates price level areas with high precision and instantly. By default, they are automatically identified and the trader normally sets visual parameters only. Explore a new perspective in price action analysis by adding Triad to your setup and surprise yourself.
Main Features Automatic & exclusive Target levels Daily candle representation in all intraday timeframes. Side panel information essential to all traders: Remaining time to
A trend indicator based on the Ichimoku Kinko Hyo and Candlestick. The Scanner Trend Indy is an improved variant of the Ichimoku Kinko Hyo and Candlestick, which shows the moment of trend following quite accurately. It is often used as a signal filter. Combination of two indicators makes a better use of these advantages: Ichimoku Kinko Hyo identifies the trend, while Candlestick determines the short-term movements and signals in the trend direction.
Messages/sounds (notifications and sound sett

Fibo Reversals is an indicator which has carefully been put together to attempt to indicate a time period in which an ongoing trend is most probably exhausted and a new trend (actually a reversal trend) inadvertently begins. At this, it should be okay for the manual trader to be on the look out for good trading opportunities.
Input Settings Father Fibo – This Input Determines The Highest Price For The Chosen Input Period. Son Fibo - This Input Determines The Lowest Price For The Chosen Input

The Trading Assistant can apply automatic exits, set pending orders when trading is closed, scale trades and much more. The tool is easy to handle and clear, it works smoothly with one or more orders.
Features Scheduling of pending and market order - useful for time based strategies or for preparing an order when the market is closed Automatic stop to break-even point for position protection Independent profit taking by the crossing of two moving averages - ideal for trend strategies Finely adj

The support and resistance levels are among the main components of the entire technical analysis. They are used both by professional traders and by beginners. Prices usually move within the price channels. The upper boundary of such a channel is called resistance, and the lower one is support. This indicator plots fractal support and resistance lines at the highest and lowest local price values (fractals).
Distinctive features Does not redraw. Clear and understandable signals. It is possible to

This Expert Advisor is based on the Money Flow Index (MFI) and using a trend-based trading strategy. The Money Flow Index used to evaluate oversold and overbought market conditions. MFI values of 80 and over indicate overbought conditions, meanwhile, values of 20 and below indicate oversold conditions. In addition, if the MFI is below ( Buy_MFIBelow ) and not above the overbought level , it indicates the buy signal. On the other hand, if MFI is above ( Sell_MFIAbove ) and not below the oversold

Algorithm of this system is based on Bill Williams' Alligator indicator . This represents the Jaw, the Teeth and the Lips of the Alligator. It was designed to help confirm that a trend is in effect and in what direction. As with all moving averages, the shortest one (green) moves first, followed by the middle (red) and then longer average (blue). Creator Bill Williams used 13, 8 and 5-period averages, brought forward 8, 5 and 3 periods, respectively. Colors are usually blue, red and green, respe

A trend indicator based on the Ichimoku Kinko Hyo and MACD. The ICloud Scalper Trend Indy is an improved variant of the Ichimoku Kinko Hyo and MACD, which shows the moment of trend following quite accurately. It is often used as a signal filter. Combination of two indicators makes a better use of these advantages: Ichimoku Kinko Hyo identifies the trend, while MACD determines the short-term movements and signals in the trend direction.
Messages/Sounds (Notifications and sound settings) ON/OFF -

This indicator analyzes in parallel the moving average for multiple currencies and timeframes. It sends a notification when the trends are in alignment for all timeframes. To get better assessment of the trend strength, it shows as well a ratio between the number of pips reached from the current trend and the average of pips reached from the previous trends.
Features Loads automatically historical price data from broker server; Tracks all currency pairs for all timeframes in parallel; Configure

This indicator is using the Central Limit Theorem in combination with historical volatility and Fibonacci ratios in order to create unique type of chart tool called Projected Volatility Distribution. This tool allows you to perform highly accurate intraday technical analysis where in a split second you can detect overbought and oversold conditions as well as strong trends. In addition you have at your disposal multi-functional panel which shows signals in real time and gives you the ability to o

This trading system is based on criteria of various technical indicators . These include fractals , Alligator and ADX (measuring trend strength with average directional movement index) . This algorithm uses a hedging strategy in the zone of volatility. To explain it: if fractal to buy is above the Alligator's Teeth line, the pending Sell Stop order to open the position should be placed 1 point below the low bar, which formed a fractal. If the fractal to sell is below the Alligator's Teeth line,
The strategy is based on RVI oscillation to check the prices trend and direction and check the moving avarages (Open Price and Low Price) to decide about the viability of opening any order. Market is very unpredictable due to economic news published every hour, but our EAs are really prepared for such hostility due to its protections. This Expert Advisor is provided with two kinds of indicators: an oscilator (RVI) in order to check the prices oscillation limit pattern and direction trend; two Mo
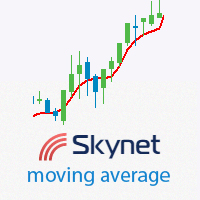
This indicator displays the trend direction, the averaged price value and flat areas. It is used to determine the averaged price value with little or no delay. During a flat, its line is often smooth, and it follows the trend during a descending or an ascending movement. The best charts for the indicator are the range\renko charts, which do not have rounded borders of price changes. Various types of moving averages and certain types of digital filters were used as a prototype. Compared to variou

The Expert Advisor trades using the Stochastic indicator with the specified parameters. A trade is opened at the crossover of the specified levels. The default levels are K = 11, D = 3, Sl = 3. The EA opens a trade when overbought and oversold levels specified by the trader are crossed. Trades are closed by Take Profit levels, which are hidden form the broker. If a wrong direction is chosen, the EA opens an averaging grid of orders. If there is no signal for opening a position by Stochastic indi

An original trading robot for Forex trading. It opens deals in two directions at the same time. When the first order is closed, the EA tries to bring the second one into profit and to close it. If the market price moves against the order, then the EA places a group of orders against the price movement and opens an additional order in proportion to the price movement with a certain coefficient. Orders are closed when the entire grid of orders reaches a total profit. It is recommended to trade cur

Real-time trend, pricing, and volume details in the corner of the current chart. This indicator displays useful trend, pricing, and volume information in the corner of the current chart. With this indicator, you get real-time market trend, pricing (Ask, Bid, spread, Open, High, Low, change from previous bar Close), and volume (current, High, average). After the indicator is executed, you will see this real-time data in the upper right-hand corner of the chart or an alert indicating that an error

Currencies Cleaner panel will give you an overview of all the most traded market's currencies in a single click. First of all the panel will refresh all your charts, opening them four times in all timeframes needed.
1 - CURRENCIES It uses a complex algorithm to study the movement of 17 different indicators. It means that the algorithm not only "reads" the actual value of an indicator, but also creates a probability of success using the position of this value on the indicator and the last moveme
DSProFx TrendLine Expert Advisor is a semi-automatic Forex robot that can be used for scalping and day trade as well. It works based on Trend Line.
Concept, Timeframe and Pairs DSProFx TrendLine works in all time frame. Trades will be opened if the market price touch the Trend Line that is set for Buy or Sell based on line name . "B" for Buy order and "S" for Sell order. To open more than 1 orders, for example Buy orders : use "B1", "B2", "B3", etc. The trades will be closed by some options:
This EA strategy is result of professional experienced traders demand for trading technique and quality. It has three built-in indicators: ATR to measure oscillation, Bollinger Bands and Moving Avarage to measure Trends. It has some protections like Trailing Stop Loss to protect your profits an Spread limitator to protect your equity and finally an stopout level that you may define by an minimum equity percentage.
General Inputs Closes orders with any profit of value over in currency: this para

제너레이터 프로 평균화를 기반으로 여러 가상 전략(1에서 수십만까지)으로 구성된 전략을 생성할 수 있습니다. 각 가상 전략에는 고유한 유형의 전략(Trend, AntiTrend), 가상 예금, 가상 포지션, 로트가 있습니다. EA는 모든 가상 전략의 운영을 제어하고 모든 운영을 합산하며 거래 계정에서 해당 운영을 수행합니다. 어드바이저 작동 모드
Without_file - 전략이 있는 파일을 사용하지 않는 모드. 모든 가상 전략은 " GENERATOR " 항목에서 선택한 매개변수 범위를 기반으로 생성됩니다. 전략은 임의로( Random_Create_Mode =true ), 전략 수를 설정하거나( Random_Strategies ) 가능한 모든 매개변수를 나열하여 생성할 수 있습니다. From_file - 전략 파일을 사용하는 모드. 생성 단계( Create_Mode )에서 생성된 전략 중에서 몇 가지 기준( Top_Mo
Power Index Fx is a new generation indicator that allows an intelligent multi Timeframe analysis. The indicator is flexible and completely customizable. Its positioning in separate window makes it unobtrusive and extremely functional. Its formula of calculation makes it a fundamental tool for identifying possible moments of continuation in favor of Trend. Power Index Fx is a professional tool able to increase your operational potential.
Input Values DASHBOARD SETTINGS How many symbols to show 2

Heiken Ashi Smoothed Strategy is a very simple but powerful system to get forex market trend direction. This indicator is actually 2 indicators in 1 pack, Heiken Ashi and Heiken Ashi Smoothed Moving Average both included. Because HA (Heiken Ashi) and HAS (Heiken Ashi Smoothed) are calculated in the same one system event with necessary buffers and loop only, so it is the FAST, OPTIMIZED and EFFICIENT HA having the combined indicator of MetaTrader 4. You can choose to display HA and HAS in the sam
The indicator displays divergence and convergence on all instruments. It works on all timeframes. After finding divergence/convergence, the indicator draws a Buy or a Sell arrow according to the detected signal.
Settings Buy - show buy signals Sell - show sell signals Divergence - show divergence on the chart Convergence - show convergence on the chart KPeriod, DPeriod, Slowing - Stochastic settings drawPriceTrendLines - draw a line (of divergence/covergence) on a price chart drawIndicatorTren
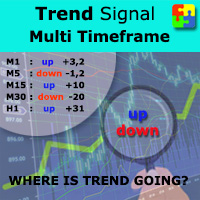
Do you want to always know in a quick glance where price is going? Are you tired of looking back and forth between different timeframes to understand that? This indicator might just be what you were looking for. Trend Signal Multitimeframe shows you if the current price is higher or lower than N. candles ago, on the various timeframes. It also displays how many pips higher or lower current price is compared to N. candles ago. Number N. is customizable The data is shown in a window that you can m

The Relative Strength Index (RSI) was developed by J. Welles Wilder and is a momentum oscillator that identifies overbought and oversold conditions. It is also a popular choice for many traders helping them find entries into the market.
How it Works The simplest way to use the Relative Strength Index is to wait for an overbought or oversold condition and then enter into a trade when the RSI indicates that price is resuming in the dominant direction of the trend. Buy signals : For the first cond
Bond is an Expert Advisor using custom indicators based on candles movements to identify reversal trends and Bollinger Bands. In case of “wrong” entries, the EA uses a grid of orders with increasing lot size (in an exponential way). The grid size is limited for more safety. Attention: this EA cannot be used with other EAs at the same time, for the same symbol and in the same account. This EA is designed to be used with different forex pairs and with some metals, commodities and indices.
Recomme

The objective of the Crypto-Box Indicator is to determine the most efficient entry in trends. . It works for all purposes, standing out in the main cryptocurrencies: BitCoin, LiteCoin, Ethereum and Emercoin. And in Currencies: EURUSD, USDJPY и GBPUSD. The indicator is designed to find the best conditions for financial instruments. Detects acceleration patterns in prices in areas of supports and resistances. The development team is constantly improving the functionality of the Indicator and we th
The Expert Advisor trades using the Stochastic indicator with the specified parameters. A trade is opened at the crossover of the specified levels. The default levels are K = 11, D = 3, Sl = 3. The EA opens a trade when overbought and oversold levels specified by the trader are crossed. Trades are closed by Take Profit levels, which are hidden form the broker. If a wrong direction is chosen, the EA opens an averaging grid of orders.
Expert parameters MAGICB - Long magic number; MAGICS - Short m

Sign of victory is a new indicator based on three digital filters. The indicator plots three histograms in a separate window, and also draws an arrow on the price chart. Each histogram is a digital filter that converts quotes and decomposes them into trends: buy or sell. The examples of market entries using this indicator are shown on the screenshots using arrows. This indicator can help traders better assess the market situation.
Sign of victory features The indicator is perfect for scalping a

I present you an Expert Advisor based on the Martingale system. The trading volume used for opening positions depends on the parameters Lot and Multiplier. Martingale system, which proportionally increases the trade volume according to set parameters, is applied when you open a trade. Please note that the EA features the ability to select the trading direction: Buy or Sell.
Recommendations: Currency pair: any; Timeframe: the EA is optimized for Н1, but any timeframe can be used. Other: the trad
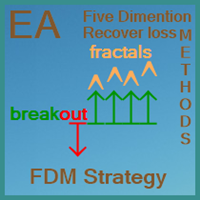
FDM Strategy is an Expert Advisor based on fractals and five dimension method. Five Dimensions expert system is developed based on a theory combining the Chaos Theory with the trading psychology and the effects that each has on the market movement. There is also an ADX (measuring trend strength with average directional movement index) used as a trading filter. Long and Short Trade Signals: If fractal to buy is above the Alligator's Teeth (red line), the pending Sell Stop order must be placed 1 p

IRobot Alligators is an Expert Advisor based on the chaos theory and the Alligator technical indicator. This expert advisor consists of three lines, overlaid on a price chart, that represent the jaw, the teeth and the lips of the Alligator. It was designed to help confirm that a trend is in effect and in what direction. As with all moving averages, the shortest one (green) moves first, followed by the middle (red) and then longer average (blue). If the three lines are entwined, then the Alligato

This indicator shows main trend, entry zone and exit zone. This is a muti-timeframe indicator, so it is always repainting in the current period of the higher timeframe.
Features Colorful Histogram: it indicates the main trend, the tomato means the market is bearish,and the sky blue means the market is bullish. Inner Blue Bands: it is entry zone for entry market, the market is relatively safe for entry. Outer Yellow Bands: it is exit zone for exit market, the market is oversold or overbought.

The Discrete wavelet transform indicator is an enhanced implementation of the numerical and functional analysis for MetaTrader 4, the discrete wavelet transform method (DWT). The specific feature of DWT is the way the wavelet is represented in the form of a discrete signal (sample). DWT is widely used for filtering and preliminary processing of data, for analyzing the state and making forecasts for the stock and currency markets, for recognizing patterns, processing and synthesizing various sign
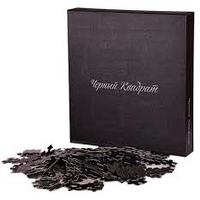
This is an Expert Advisor with the elements of graphics trading. It performs trading operations using the "Rectangle" (or "Square") shape. The Expert Advisor automatically draws a square and opens a Buy or Sell orders when the price crosses its lower or upper bounds respectively. The shape can be drawn manually. For this purpose you should disable the auto drawing feature in the Expert Advisor settings. If the price moves in the wrong direction, the Expert Advisor sets up to four orders in accor

DYJ Sharp advanced algorithm that detects new trends and current trend continuations for use as an entry and exit strategy. The strategy display the SHARP trend demarcation area. This SHARP area has high HighLine and low LowLine. Falling of high below HighLine of SHARP and then falling of close below LowLine of SHARP can be interpreted as a signal to sell. Rising of close above HighLine of SHARP and then rising of low above LowLine of SHARP can be interpreted as a signal to buy. The signal for e
This indicator shows the current market situation relative to the price volatility channel, its external and internal boundaries, displays the last direction of the price movement. The main purpose of the indicator is to identify the trend movement and its boundaries. With a wide channel, it can be used for determining the initial price movement waves. It works on any instrument and any time frame of the chart. It works in 2 different modes: The first mode shows any changes in the channel when t

PDP indicator is used for: defining price probability distributions. This allows for a detailed representation of the channel and its borders and forecast the probability of a price appearing at each segment of its fluctuations; defining the channel change moment.
Operation principles and features
PDP analyzes a quote history on lower timeframes and calculates a price probability distribution on higher ones. Forecast algorithms allow the indicator to calculate probability distributions and mov

This indicator is designed to help traders in determining the market entry and exit points. It is very easy to use: open s BUY deal when the up arrow appears and open s SELL deal when the down arrow appears. The indicator is based on the basic indicators (MA, MACD, RSI) as well as original algorithms. The indicator does not redraw, arrows appear when a new candle opens. Input Parameters:
strength - indicator period EnableAlerts - enable/disable alerts EmailAlert - send notifications to email wh

FXFledgling Exit Tool is a complete risk management tool that analyzes both the open trades and the direction of the pair of open trades. As long as the suggested entry and lotsizing management presented here is followed strictly, you will have a high chance (but no guarantee) of surviving the trade.
What It Does It is used as an exit tool. It helps the trader to manage any manual trade that he transacted. It does the following: Trail Stop Dynamic Stop Loss - a calculated stop-loss that changes

NC Tendency EA is a trending single EA system that supports single currency or multi currency operations. Trend is determined according to the last 20 K-line. Depending on the detected trend, the EA opens either long or short trades. It sends an order in accordance with the trend direction daily at 4:00 am (GMT+2 ). Uses fixed stop loss and take profit, human intervention not needed. It opens only one order per day for each symbol. No new orders will be placed until the order is closed, but a ne
Based on Vitali Apirin's idea, here is a momentum indicator that he describes as a tool to help traders determine the direction of a trend. If the green line is over the red line, the trend is upward; if the red line is over the green one, the trend is downward. The indicator is made up of two separate calculations: the HHs or higher high stochastic, and the LLs or lower low stochastic, which together comprise the HHLLs. Vitali Apirin uses ideas he discovered while studying the stochastic oscill

The Expert Advisor has been specifically developed for trading gold (Spot Gold). The strategy is based on Fibo levels calculated from the previous (first) candle High/Low and the width of the current and lower timeframes channel. If important Fibo levels of different orders are located in a single price channel (within a spread), the EA defines this channel as the target for price movement and starts operation. Martingale and averaging are not used. Each order is independent and is accompanied b

Market Trend - a comprehensive system for determining the trend direction. Analyzes the market using a formula which considers the values of multiple technical indicators and other trading strategies. IT determines not only the current trend direction, but also its movement strength. The indicator is intuitive and very easy to use. The information on the current trend direction and its movement strength are displayed on the chart. If the indicator shows "UP!" then an uptrend is currently present

The Trinity Trend Expert Advisor opens deals along the trend on the M15 timeframe on the GBPUSD, USDJPY, USDCHF currency pairs. EURUSD and USDCAD can also be used. The presence of a trend is determined by a steady price movement over the last 3 days. Next, the rebound is analyzed using a number of indicators and a position is opened along the trend when the MA 34 is broken (examples are shown in the screenshots). Backtests were performed with stop loss = 5000 and take profit = 20. Semi-automatic
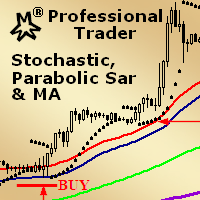
MMM Stochastic, PSAR & MA: This EA's strategy is a combination of two indicators types (Oscillator and Trend) and a Moving Average which helps to enhance the price trends signals and decide to open a new order at the right time. There is an Stochastic (Oscillator) indicator, a Parabolic SAR (Trend) indicator and a Moving Average that you may tune by using the strategy tester optimization to help you to find the best input values that will give you the best results ; It is highly recommended for

Price Shadow EA is a fully automated Expert Advisor. The EA is a medium-term scalper. The EA opens trades when these events occur: The EA searches a main trend, then waits for a medium trend to be exhausted at OBOS levels (pullback). It confirms that medium trend reversal with the indicators. The EA opens a trade with or without a take profit. If the first trade is at a loss and you have not set "Max Orders" to 1, the EA waits for new trade opportunities at that symbol. If you did set Min Distan

ScalpingPro is a new indicator for professional traders. The indicator is a ready-made scalping strategy. The algorithm calculates a micro trend, then searches for price roll-backs and forms a short-term trading signal according to a market price. The indicator consists of a data window and a graphical signal on the chart in the form of an up or down arrow. The data window displays the current trading symbol, spread and appropriate trader's actions: WAIT, SELL and BUY .
Advantages the indicator

Brief Description of the All Trend Lines Indicator The indicator analyzes the wave structure of the market. What it displays on the chart: First. Wave pivots (semaphores)
• Red markers – wave highs
• Yellow markers – wave lows
• Yellow-green markers – additional local extremes Second. Trend lines
• Purple/blue lines – trends based on highs (resistance/support)
• Beige/green lines – trends based on lows
• Lines are built automatically by connecting wave pivots of the same type Third. Main trend

The Vortex Indicator was inspired by the work of an Austrian inventor, Viktor Schauberger, who studied the flow of water in rivers and turbines. Etienne Botes and Douglas Siepman developed the idea that movements and flows within financial markets are similar to the vortex motions found in water. The Vortex Indicator was also partly inspired by J. Welles Wilder's concept of directional movement, which assumes the relationship between price bars gives clues as to the direction of a market. This i

PipTick World Flow indicator is a unique tool that allows traders to see the flow of the global economy in one window. Basically, it shows the current strength of oil, gold, dollar and stock market in one chart. It helps to understand the basic relations and correlations between those markets.
Relationships between markets Oil - The Boss - The whole world economy is based on oil. Oil is the king, the boss of all bosses, the capo di tutti. Oil instructs gold what to do. Gold - The Manager - Gold

This indicator contains a custom version of the classic Turtle Trader indicator. It implements both the main system ( S1 ) and fail-safe system ( S2 ) as described by the original Turtles. Notifications can also be enabled for trade signals. The main rule of the indicator is to generate a signal when a T -period breakout occurs. A stop signal is then generated when an S -period high or low is breached. The T -period value is the number of periods used to evaluate a trend. S -period values are th

Easy to use trend indicator. Only one adjustable parameter that does not require optimization, which is responsible for the timeframe of the second line of the indicator. It can take three values: current - the second line is not calculated, one higher - one timeframe higher that the current one, two higher - two timeframes higher than the current one. The system for determining the market direction is based on a proprietary method, which uses the two most effective standard indicators (CCi and

This unique multi-currency strategy simultaneously determines the strength of trends and market entry points, visualizing this using histograms on the chart. The indicator is optimally adapted for trading on the timeframes М5, М15, М30, Н1. For the convenience of users, the indicator renders the entry point (in the form of an arrow), recommended take profit levels (TP1, TP2 with text labels) and the recommended Stop Loss level. The take profit levels (TP1, TP2) are automatically calculated for

This unique multi-currency strategy simultaneously determines the end of the trend, entry points and the expected take profit levels for each trade. The indicator can determine entry points on any trading period from M1 to D1. For the convenience of users, the indicator renders the entry point (in the form of an arrow), recommended take profit levels (Fast Take Profit, Middle Take Profit, Main Take Profit, Global Take Profit) and the Stop Loss level. The detailed guide on how to use the indicato
The Expert Advisor is based on Williams` Percent Range. The EA trades both during low volatility and a trend if MACD is enabled. Two Williams` Percent Range indicators can be used to enter a trade with different parameters, while the third one can be configured to close a trade. Besides, the EA has the trailing stop and stop loss calculation functions depending on the currency pair movement strength.
Inputs Lots - lot size (if 0, the lot volume is calculated based on the % of account free margi
TrendySignalMt4l is a trend-following indicator that quickly responds to a trend change. The indicator forms the line so that it is always located above or below the chart depending on a trend. This allows using the indicator both for a trend analysis and setting stop loss and take profit. The indicator should be attached in the usual way. It works on any timeframe from M1 to MN and with any trading symbols. The indicator has no configurable inputs.
Recommendations on working with the indicator

Colored trend indicator advanced is a trend indicator that is based on Fast Moving Average and Slow Moving Average and also uses RSI and Momentum to give a trend strength in percent. It is aimed to find more healthy trends with this indicator. This indicator can be used alone as a trend indicator.
Colors (Default) Green = Uptrend (Default) Red = Downtrend No color = No trend, no good trend
Indicator Parameters WarnPosTrendchange: Warns you when the trend may change. FullColor: See screenshot.

"Still" is a trend-based Expert Advisor that looks for trend changes and opens orders in the direction of the new trend. The Moving Average indicator is used as the main signal supplemented by additional integrated confirmation functions. Whenever the signal changes, the opened orders are closed and a new order is opened. Stop levels are used for safety purposes. The EA is tied to the current timeframe. Recommended timeframes are H1 and M30. It can also work on M15 and M5. The recommended curren
This indicator displays the signals of the ADX indicator (Average Directional Movement Index) as points on the chart. This facilitates the visual identification of signals. The indicator also features alerts (pop-up message boxes) and sending signals to e-mail.
Parameters Period - averaging period. Apply to - price used for calculations: Close, Open, High, Low, Median (high+low)/2, Typical (high+low+close)/3, Weighted Close (high+low+close+close)/4. Alert - enable/disable alerts. EMail - enable

The Elize Expert Advisor has been designed to work with the EURCHF currency pair. It considers the peculiarities of this trading instrument, its behavior and dependence on the behavior of other currencies. In particular, when the currencies of the European countries (EURUSD, GBPUSD, EURNOK, EURCHF) move in the same direction, the EA starts its operation and opens a deal in the trend direction of the European currencies. In the event of price rollbacks, the EA uses a unique method for making the
Attention! Friends, since there have been many scammers on the Internet recently selling indicators called ForexGump, we decided to warn you that only on our page is the LICENSE AUTHOR'S VERSION of the INDICATOR sold! We do not sell this indicator on other sites at a price lower than this! All indicators are sold cheaper - fakes! And even more often sold demo versions that stop working in a week! Therefore, in order not to risk your money, buy this indicator only on this site!
Forex Gump Pro is
MetaTrader 마켓은 MetaTrader 플랫폼용 애플리케이션을 구입할 수 있는 편리하고 안전한 환경을 제공합니다. Strategy Tester의 테스트를 위해 터미널에서 Expert Advisor 및 인디케이터의 무료 데모 버전을 다운로드하십시오.
MQL5.community 결제 시스템을 이용해 성능을 모니터링하고 원하는 제품에 대해 결제할 수 있도록 다양한 모드로 애플리케이션을 테스트할 수 있습니다.
